A survival horizon, in bank liquidity, is the number of days a bank could keep paying its obligations under a named stress scenario using only the liquidity it can count on: cash, unencumbered securities after haircuts, and secured borrowing capacity it can really draw. You calculate it by projecting cumulative net outflows day by day under the scenario, setting them against counted liquidity, and finding the last day on which liquidity still covers them. It is hard to get right because every input that decides it, how fast each kind of depositor leaves, which collateral a lender will really take, and whether a borrowing line works on the day, is an assumption, and the 2023 failures got several of them wrong. Botminds' Liquidity Risk Monitoring is an agentic solution that recomputes a bank's survival horizon every morning from its ALM model's stress cash flows and re-runs it on the depositors who actually moved. This guide works the calculation through and shows which inputs matter most.
The worked example below is illustrative arithmetic for a bank with about $20 billion of deposits, not a sample or a real bank. The product screens come from the solution's fictional sample bank, Corvane National Bank. Rules and failure facts are the agencies', linked where they appear.
A liquidity survival horizon, worked: $4.0 billion of counted liquidity lasts 78 days
OvernightWires and sweeps out on day one
Cumulative net outflow$0.35B
Liquidity left$3.65B
Day 7Most uninsured commercial run-off lands early
Cumulative net outflow$1.20B
Liquidity left$2.80B
Day 30The 30-day figure most policies set a buffer on
Cumulative net outflow$2.60B
Liquidity left$1.40B
Day 60Run-off slows; maturing funding keeps leaving
Cumulative net outflow$3.50B
Liquidity left$0.50B
Day 78The last day the bank covers: the horizon
Cumulative net outflow$3.98B
Liquidity left$0.02B
Day 90Short by $0.30 billion
Cumulative net outflow$4.30B
Liquidity left−$0.30B
What is a survival horizon in liquidity?
A survival horizon is a liquidity stress result expressed in days rather than as a ratio: how long the bank lasts if a defined stress begins today and nothing else is done. A liquidity survival horizon of 78 days says that on this scenario's assumptions, counted liquidity runs out on day 79. It is the most intuitive output of an internal liquidity stress test, which is why many policies set a minimum in days and a warning level above it.
The term is not defined in US regulation, but the method is. The 2010 Interagency Policy Statement asks for "robust methods for comprehensively projecting cash flows arising from assets, liabilities, and off-balance-sheet items over an appropriate set of time horizons" and for stress tests "regularly for a variety of institution-specific and marketwide events across multiple time horizons" (Interagency Policy Statement). The FDIC describes stress testing's purpose in terms that make the horizon its natural output: to "determine when and how to access alternative funding sources" and "determine an appropriate liquidity buffer" (FDIC RMS Manual, Section 6.1).
How do you calculate a liquidity survival horizon?
You calculate a liquidity survival horizon in four steps: count the liquidity available on day zero after haircuts, project cumulative stressed outflows net of reliable inflows for each day or bucket, compare the two, and take the last day on which counted liquidity still exceeds the cumulative net outflow. Where the projection is in buckets rather than days, interpolate between the bucket on either side of the crossing.
The survival horizon in three terms
Counted liquidity, L
Cash + unencumbered securities × (1 − haircut) + secured borrowing capacity × (1 − haircut)
Only collateral the lender will take, at the value it will lend on, and only lines that have been tested.
Treasury, checked by the second line
Cumulative net outflow, O(t)
Σ run-off by cohort + maturities not renewed + draws − reliable inflows, to day t
Each cohort with its own rate and timing: uninsured commercial, uninsured consumer, insured, brokered, wholesale, commitments.
ALM model, on assumptions ALCO approves
Survival horizon, H
The last day t on which L − O(t) ≥ 0
Interpolate between buckets; report the minimum across scenarios, and the warning level and minimum beside it.
Monitor, every morning
Applied to the example above: at day 60 the bank has used $3.50 billion of its $4.00 billion, at day 90 it would need $4.30 billion, so the crossing falls 62.5% of the way through the interval, at day 78.75. Reported honestly, the horizon is 78 days, with the scenario and the date of the assumptions printed next to it.
Two choices change the number more than any arithmetic. The first is the scenario: the horizon under a mild market stress and under a combined idiosyncratic and market run are different numbers, and the one that matters is the shortest. The second is whether counted liquidity is the same on day 60 as on day 1. Collateral values fall in a stress, and the policy statement asks that "Potential collateral values also should be subject to stress tests since devaluations or market uncertainty could reduce the amount of contingent funding that can be obtained from pledging a given asset." A careful calculation haircuts the sources more as the scenario runs on.
What outflow assumptions go into a survival horizon?
The outflow assumptions are run-off rates for each kind of funding, the timing of that run-off within the horizon, maturities that will not be renewed, and draws on commitments the bank has made, net of inflows it can rely on. They are the part of the calculation examiners spend most time on: the Federal Reserve reported that its liquidity examinations in the second half of 2025 concentrated on the deposit assumptions in firms' internal stress tests (the six-week go-live plan quotes the report).
Building the example's 30-day outflow from its cohorts
| Funding cohort | Balance | 30-day stress assumption | Outflow by day 30 |
|---|---|---|---|
| Uninsured commercial deposits | $5.0B | 25% run off | $1.25B |
| Uninsured consumer deposits | $2.0B | 10% run off | $0.20B |
| Insured deposits | $11.0B | 3% run off | $0.33B |
| Brokered certificates maturing within 30 days | $0.4B | Not renewed | $0.40B |
| Undrawn commitments | — | Drawn in stress | $0.30B |
| Other wholesale funding | — | Not rolled | $0.27B |
| Contractual loan inflows | — | Counted at half | −$0.15B |
| Net outflow by day 30 | $2.60B |
The FDIC's manual gives the reasons to split cohorts finely. Uninsured accounts "whose average balances are considerably higher than the insurance limit may behave differently (i.e., are more prone to runoff) than those with average deposit balances only marginally above the insurance limit," and uninsured business money is likely to react faster than uninsured retail money to signs of distress (FDIC RMS Manual; deposit concentration risk quotes that second passage). One rate for all uninsured deposits averages a fast cohort with a slow one, and the fast one decides the horizon.
Timing matters as much as size. Silicon Valley Bank's internal stress test was questioned on exactly this point: supervisors found it "had insufficiently supported a key assumption that a material portion of deposit outflows in stress would not occur until days 31–90" (Federal Reserve, April 2023). Moving those outflows inside 30 days, the review notes, produced a worst case of an additional $27 billion of deposit outflows within 30 days. On a horizon chart, an assumption like that pushes the steep part of the curve past the point where the policy measures it.
What counts as available liquidity in a survival horizon?
Available liquidity is what the bank can turn into cash within the horizon without relying on goodwill: cash at the Federal Reserve and in correspondents, unencumbered high-quality securities valued after haircuts, and borrowing capacity secured by collateral already pledged and tested. The FDIC's examination manual describes a typical order of contingent sources, with cash and cash equivalents first, then operational discount window lines, unencumbered highly liquid securities and FHLB lines (FDIC RMS Manual); how the order is used in a funding plan is set out in liquidity stress test vs CFP.
Where the sample bank's $25.5 billion of counted liquidity comes from
Corvane National Bank, October 22, 2026
- Cash at the Fed and unencumbered Level 1 and 2A securities, $11.9B · 46.7%
- FHLB capacity after haircuts, $7.4B · 29%
- Discount window capacity, $6.2B (stale) · 24.3%
Three rules keep the count honest. Count collateral only if the lender will accept it: Signature Bank planned to borrow against capital call loans that the New York Reserve Bank would not take, and still counted them until hours before it failed (FDIC, April 2023); collateral eligibility belongs to the bank's contingency funding plan, and listed is not lendable explains the test. Count a source only if it has been tested and can be moved in time; SVB could not move securities quickly from its custodian or its FHLB to the discount window (the discount window readiness test quotes the review). And mark stale what is stale.
Borrowing lines need care with the rules. For the largest holding companies, Regulation YY says "A line of credit does not qualify as a cash flow source for purposes of a stress test with a planning horizon of 30 days or less," and requires asset values to be "discounted to reflect any credit risk and market volatility of the asset" (12 CFR 252.35). Secured FHLB capacity is treated differently in supervision: the Federal Reserve's 2026 operating principles tell examiners not to discourage firms from counting liquidity available from the Federal Home Loan Banks in managing liquidity or in their internal stress tests (Federal Reserve, operating principles).
Which inputs move the survival horizon most?
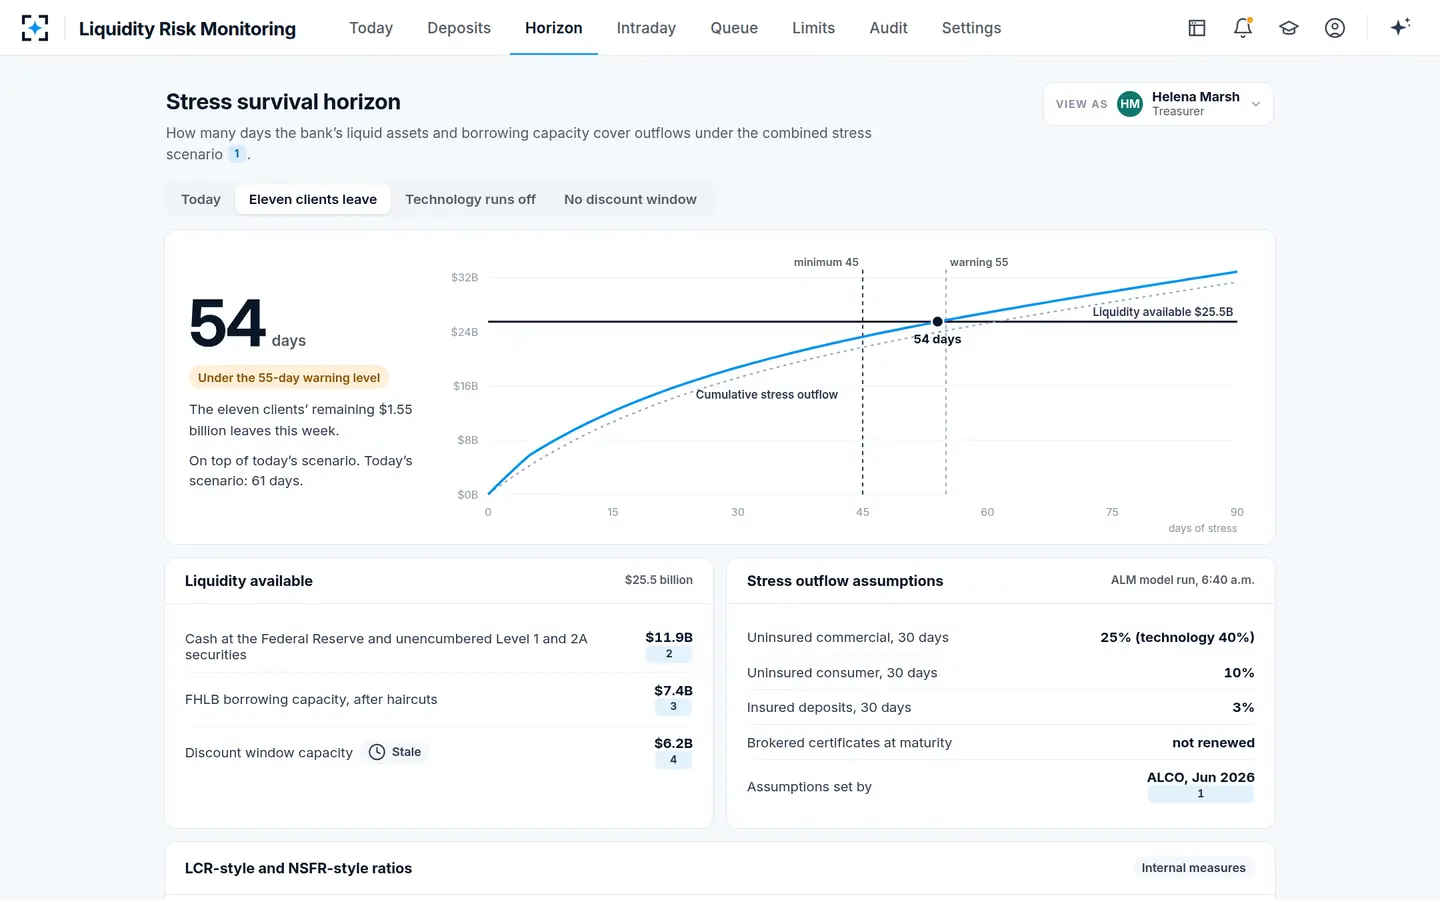
The inputs that move a horizon most are the run-off rate of the largest fast cohort, the timing of that run-off, and any single large source of counted liquidity that might not be there. On the sample bank's morning, the what-ifs show the scale. The horizon under the combined scenario was 61 days against a 45-day minimum and a 55-day warning level.
Liquidity Risk Monitoring's what-ifs: the sample bank's survival horizon under four cases
The order is the lesson. Losing one source of counted liquidity, the discount window, costs more days than a severe run by the bank's most mobile cohort, because $6.2 billion disappears on day one while run-off accrues over weeks. That is why the stale mark on a collateral file is not cosmetic, and why the 2023 addendum to the policy statement asks banks to plan for the practical work of moving and posting collateral in time to borrow when it matters (the pledged loans guide quotes the addendum).
The survival horizon in Liquidity Risk Monitoring, re-run on the clients who moved
What is the difference between survival horizon and LCR?
The LCR is a regulatory ratio of high-quality liquid assets to net outflows over 30 days on the rule's own run-off rates; a survival horizon is a number of days on the bank's own scenario and assumptions, over whatever horizon the bank chooses. A bank can pass one and fail the other. The LCR's mechanics belong to how to calculate the LCR; the comparison below is what each tells a treasurer.
Survival horizon and LCR answer different questions
Liquidity coverage ratio: Do high-quality liquid assets cover 30 days of net outflows at the rule's rates?
Survival horizon: How many days does counted liquidity last on our worst scenario?
Liquidity coverage ratio: Set by the regulation, the same for every covered firm
Survival horizon: Set by the bank, approved by ALCO, specific to its depositors
Liquidity coverage ratio: Fixed at 30 days
Survival horizon: Open: overnight to a year, reported as a number of days
Liquidity coverage ratio: Eligible high-quality liquid assets
Survival horizon: Cash, unencumbered securities and tested secured borrowing capacity, after haircuts
Liquidity coverage ratio: Larger banking organizations to which the rule applies
Survival horizon: Any bank, as an internal stress measure and limit
What is a good survival horizon for a bank?
There is no regulatory number for most banks; a good survival horizon is one long enough to carry the bank through its contingency funding plan's actions under its worst plausible scenario, with a margin. For bank holding companies of $100 billion or more, Regulation YY sets the nearest thing to a floor: a buffer of highly liquid assets "sufficient to meet the projected net stressed cash-flow need over the 30-day planning horizon" under each required scenario (12 CFR 252.35(b)). A horizon under 30 days at such a firm is a buffer shortfall.
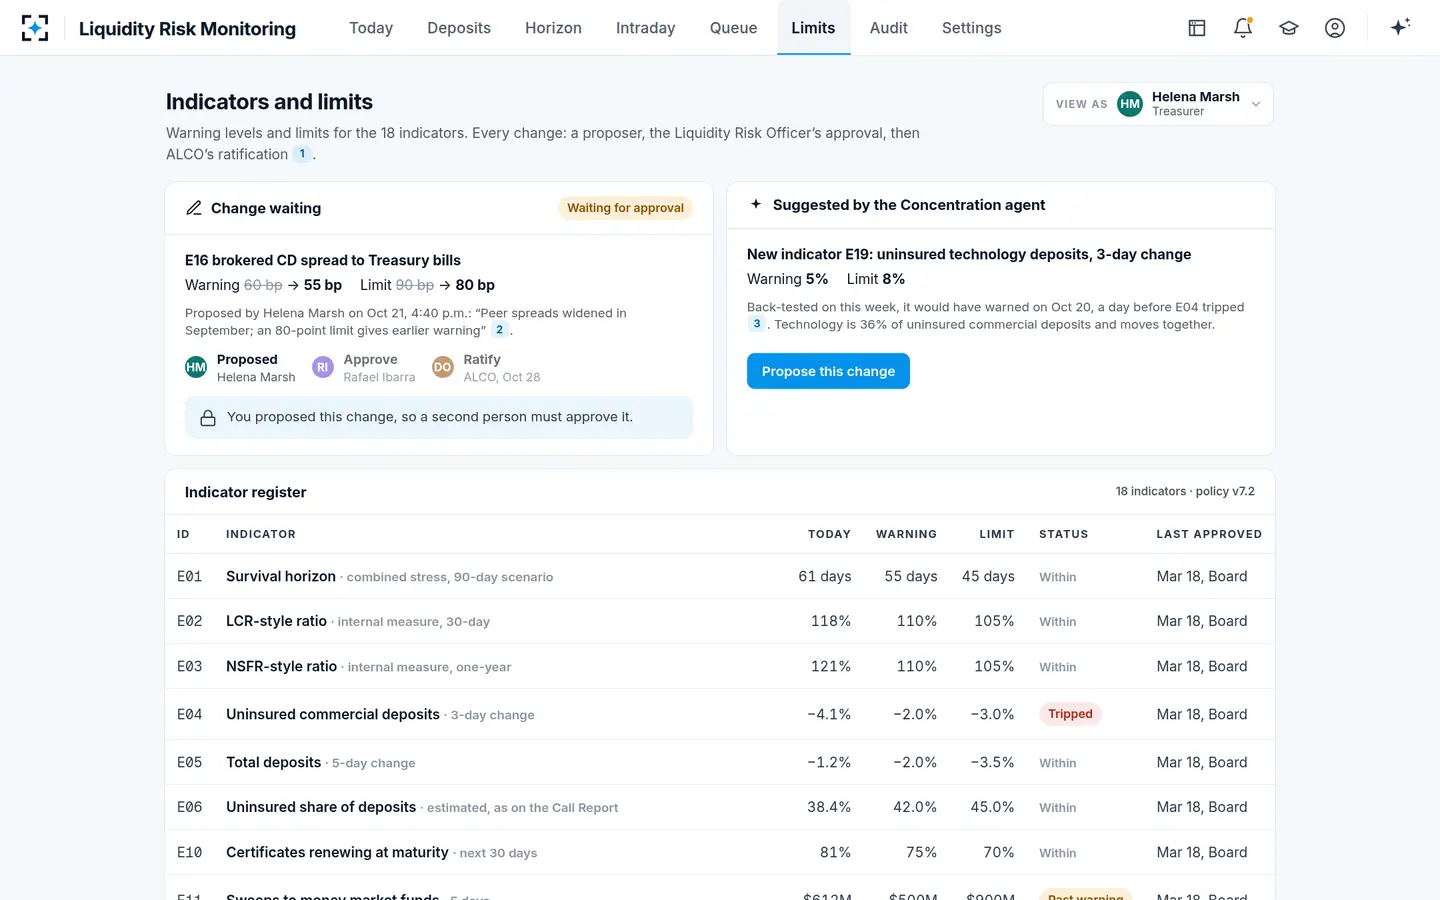
Most banks set a minimum and a warning level above it, and wire both to the contingency funding plan. The sample bank's policy sets a 45-day minimum and a 55-day warning level, and treats a horizon under 55 days as a stage 1 trigger. The right numbers depend on how long the plan's actions take: pledging more collateral, drawing tested lines, selling securities. A plan whose slowest step takes three weeks needs a horizon well beyond it.
The survival horizon as an indicator, with its warning level and limit approved by the board
How often should the survival horizon be recalculated?
A survival horizon should be recalculated at least monthly at most banks and daily wherever deposits are concentrated or uninsured, because the inputs that decide it change daily. Regulation YY requires its liquidity stress tests at least monthly, or at least quarterly for Category IV holding companies. The SVB review shows what the difference meant: absent the 2019 tailoring changes, "Rather than a quarterly ILST, SVBFG would have been subject to this requirement on a monthly basis."
Quarterly or even monthly is a governance cadence, not a monitoring one. SVB's outflow on a single day was larger than most banks' monthly change. In the sample bank, the horizon is recomputed every morning from the ALM model's overnight stress cash flows, and what-ifs are re-run on demand on the depositors who moved; it is an indicator on the morning note, with its own warning level and limit.
Liquidity stress testing for banks: how do you stress a survival horizon?
You stress a survival horizon by running it under several scenarios and taking the shortest, and by testing what happens when the assumptions themselves are wrong. Regulation YY's minimum set is a good template for any bank: "A scenario reflecting adverse market conditions," "A scenario reflecting an idiosyncratic stress event," and "A scenario reflecting combined market and idiosyncratic stresses," across "an overnight planning horizon, a 30-day planning horizon, a 90-day planning horizon, a one-year planning horizon."
Five ways to stress a liquidity survival horizon, and what each tests
| Stress | How | What it tests |
|---|---|---|
| Scenario | Market, idiosyncratic and combined, each with its own run-off rates | Whether the bank survives its worst plausible event, not its average one |
| Cohort | Run the largest fast cohort off much faster, as the sample bank's technology case does at 60% in 10 days | Concentration: whether one sector or network can end the horizon |
| Timing | Move later outflows inside 30 days | The day 31–90 assumption that SVB's supervisors questioned |
| Source | Remove the largest single source of counted liquidity | Dependence on one lender or one collateral pool, as the no-discount-window case does |
| Assumption change | Show the horizon with the previous and current assumptions side by side | Whether an improvement came from the balance sheet or from the model |
The last row is the one 2023 added. When SVB's stress test was failing, management eased assumptions in October 2022 in ways that reduced the modelled shortfall, and the review's conclusion was that "Changing model assumptions, rather than improving the actual liquidity position, is not an appropriate way to restore compliance with limits." A horizon report should say on its face when it improved because an assumption moved. How the indicators around the horizon would have fired in 2023 is replayed in early warning indicators for liquidity risk, and the depositors behind a what-if are found in naming who moved the money. The daily horizon is part of Liquidity Risk Monitoring.
Questions people ask
What is the formula for a survival horizon?
The survival horizon is the last day t on which counted liquidity L still covers cumulative net stressed outflow O(t): L − O(t) ≥ 0. Counted liquidity is cash plus unencumbered securities and tested secured borrowing capacity, each after haircuts; outflows are projected by cohort under a named scenario, net of inflows the bank can rely on.
Is a survival horizon measured in days or months?
Usually in days, because the decisions it informs, such as pledging collateral or drawing a line, take days. Policies typically set a minimum and a warning level in days; the sample bank uses 45 and 55. Regulation YY's planning horizons for large holding companies run from overnight to one year.
Do community banks need a liquidity survival horizon?
No rule requires one, but the policy statement expects every bank to stress test across multiple horizons in proportion to its complexity, and a horizon in days is the simplest way to express the result to a board. It earns its place at banks with concentrated or uninsured deposits.
Can FHLB borrowing capacity count toward the survival horizon?
Yes, if it is secured by collateral already pledged and the line has been tested; count it after the FHLB's haircuts. The Federal Reserve's 2026 operating principles tell examiners not to discourage firms from counting FHLB liquidity in their internal stress tests, though Regulation YY does not let an unsecured line of credit count within 30 days at the largest holding companies.
What is the difference between a survival horizon and an internal liquidity stress test?
The survival horizon is one output of an internal liquidity stress test: the day on which projected cumulative outflows exhaust counted liquidity. The stress test also produces the buffer needed at each horizon, the gaps by time bucket and the results by legal entity, and its assumptions are what examiners review.