A liquidity risk example everyone in banking now knows is Silicon Valley Bank: on March 9, 2023 its depositors withdrew more than $40 billion, management expected more than $100 billion to follow the next day, and on the morning of March 10 the bank was closed. Signature Bank was closed 53 hours later. Liquidity risk is the risk that a bank cannot meet its cash and collateral obligations when they fall due, or is believed unable to; in both cases the bank's own data showed the exposure, a deposit base at least 90% uninsured and concentrated in a few industries, for many months before the run that ended it. Botminds' Liquidity Risk Monitoring is an agentic solution built around that gap: every morning its agents recompute a bank's early warning indicators, name the depositors behind each move and put one decision in front of the treasurer. This guide uses the two regulators' reviews to show what the missed signals were, how fast the money left, and what the error cost.
All bank facts come from the Federal Reserve's and the FDIC's reviews of April 28, 2023 and from FDIC data, linked where they appear. Where the guide shows the solution, the examples come from its fictional sample bank, Corvane National Bank.
The 2023 liquidity risk example in four numbers
$40B+
of deposits that left Silicon Valley Bank on March 9, 2023, in one day
53hours
from SVB's failure to Signature Bank's closure on March 12, 2023
4%
of total deposits: Signature Bank's best-case available liquidity that Sunday, against $7.9 billion of wires queued for Monday
$16.7B
the FDIC's current estimate of the two failures' cost to be recovered through its special assessment
What is an example of liquidity risk?
An example of liquidity risk is a bank whose depositors ask for more cash in a day than it can raise in a day, even though its assets might cover them over a month. The Federal Reserve's own definition, quoted in its SVB review, puts the perception on the same footing as the fact: "Liquidity risk is the risk that an institution's financial condition or overall safety and soundness is adversely affected by an inability (or perceived inability) to meet its obligations" (Federal Reserve, April 2023).
Smaller, everyday examples of liquidity risk sit in the OCC's examiner booklet: public funds withdrawn, federal funds or FHLB lines frozen, certificates of deposit redeemed early, committed credit lines cancelled by counterparties (OCC, Liquidity booklet). Each is a way that cash a bank counted on stops being available. The 2023 cases show the extreme form, in which several arrive at once and in hours.
Months of signals, two days of run
The defining feature of both failures is the ratio between how long the warning was visible and how long the run took. Drawn to scale, the warning occupies almost the whole line and the run is a sliver at its end.
Two 2023 failures, to scale: the signals ran for months, the runs for days
- Contingent funding gaps knownNov 2021–Jun 2022
- Stress test failingJul–Sep 2022
- Assumptions eased; outflows continueOct 2022–Mar 7, 2023
- RunMar 8–10
- $17.6 billion of deposits leave2022
- Pledged securities misstatedJan–Mar 9, 2023
- RunMar 10–12
Neither bank lacked information. SVB's review records that "The combination of ILST shortfalls, persistent and increasingly significant deposit outflows, and material balance sheet restructuring plans likely warranted a stronger supervisory message in 2022." Signature's records that the FDIC had identified "SBNY's large percentage of uninsured deposits as a potentially volatile funding concentration within every roll-up ROE since at least 2017" (FDIC). The signals were known, documented and reported. What was missing was a daily view that tied them to a decision someone had to make and write down.
What caused the SVB bank run?
The SVB run was caused by a balance-sheet announcement landing on a concentrated, networked and almost entirely uninsured deposit base. On March 8, 2023 the bank's holding company said it had sold $21 billion of available-for-sale securities, would book a $1.8 billion after-tax loss and sought to raise $2.25 billion of capital. The review describes what followed as "highly correlated withdrawals from SVBFG's concentrated network of VC investors and technology firms who, fueled by social media, withdrew uninsured deposits in a coordinated manner at an unprecedented rate" (Federal Reserve).
The vulnerability had built for years. Between 2019 and 2021 the firm tripled in size on deposits that "were largely uninsured," invested mostly in longer-term securities. When rates rose in 2022, the value of those securities fell and venture-backed clients began spending their cash. By year-end 2022 about 94% of deposits were uninsured, and "VC-backed companies accounted for more than half of SVBFG's deposits." A depositor base that shares investors, news sources and messaging channels behaves as one depositor on the bad day.
How fast did deposits leave SVB?
Deposits left SVB at more than $40 billion in a single day, about thirty times the daily pace of the large failures of 2008. The review sets the comparison itself: "estimates suggest that the failure of Wachovia in 2008 included about $10 billion in outflows over 8 days, while the failure of Washington Mutual in 2008 included $19 billion over 16 days." The day's outflow and the outflow expected for March 10 together "represented roughly 85 percent of the bank's deposit base."
Average outflow per day: SVB against the two largest failures of 2008
That speed changes what a monitoring cadence is for. A weekly report would have described SVB's run after the bank was closed. The Federal Reserve drew the general conclusion that "the combination of social media, a highly networked and concentrated depositor base, and technology may have fundamentally changed the speed of bank runs." For a liquidity team the practical consequence is that the useful warning is the one before the run starts, from the composition of the deposit base and its slow outflows, because once it starts the decisions are measured in hours.
Why did Signature Bank fail?
Signature Bank failed because a run triggered by SVB's failure met a bank that could not see its own liquidity in time to borrow against it. The FDIC's conclusion was blunt: "SBNY management's lack of a well-documented and thoroughly tested liquidity contingency plan and its lack of preparedness for an unanticipated liquidity event were the root cause of the bank's failure" (FDIC, April 2023).
The last Friday is a lesson in operations. Withdrawal requests on March 10 "equaled 20 percent of total deposits." Outgoing wire requests exceeded the funds in the bank's Federal Reserve account, and management struggled to work out how much it had to borrow, reached the Federal Home Loan Bank of New York too late in the day to draw on its line, and had too little collateral at the discount window to cover the waiting wires (the stress day, hour by hour quotes the FDIC's account). By Sunday afternoon, maximum outgoing wires for Monday had reached $7.9 billion, and on a best-case view the FDIC found $3 billion of liquidity available, 4% of total deposits. The bank was closed that evening.
Collateral was part of the problem. Signature had planned to pledge capital call loans at the discount window, but the New York Reserve Bank found many of them ineligible, and management kept counting them in its collateral figures until hours before the bank failed, the FDIC records. How a bank tests that its collateral can really be borrowed against belongs to its contingency funding plan, and discount window collateral eligibility examines the case in full; the monitoring lesson is that a capacity number with no eligibility check behind it is not a number.
SVB and Signature Bank, signal by signal
Silicon Valley Bank: About 94% of total deposits at year-end 2022.
Signature Bank: 90% of total deposits at year-end 2022; 82% to 92% in each year since 2017.
Silicon Valley Bank: VC-backed companies: more than half of deposits.
Signature Bank: About 60 clients above $250 million each held about 40% of deposits; four depositors held 14% of total assets.
Silicon Valley Bank: Client deposits falling from the second quarter of 2022.
Signature Bank: $17.6 billion in 2022, mostly in the fourth quarter; 62% digital-asset related.
Silicon Valley Bank: Internal stress test failing from July 2022; assumptions eased in October.
Signature Bank: Deposit assumptions and a run-off framework never fully developed.
Silicon Valley Bank: Discount window untested in 2022; could not move securities collateral quickly.
Signature Bank: Ineligible loans still counted as collateral; FHLB approached too late in the day.
Silicon Valley Bank: Over $40 billion out on March 9; over $100 billion more expected.
Signature Bank: Withdrawal requests of 20% of deposits on March 10; $7.9 billion of wires queued for Monday.
What is uninsured deposit risk?
Uninsured deposit risk is the chance that depositors whose balances exceed the $250,000 insurance limit withdraw quickly at the first doubt about the bank, because they, unlike insured depositors, stand to lose money if it fails. The FDIC's examination manual puts it carefully: uninsured deposits are not volatile by definition, but they are more likely to leave under stress or when the bank's condition weakens (FDIC RMS Manual, Section 6.1; the passage is quoted in the uninsured deposits ratio).
The manual also says which uninsured money moves first: accounts whose average balances sit far above the insurance limit are more prone to run off than those just above it, a point the survival horizon calculation builds into its cohorts. Both 2023 banks were at the extreme of that sentence, with large operating balances held by companies, not households. The share of uninsured deposits across the industry, how it is estimated and why the published figure is months old are covered in the uninsured deposits ratio.
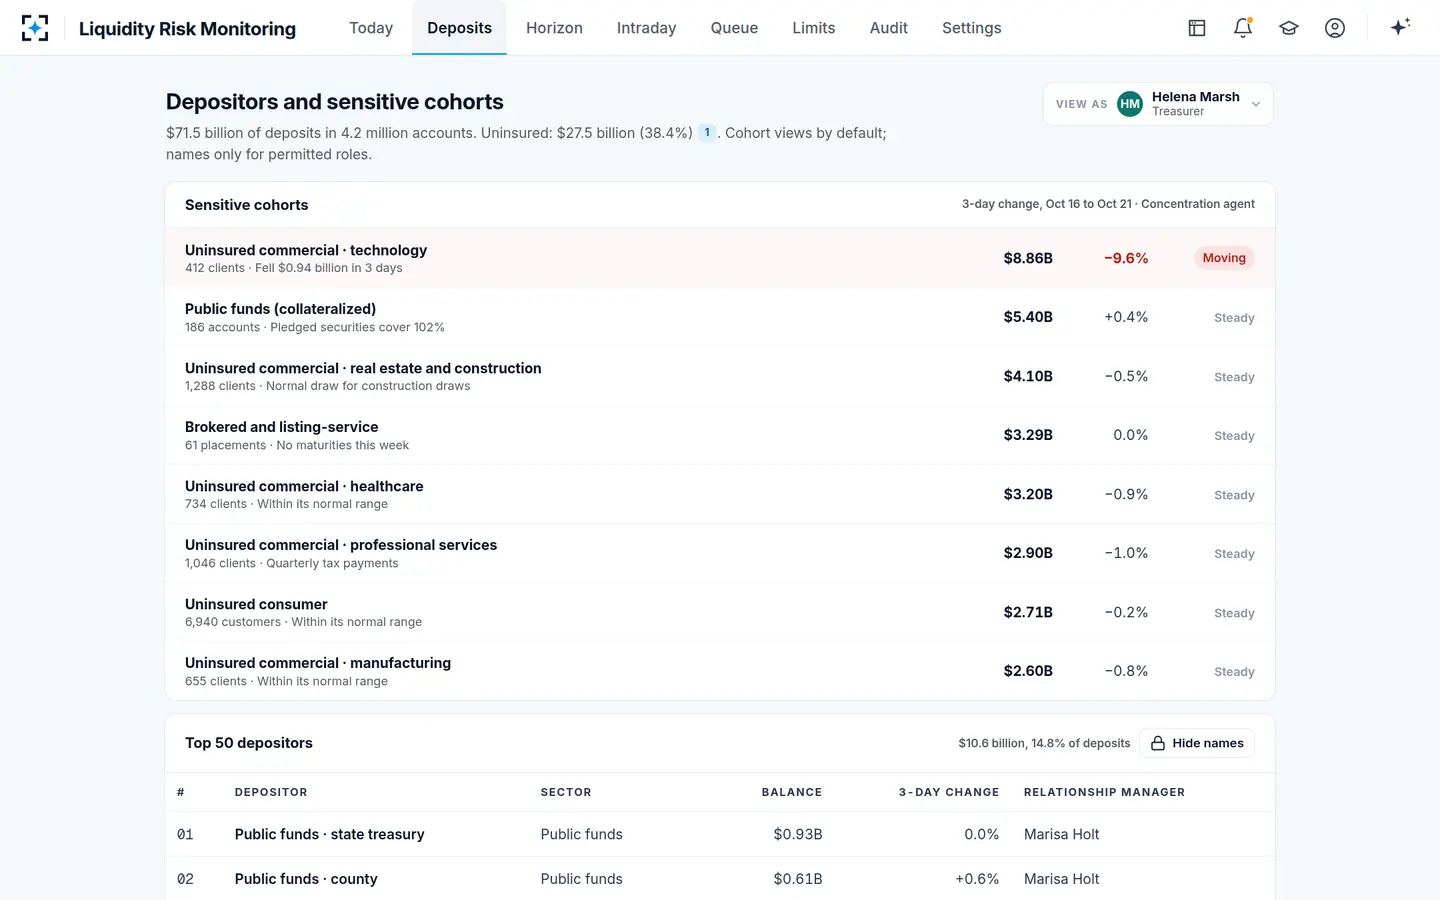
Watching uninsured deposit risk therefore means watching cohorts, not a single ratio: which sectors and networks hold the uninsured balances, and which of them are moving. In the sample bank, uninsured deposits are $27.5 billion, 38.4% of the total, and the cohort view shows the one that is leaving.
Liquidity Risk Monitoring's view of uninsured deposits, cohort by cohort
How much did the 2023 bank failures cost the Deposit Insurance Fund?
The FDIC currently estimates that the cost of the failures of Silicon Valley Bank and Signature Bank to be recovered through its special assessment is about $16.7 billion, and it adjusts the figure as it sells the banks' assets (FDIC, special assessment). The cost was recovered from the banks with the most uninsured deposits: the special assessment was charged on each organization's estimated uninsured deposits at December 31, 2022, above the first $5 billion, and 141 insured institutions in 110 banking organizations paid it.
The wider cost was to confidence across the system. Researchers at the National Bureau of Economic Research estimated that rate rises from the first quarter of 2022 to the first quarter of 2023 cut the marked-to-market value of US bank assets by "an average decline of 10%, totaling about $2 trillion in aggregate," and found that "Banks with high asset losses, low capital, and, critically, high uninsured leverage are most fragile" (Jiang, Matvos, Piskorski and Seru, NBER w31048). The losses were not a liquidity problem until uninsured depositors decided they might become one.
What is the difference between liquidity risk and interest rate risk?
Interest rate risk is the risk that rate changes reduce a bank's earnings or the value of its assets and liabilities; liquidity risk is the risk that it cannot pay what is due when it is due. At SVB the first became the second. Rising rates cut the value of long-dated securities, the losses raised doubts about solvency, and the doubts set off the run. The review says the firm had been in and out of breach of its long-term interest rate risk limits since 2017, and in April 2022 changed its deposit duration assumptions to cure a breach instead of reducing the risk (ALCO meeting minutes quotes the review on that change).
The two are measured by different teams, which is part of the danger. Rate risk lives in the ALM model and the asset/liability committee's quarterly view; liquidity risk in treasury's daily one. The bank's interest rate risk function owns the first, and SVB's SR 10-1 gap assessment shows how it failed there; the liquidity desk needs to see when the first is about to become the second, which in 2023 meant watching uninsured depositors' behaviour as unrealized losses grew.
Could better monitoring have saved SVB?
Probably not on its own, and the Federal Reserve says so: "While stronger operational capacity to obtain contingency funding in March 2023 would likely not have prevented SVB's failure, it could have facilitated a more orderly resolution" (Federal Reserve). Monitoring does not change a balance sheet. What it changes is when the people who can change the balance sheet see the problem clearly enough to act, and whether the bank can borrow quickly when it must.
The useful question for any bank is narrower: would its own morning view have shown the signals in time to decide, and would the decision have been written down? The checklist below is what the two reviews suggest a daily view must have put in front of the treasurer.
What a daily, explained view would have put in front of each treasurer in 2022
- The uninsured share and its trend, daily
Not the quarter-end estimate, but today's figure from the core, with the cohorts that hold it.
- Outflows by cohort, with names for permitted roles
Which sector or network was leaving, and how much of it remained, as SVB's venture-backed clients spent their cash through 2022.
- Stress results with every assumption change shown
A survival horizon that improves because an assumption was eased should say so on its face.
- Contingent capacity with eligibility and staleness
Discount window and FHLB capacity counted only on collateral the lender will take, marked stale when the file is late.
- Limit changes with who proposed and who approved
A limit raised after a breach, as at Signature in 2021, should be visible to the second line and the board as a change, not a new normal.
- A recorded decision every time an indicator trips
Watch, escalate or act, with the reason. A decision not to act is still a decision.
In the sample bank, that is what the morning holds: the cohort that moved, the clients behind it, and a survival horizon with its what-ifs, so the treasurer decides on numbers. The screen below is the horizon on the morning uninsured commercial deposits tripped.
Liquidity Risk Monitoring: the survival horizon if the clients who moved take the rest
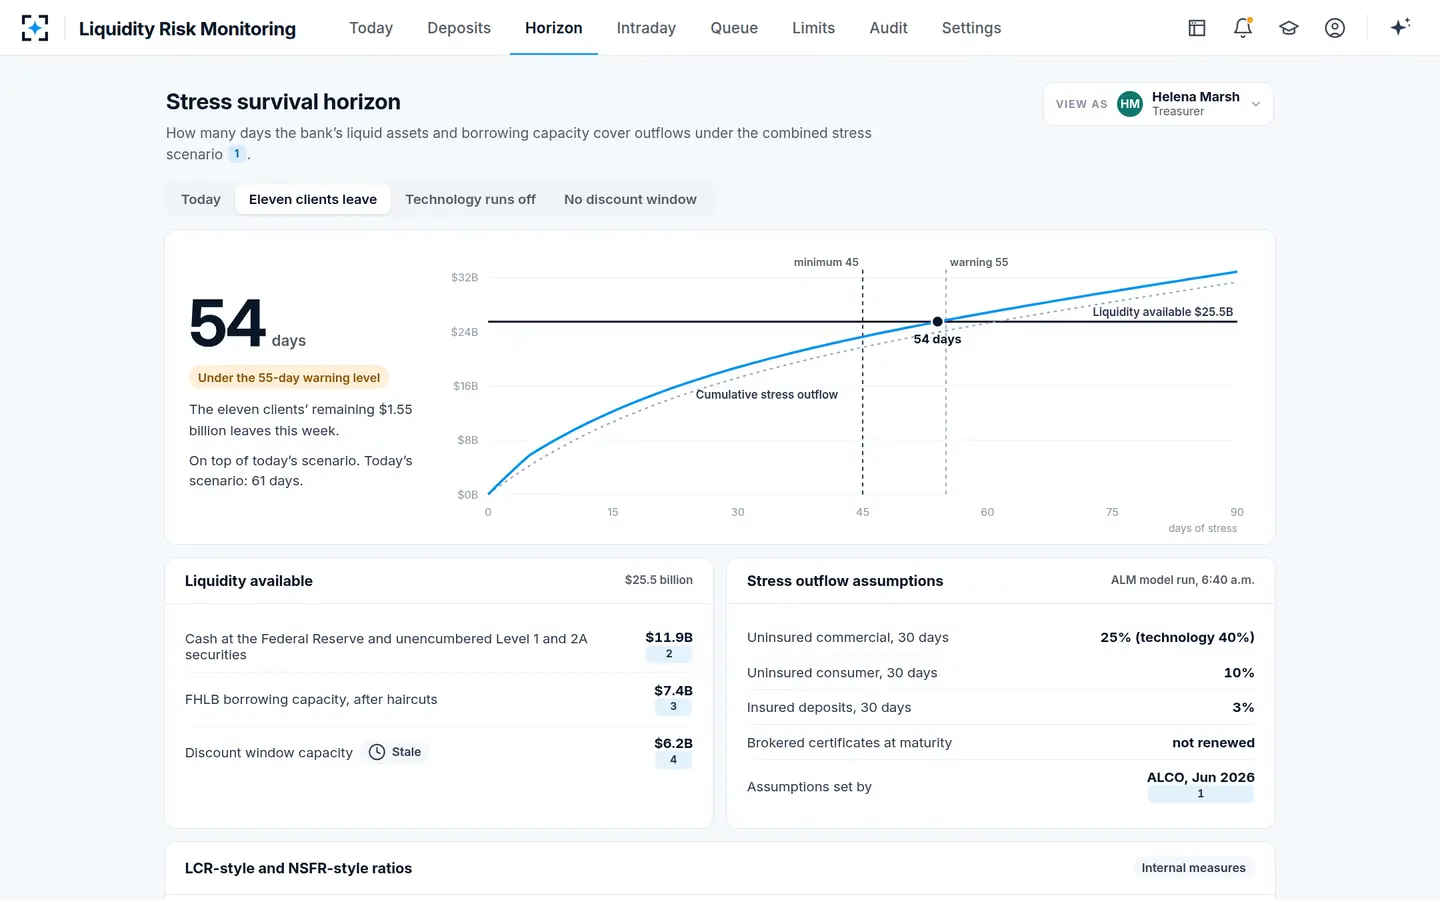
How the horizon is calculated, and which inputs moved SVB's, is worked through in how to calculate a survival horizon; which indicators would have fired first is replayed in early warning indicators for liquidity risk. The whole morning is on the Liquidity Risk Monitoring page.
Questions people ask
What is a bank run?
A bank run is a rush of depositors withdrawing at once because they fear the bank will fail, which can make it fail by draining its cash faster than it can sell or pledge assets. The 2023 runs were faster than any before: SVB lost more than $40 billion in one day, against about $10 billion over eight days at Wachovia in 2008.
Was SVB subject to the liquidity coverage ratio?
Not when it failed. SVB's holding company crossed $100 billion of assets in June 2021 and became a Category IV firm, and Category IV firms were not subject to the LCR unless they had $50 billion or more of weighted short-term wholesale funding, a threshold SVB crossed only in December 2022, with compliance due later. It did become subject to internal liquidity stress testing in July 2022. How the ratio works, and how SVB would have looked under it, is covered in what LCR means in banking.
How did Signature Bank misstate its liquidity?
Examiners found that Signature under-reported pledged securities on its liquidity monitoring reports, which overstated the liquidity it had on its balance sheet, and that the problem persisted until the day it failed. It had also refiled its year-end 2022 Call Report with a multi-billion upward adjustment to pledged securities after examiners questioned it in February 2023.
What is liquidity risk in banks, in simple terms?
It is the risk that a bank runs out of cash before it runs out of value: its depositors and lenders want money back faster than it can turn its loans and securities into cash. Banks manage it by holding liquid assets, keeping borrowing lines ready and tested, and watching how quickly their own funding could leave.
How can a bank reduce its liquidity risk?
By diversifying funding so no single sector or network can leave at once, holding enough unencumbered liquid assets for a realistic stress, keeping discount window and FHLB collateral pledged and tested, and monitoring its own deposit base daily against limits it does not move when they are breached. The 2023 reviews add one more: write down every decision on a tripped indicator, including the decision to wait.