The uninsured deposits ratio is a bank's estimated uninsured deposits, the balances above the $250,000 deposit insurance limit, as a share of its total deposits. It is the single number most often used to say how much of a bank's funding could run: at US banks it was 44.4% at June 30, 2026, against about 94% at Silicon Valley Bank and 90% at Signature Bank when they failed. The difficulty is its age. The figure is estimated at each quarter-end, filed in the Call Report up to 30 days later, and published for the industry about eight weeks after the quarter, so the ratio most people quote on any given day describes balances three or four months old, in a world where uninsured depositors can leave in hours. Botminds' Liquidity Risk Monitoring is an agentic solution that recomputes a bank's uninsured share every morning from the core banking system, as an early warning indicator with its own warning level and limit, and shows which cohorts hold the uninsured money and which are moving.
Industry figures come from the FDIC's Quarterly Banking Profile and reports, linked where they appear. Product examples come from the solution's fictional sample bank, Corvane National Bank.
Uninsured deposits ratio: two failed banks, the industry, and a bank measured daily
Silicon Valley Bank, year-end 2022
- Uninsured · 94%
- Insured · 6%
Signature Bank, year-end 2022
- Uninsured · 90%
- Insured · 10%
All FDIC-insured institutions, June 30, 2026
- Uninsured · 44.38%
- Insured · 55.62%
Sample bank, October 21, 2026, computed daily
- Uninsured · 38.4%
- Insured · 61.6%
What is the uninsured deposits ratio?
The uninsured deposits ratio is estimated uninsured deposits divided by total deposits, usually expressed as a percentage. "Uninsured" means the part of each depositor's balance above the standard maximum deposit insurance amount, $250,000 per depositor per ownership category. A business with $5 million in an operating account contributes $4.75 million to the numerator.
Two denominators are in use, and the choice changes the number. Most bank and FDIC figures divide by deposits; the FDIC's Quarterly Banking Profile uses "total deposit liabilities after exclusions," the base for deposit insurance (FDIC QBP). Some analysis divides by total assets instead: the FDIC's Signature review reported uninsured deposits as 63% to 82% of total assets over its review period, and as 82% to 92% of total deposits (FDIC, April 2023). A ratio quoted without its denominator cannot be compared.
How are uninsured deposits estimated?
Banks with $1 billion or more in total assets estimate their own uninsured deposits for the Call Report, in Schedule RC-O, Memorandum item 2; for smaller banks the FDIC calculates an estimate from the number and size of large accounts. The FDIC's notes to the Quarterly Banking Profile explain the smaller-bank method with an example: "if an institution reports 1,000 deposit and retirement accounts with balances greater than $250,000 and an aggregate total of $500 million, the FDIC would calculate the estimated uninsured deposits as $250 million ($500,000,000 – (1,000 * $250,000))" (FDIC QBP, notes).
That shortcut treats each account as one depositor, which can overstate or understate the true figure depending on how many accounts each depositor holds and in which ownership categories. Larger banks' own estimates are more precise but have their own traps: how to treat deposits secured by pledged collateral, and deposits of consolidated subsidiaries, both of which the FDIC addressed in 2023. The line-by-line rules for the Call Report figure are worked through in call report uninsured deposits; this guide is about the figure's age and how to watch it between reports.
How often is uninsured deposit data reported?
Uninsured deposit data is reported quarterly, as of each quarter-end, and becomes public in two steps. Each bank's Call Report must reach the federal regulators' Central Data Repository within 30 calendar days of the report date, or 35 days for banks with more than one foreign office (FFIEC Call Report General Instructions). The FDIC then publishes the industry totals in its Quarterly Banking Profile: for June 30, 2026, on August 25, 2026, 56 days after the quarter ended (FDIC, August 25, 2026).
The age of the industry's uninsured deposits ratio on October 27, 2026
- Quarter-end to Call Report due30 days
- To the FDIC's publicationAug 25
- Newest public figure while it ages63 more days
- Quarter-end to filing≤30 days
- Used until the next quarter's filingabout 3 months
- Yesterday's close1 day
For monitoring, the gap matters more than the precision. A board that reads the uninsured share in a quarterly report is reading a quarter-end estimate; a treasurer who tracks it only at quarter-ends will see a run in the next quarter's number, after it has happened. The 2010 policy statement already lists funding concentrations among what liquidity reports carry, and expects senior managers to see those reports at least monthly and more often under stress; the uninsured share is one such concentration.
What share of deposits are uninsured at US banks?
At June 30, 2026, estimated uninsured deposits at FDIC-insured institutions were $8.69 trillion, 44.38% of total deposit liabilities after exclusions, the highest share in the three years of data below. The FDIC's statement for the quarter put the trend plainly: "Estimated uninsured domestic deposits accounted for all of the increase in domestic deposits from the prior quarter, as insured deposits decreased slightly" (FDIC, August 25, 2026).
Uninsured deposits as a share of the insurance base, every quarter since mid-2023
The 2023 dip has reversed. In 2025, the FDIC's annual Risk Review found, "Industry deposits increased 3.9 percent, underpinned by growth of 7 percent in uninsured deposits," and at community banks "The increase in community banks' uninsured deposits represents a rebound after the sharp contraction in 2023" (FDIC, 2026 Risk Review). In the second quarter of 2026 alone, uninsured domestic deposits rose $317.4 billion, or 3.8%.
Uninsured deposits in 2026: the money that can move fastest is growing fastest
$8.69T
estimated uninsured deposits, June 30, 2026
+10.9%
growth over the four quarters to June 30, 2026
+3.8%
growth in the second quarter of 2026 alone: $317.4 billion
7%
growth in uninsured deposits across 2025, against 3.9% for all deposits
What uninsured deposit ratio is too high?
There is no regulatory ceiling on the uninsured deposits ratio; a ratio is too high when the bank cannot survive its plausible run-off with the liquidity it can count on. The FDIC's examiners are told that "Uninsured deposits are not automatically considered volatile; however, in times of stress or when an institution's condition deteriorates, uninsured depositors are more likely to withdraw their funds," and to "closely review large volumes of uninsured deposits, along with their risk characteristics, including concentrations of large individual depositors" (FDIC RMS Manual, Section 6.1).
The composition matters as much as the level. The same manual notes that accounts with balances far above the insurance limit are more prone to run-off than those just above it, and that non-retail uninsured deposits react faster than retail. A 40% ratio made of thousands of households slightly over the limit is a different risk from a 40% ratio made of a few hundred technology companies. That is why the useful limit is the bank's survival horizon under a run of its riskiest uninsured cohort, and the ratio is the early warning beside it.
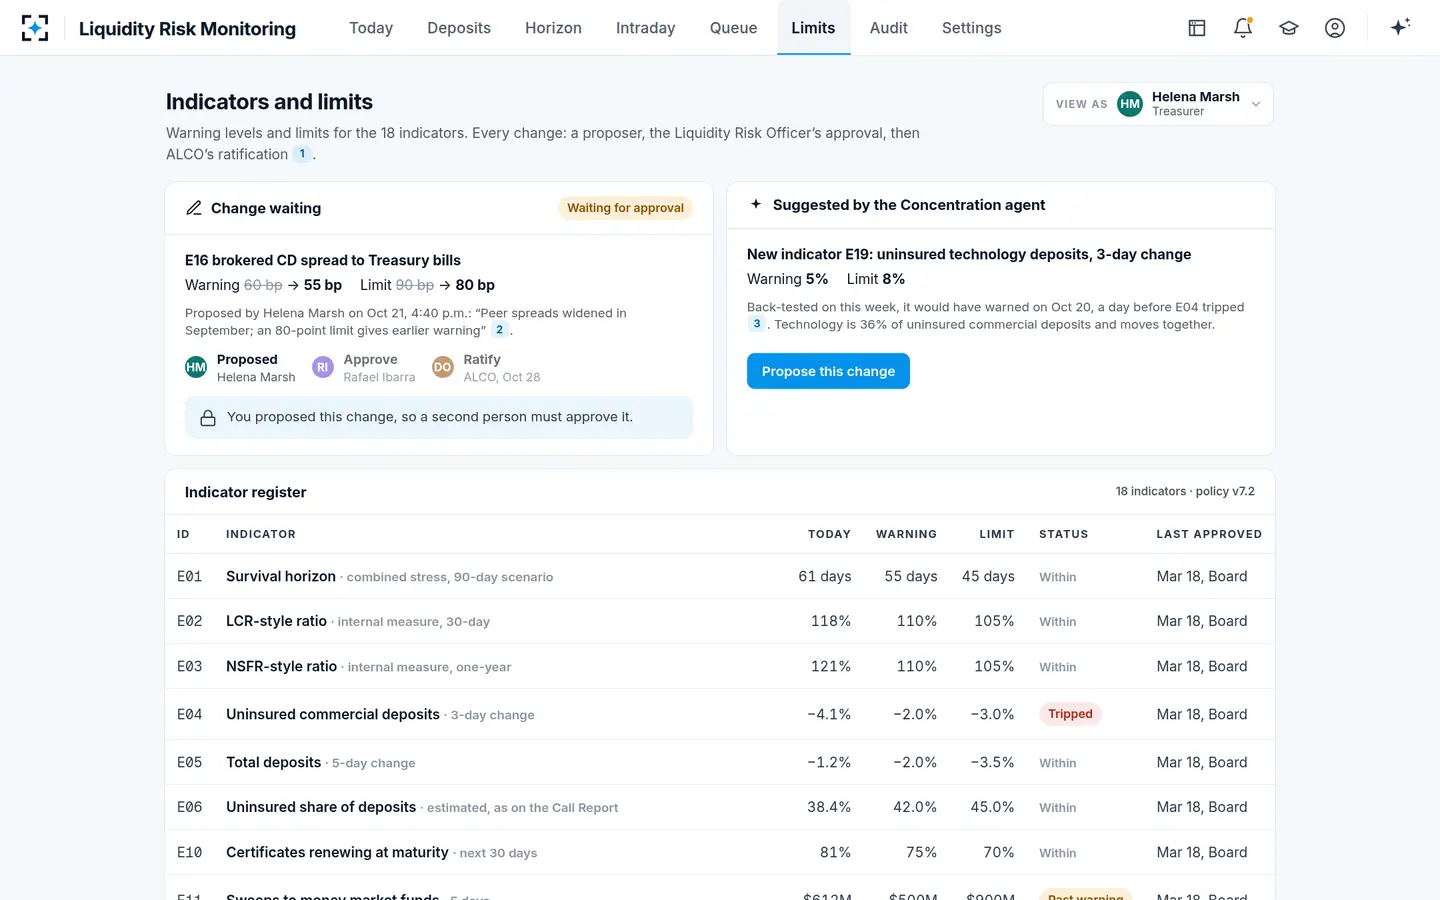
Banks that set a limit on the ratio itself should treat it like any other. Signature Bank did not: "Establishing a limit on the allowable level of uninsured deposits was not considered a viable solution, as management's strategy was based on the generation of large commercial deposits" (FDIC). The sample bank's uninsured share indicator has a warning level of 42% and a limit of 45%, approved by its board, and stood at 38.4% on October 21.
What was SVB's uninsured deposit ratio?
About 94% of SVB's total deposits were uninsured at year-end 2022, according to the Federal Reserve's review, which adds that "SVBFG's uninsured deposits as a percentage of total deposits were more than double the LBO average," the average of large banking organizations (Federal Reserve, April 2023). Signature Bank's was 90% at the same date, and had been 82% or more in every year since 2017.
Neither ratio was a secret; both appeared in quarterly Call Reports for years. What the quarterly number could not show was what happened inside it in 2022: at SVB, venture-backed clients drawing down their balances to fund operations; at Signature, $17.6 billion of outflows, 62% of them related to digital assets. A ratio near 90% that stays near 90% while the balance behind it falls is a run in slow motion that the ratio alone never flags.
Why a quarter-end ratio can miss a run
A quarter-end ratio misses a run for two reasons: it is a level, not a flow, and it moves the wrong way. When uninsured depositors leave, the uninsured share falls, because the numerator shrinks faster than the denominator. A bank that watches only the ratio sees it improve during the worst week of its year.
The sample bank's morning shows it. On October 21 the uninsured share was 38.4%, "down 0.9 points as uninsured balances left": comfortably within its 42% warning level. On the same morning uninsured commercial deposits had fallen $1.06 billion in three days and tripped their limit. The share indicator was right and reassuring; the flow indicator beside it was the one that mattered. A daily ratio is worth computing, but only next to the daily movement of the money it measures.
Liquidity Risk Monitoring computes the uninsured share daily, next to the flow that moves it
How do you monitor uninsured deposits daily?
You monitor uninsured deposits daily by applying the insurance limit to each depositor's balances from the core every morning, summing the excess, and tracking both the total and its flow by cohort. The method below is what the sample bank's indicator does, set out so any bank can test its own.
Computing the uninsured deposits ratio every morning, and keeping it honest
- Start from depositors, not accounts
Aggregate each depositor's balances by ownership category before applying the $250,000 limit; an account-level shortcut can miss depositors who split money across accounts.
- Use the Call Report's rules
Apply the same treatment as the bank's Schedule RC-O estimate, including deposits secured by pledged collateral and subsidiaries' deposits, so the daily figure reconciles to the quarterly one.
- Reconcile at each quarter-end
The daily figure for the quarter's last day should match the filed estimate, or the difference should have a written cause.
- Split it by cohort
Uninsured commercial by sector, uninsured consumer, public funds, and the largest depositors, each with its own flow.
- Watch the flow beside the level
A three-day or five-day change in uninsured balances by cohort trips before the ratio moves, and in a run the ratio falls.
- Mark stale inputs
If the core extract or the general ledger tie-out is late, the ratio is yesterday's and should say so.
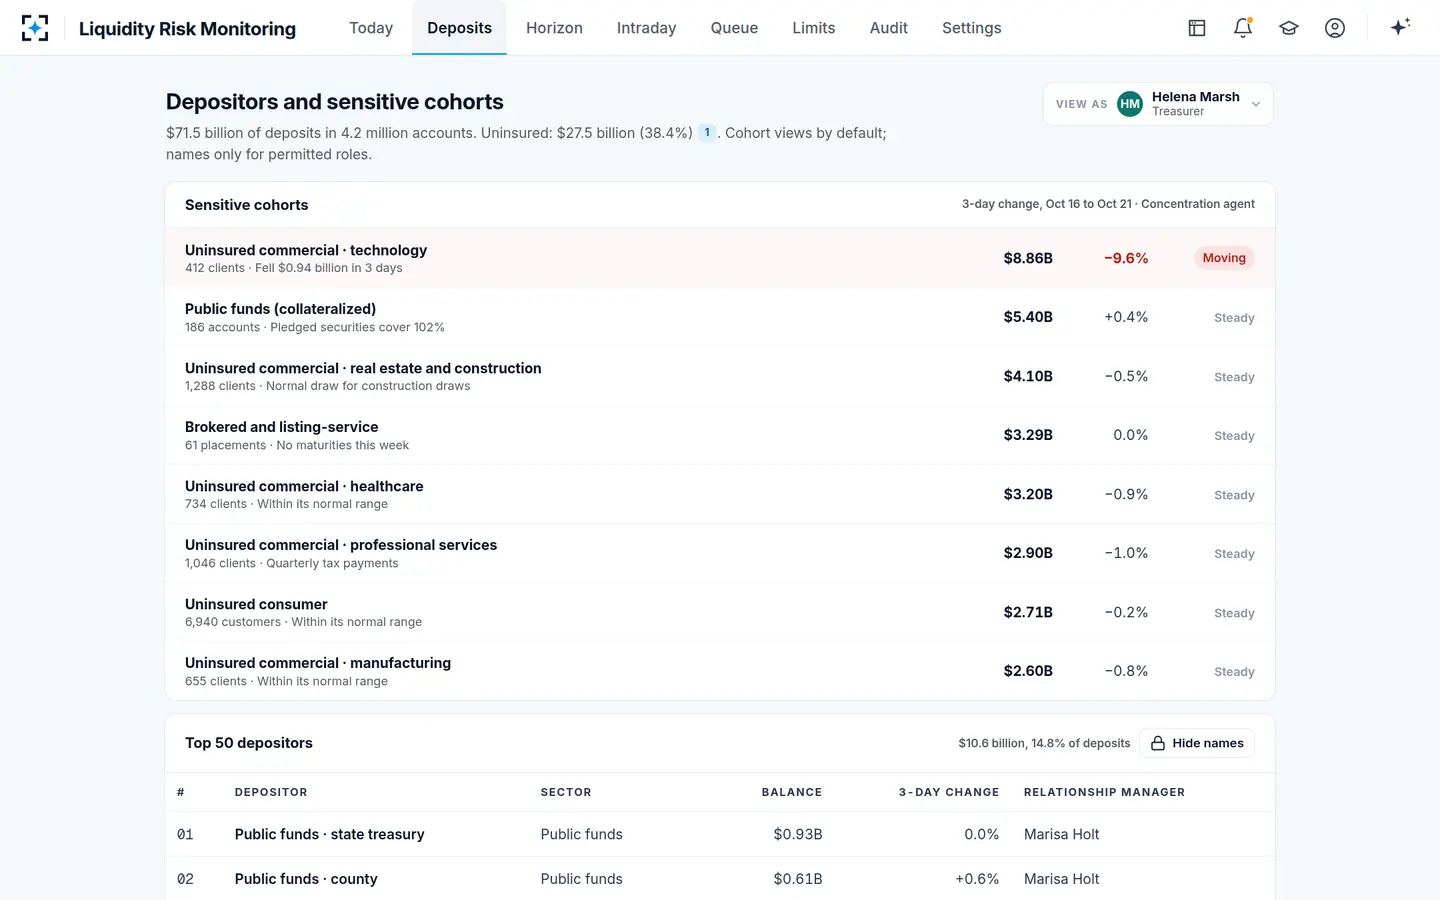
Uninsured deposits by cohort in Liquidity Risk Monitoring: $27.5 billion, and one cohort moving
Are reciprocal deposits insured?
Reciprocal deposits are placed through a network so that each piece stays within the insurance limit at another bank, and the FDIC counts them as insured: its 2026 Risk Review describes them as "a subset of insured deposits" and reports they grew 14.6% at community banks in 2025, "likely reflecting continued heightened depository sensitivity to insurance coverage" (FDIC, 2026 Risk Review). The brokered deposit rules that govern them changed in 2026: the FDIC amended its brokered deposit regulations by interim final rule, effective September 1, 2026, to conform to changes the 21st Century ROAD to Housing Act made to the reciprocal deposit provisions (91 FR 56022).
For monitoring, reciprocal deposits move money out of the uninsured column without changing the depositor. That lowers the ratio and usually lowers run risk, but the relationship and the network become a dependency of their own, which is why the sample bank tracks brokered and listing-service money as a separate cohort. How to treat a sudden shift into reciprocal placements is a judgement for the bank's own policy.
Why the FDIC charged the 2023 cost on uninsured deposits
The uninsured ratio stopped being only a liquidity measure in 2023: it became the basis for charging the cost of the failures. The FDIC's special assessment to recover the cost of the SVB and Signature failures, currently estimated at about $16.7 billion, was applied to each banking organization's estimated uninsured deposits reported for December 31, 2022, "adjusted to exclude the first $5 billion"; 141 insured institutions in 110 banking organizations paid it (FDIC, special assessment). The quarter-end estimate, in other words, has consequences beyond the board report, and getting it right on the reporting date matters for its own reasons. For the liquidity desk the more useful number is the daily one. The other indicators that should sit beside it are tested in early warning indicators for liquidity risk, the depositors behind a move are named in deposit concentration risk, and the whole morning is on the Liquidity Risk Monitoring page.
Questions people ask
Where can I find a bank's uninsured deposits?
Banks with $1 billion or more in total assets report estimated uninsured deposits each quarter in Schedule RC-O, Memorandum item 2, of the Call Report, which is publicly available after filing. The FDIC publishes the industry total in its Quarterly Banking Profile; for smaller banks it calculates an estimate from the accounts above $250,000.
What is the deposit insurance limit used in the ratio?
The standard maximum deposit insurance amount, currently $250,000 per depositor, per insured bank, for each account ownership category. Only the excess over that amount, for each depositor and category, counts as uninsured, which is why a depositor-level calculation can differ from an account-level one.
Do collateralized public deposits count as uninsured?
For the Call Report estimate, yes: the FDIC told banks in 2023 that reducing the figure for deposits secured by pledged assets was incorrect, because collateral has no bearing on the portion of a deposit that is insured (FDIC FIL-37-2023). For liquidity monitoring they behave differently from unsecured commercial money, so most banks track them as their own cohort; the sample bank's collateralized public funds are $5.40 billion, covered 102% by pledged securities.
Why are uninsured deposits rising in 2026?
The FDIC reported that estimated uninsured domestic deposits accounted for all of the increase in domestic deposits in the second quarter of 2026, as insured deposits fell slightly, continuing 2025's 7% growth in uninsured deposits. The FDIC's reports describe the trend rather than its causes; for a single bank, the cohort view shows which depositors are driving it.
Is the uninsured deposits ratio the same as uninsured deposits to total assets?
No. The ratio to total deposits shows what share of the deposit base could run; the ratio to total assets shows how much of the balance sheet it funds. Signature Bank's uninsured deposits were 90% of total deposits but 72% of total assets at the end of 2022, so the denominator should always be stated.