Early warning indicators for liquidity risk are measures a bank watches daily to see a liquidity stress building before it becomes a crisis: deposit outflows by cohort, the uninsured share, concentration in the largest depositors, sweeps out of the bank, certificate redemptions, funding costs, collateral and borrowing capacity, and market signals such as the share price and credit spreads. Each has a warning level and a limit set in the bank's policy, and a trip feeds the contingency funding plan's stages. The hard part is not listing them but knowing whether they would fire in time, and the only honest test is a replay on a stress that really happened. Botminds' Liquidity Risk Monitoring is an agentic solution that recomputes a bank's indicators every morning and explains each move; this guide replays the public record of Silicon Valley Bank and Signature Bank to show which kinds of indicator led and which lagged, and how to run the same test on your own last stress day.
The bank facts below come from the Federal Reserve's and the FDIC's April 2023 reviews; the reading of them as indicators is ours and is labelled as such. Product examples come from the solution's fictional sample bank, Corvane National Bank.
Two failures, and the signals in their own files
94%
of SVB's total deposits uninsured at year-end 2022
85%
of SVB's deposit base: the outflow on March 9 and the outflow expected on March 10, together
10→35%
Signature Bank's digital-asset deposit indicator: breached at 10%, then the limit was raised to 35% of total assets
53hours
from SVB's failure to Signature Bank's closure
Which early warning indicators did SVB trip, and when?
Replayed on the Federal Reserve's review, Silicon Valley Bank's balance-sheet indicators were flashing for more than a year before the run, while its market indicators stayed quiet until the day before. The grid below reads the review's findings as seven indicators across five points in time. A dark cell means the public record shows the signal past any plausible warning level; a pale one, a signal building; white, quiet.
SVB's indicators, replayed: the balance sheet warned early, the market warned last
Uninsured share of deposits
End 2021Growth was largely uninsured
Mid 2022Majority uninsured
Late 2022About 94% at year-end
Mar 8, 2023—
Mar 9, 2023The run
One sector, one network
End 2021VC and technology clients
Mid 2022—
Late 2022VC-backed firms: over half of deposits
Mar 8, 2023—
Mar 9, 2023Correlated withdrawals
Rapid growth on volatile funding
End 2021Tripled in size, 2019–21
Mid 2022Deposits stop growing
Late 2022—
Mar 8, 2023—
Mar 9, 2023—
Deposit outflows
End 2021Inflows
Mid 2022Client deposits fall from Q2
Late 2022Outflows in 2H
Mar 8, 2023Continuing
Mar 9, 2023Over $40 billion in a day
Internal liquidity stress test
End 2021Scenario found too mild
Mid 2022Shortfalls from July
Late 2022Assumptions eased in October
Mar 8, 2023—
Mar 9, 2023—
Contingent funding readiness
End 2021Buffer monetization gap found
Mid 2022Partly fixed
Late 2022Discount window untested in 2022
Mar 8, 2023—
Mar 9, 2023Could not move collateral fast
Equity price and ratings
End 2021—
Mid 2022—
Late 2022Relatively stable
Mar 8, 2023Restructuring announced; Moody's acts
Mar 9, 2023Stock crashes at the open
Past warningBuildingQuiet
The pattern is the finding. Concentration and uninsured share were extreme throughout: venture-backed companies held more than half of the bank's deposits at the end of 2022, and the review describes a deposit base "overwhelmingly skewed toward large, uninsured deposits in non-maturity accounts from VC-backed and private equity clients" (Federal Reserve). The bank's own stress test began failing in mid-2022, and "As deposit outflows increased, the ILST shortfalls increased." Contingent funding was weak and known to be: "Insufficiencies in the contingency funding plan, such as lacking sufficient capacity to monetize the liquidity buffer, were identified in November 2021 and remained only partially resolved when SVBFG failed."
The market said nothing until the bank itself spoke. The review notes that "Until SVBFG's announced restructuring actions on March 8, 2023, however, SVBFG's equity price had been relatively stable before deteriorating sharply following the balance sheet restructuring." An indicator set weighted to share prices, spreads and ratings would have given a day's warning. One weighted to the bank's own deposits and stress results would have given months.
How long before the run each kind of signal was visible in SVB's record
The October 2022 row deserves a second look, because it is what defeats an indicator without anyone deleting it. "Most substantively, management targeted changes to ILST assumptions in October 2022 that had the effect of reducing the size of the modeled liquidity shortfall," the review says; the changes to unfunded commitments and intraday liquidity cut the 30-day requirement "by approximately $8 billion and $5 billion, respectively." Its verdict applies to every indicator with a threshold: changing the assumptions instead of the liquidity position is not a proper way back inside a limit (the survival horizon guide quotes the sentence).
Signature Bank's file: the indicator that was moved instead of watched
Signature Bank had an indicator on exactly the risk that failed it, and changed the limit when the indicator tripped. The FDIC's review records that "In one case in 2021, SBNY breached a 10 percent key risk indicator for digital assets-related deposit growth. Instead of curbing growth, SBNY increased the limit to 35 percent of total assets" (FDIC, April 2023).
Its concentration indicators were also extreme. "Approximately 60 clients held deposit account balances in excess of $250 million, representing about 40 percent of total deposits," and "Four separate depositors, each comprised greater than 2 percent of total assets, and together held 14 percent of total assets." Uninsured deposits were 90% of total deposits at the end of 2022. In 2022 the bank had $17.6 billion of deposit outflows, with digital asset-related deposits 62% of them. Every one of those numbers was visible in the bank's own data months before March 10, 2023.
The last signal was the collateral number itself. Examiners found the bank's liquidity reports still misstating pledged securities up to the weekend of the failure. An early warning indicator computed on a wrong input does not warn; it reassures.
What are early warning indicators for liquidity risk, according to the regulators?
The regulators describe early warning indicators as a bank-specific set, tied to the contingency funding plan's stages, not as a fixed list. The 2010 Interagency Policy Statement says management "should monitor for potential liquidity stress events by using early-warning indicators and event triggers" and "should tailor these indicators to its specific liquidity risk profile," and that the plan's stages can be used "to design early-warning indicators, assess potential funding needs at various points in a developing crisis, and specify comprehensive action plans" (Interagency Policy Statement). For holding companies of $100 billion or more, Regulation YY makes it a rule: the plan "must identify early warning indicators that are tailored to the company's capital structure, risk profile, complexity, activities, and size" (12 CFR 252.34(f)).
The OCC's examiner booklet gives the longest public list of examples, eighteen in all, and two of them read as if written for 2023.
Rising funding costs in an otherwise stable market. Increased redemptions of CDs over $250,000 before maturity.
OCC, Comptroller's Handbook, Liquidity, version 1.2, early warning signals
Read against the two failures, the OCC list has a gap. Of its eighteen signals, eight face markets and reputation (rating watches, spreads and share price, negative publicity, long-term debt access, broker-dealers, loan-sale appetite, market disruption and rumours customers raise with staff), three face counterparties and contracts, two the bank's own condition, and five the bank's own funds providers. None names the uninsured share or a correlated network of depositors, the two things that drove both runs. That is not a criticism of a 2023 booklet written as examples; it is the reason a bank's own set must add what its own balance sheet makes dangerous.
Liquidity early warning indicators examples: the OCC's eighteen, sorted by what they look at
| What the signal looks at | OCC examples | Did it lead in 2023? |
|---|---|---|
| The bank's own funding base | Rapid asset growth funded with volatile liabilities; reluctance of traditional funds providers; reluctance of trust managers, money managers, public entities and credit-sensitive providers; rising funding costs in an otherwise stable market; CD redemptions over $250,000 before maturity | Yes, where measured: SVB's growth on uninsured deposits and its 2022 outflows were visible for months |
| Counterparties and contracts | Counterparty resistance or higher margins; elimination of committed credit lines; impending triggers in debt and securitization documents | Late: credit lines and collateral became the binding constraint on the last day |
| The bank's condition | Pending criminal or regulatory action, or rating downgrades; significant deterioration in asset quality | Mixed: SVB's liquidity was rated strong while in the regional portfolio |
| Markets and reputation | Rating agency watches; wider spreads and falling stock; negative publicity; difficulty in long-term debt markets; broker-dealers' reluctance; reluctance to buy planned loan sales; market disruption; rumours customers raise with staff | Last: SVB's equity price was relatively stable until March 8, 2023 |
What is a liquidity trigger vs a warning?
A warning level is the point at which an indicator needs attention and an explanation; a limit, or trigger, is the point at which the bank's policy says something must happen, such as a decision or a stage of the contingency funding plan. The policy statement also uses "event triggers" for something narrower: conditions written into a bank's own contracts, such as public debt, warehouse lines or derivatives, that can force a funding need when breached. Banks that rely on brokered deposits are told to build triggers for a prompt corrective action downgrade into their contingency funding plans, because a change in that status can cut off the funding (what a contingency funding plan must contain quotes the passage).
The FDIC's manual adds a severity scale: early warning indicators "may be classified by management as early-stage, low-severity, or moderate-severity stress events" (FDIC RMS Manual). In the sample bank, each of the 18 indicators has a warning level and a limit; the contingency funding plan's stage 1 starts when a second indicator passes its limit or the survival horizon falls under 55 days, and a standby notice is drafted, not sent, when one indicator trips and a related one is past warning.
How do you test liquidity early warning indicators?
You test early warning indicators by replaying them on stress windows whose outcome you know, using only the data that existed on each day, and measuring three things: how early each one fired, how often it fired for nothing, and whether its explanation was right. The method fits on one page.
How to replay your early warning indicators on a real stress
- Pick the windows
Your own largest outflow week of the past three years, a quiet month for false alarms, and a public case such as March 2023 rebuilt with balance sheet figures shaped like yours.
- Rebuild each day as it was known
Use the balances, payments and collateral files that existed at the time, including late ones. A replay on corrected data overstates every indicator.
- Apply the thresholds in force then
Use the warning levels and limits that were approved at the time, and record every change to them during the window, with who approved it.
- Measure lead time
For each indicator, the days between its first warning and the decision it should have prompted. An indicator that warns the day after is a report, not a warning.
- Count false alarms
Trips in the quiet month that needed no action. A set that cries wolf every week will be ignored on the week that matters.
- Check the explanation
For each trip, could the team name the depositors and the cause within the morning? A warning nobody can explain is hard to act on.
- Write down the changes
New indicators, moved thresholds and retired ones go through the second line and ALCO, with the replay as the evidence.
Indicators of this kind are usually simple arithmetic against a threshold, which matters for model risk. The 2026 interagency model risk guidance, SR 26-2, which replaced SR 11-7, excludes simple spreadsheet arithmetic and deterministic rule-based processes from what it calls a model, and puts generative and agentic AI outside its scope; how SR 26-2 treats a risk-rating model sets out the text. A replay is still the right evidence for an indicator set whether or not the bank treats it as a model: it is how the second line shows the thresholds would have done their job.
How many early warning indicators should a bank have, and who sets the thresholds?
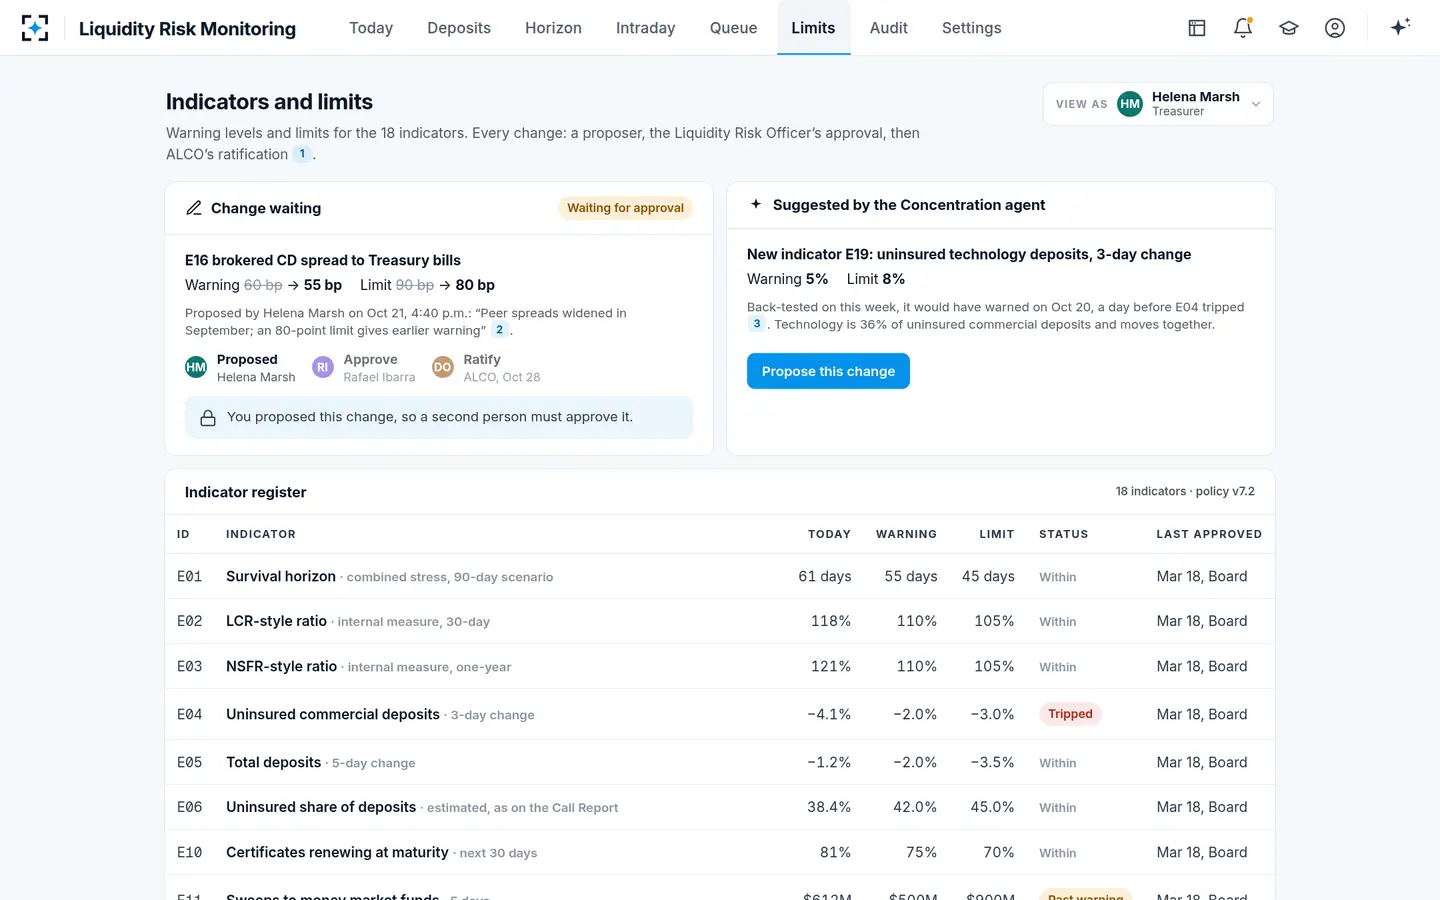
There is no regulatory number. The right count is the smallest set that covers each way the bank's own funding can leave, with each indicator owned by someone who can explain it. The sample bank in Liquidity Risk Monitoring watches 18 in five groups: survival and ratios, deposits and flows, concentration, contingent capacity, and market and wholesale funding. Its thresholds belong to the bank's policy: a proposer, such as the treasurer, suggests a change, the liquidity risk officer approves, ALCO ratifies, and the proposer cannot approve their own change.
The same route applies to an indicator the agents suggest. On the sample morning, the Concentration agent proposed a new one after uninsured commercial deposits tripped: uninsured technology deposits, three-day change, warning 5% and limit 8%. Back-tested on that week, it would have warned on October 20, a day before the broader indicator tripped, because technology clients were 36% of uninsured commercial deposits and moved together. It now waits for the liquidity risk officer like any other change.
Liquidity Risk Monitoring suggests an indicator with its back-test, and the second line decides
Why do aggregate deposit indicators trip late?
Aggregate deposit indicators trip late because a run by one group of depositors is diluted by everyone who stays. The sample bank's morning shows it in two lines of the same note. Total deposits fell $0.86 billion, 1.2%, over five days: within limits, because consumer balances rose $0.20 billion over the same days. Uninsured commercial deposits fell $1.06 billion, 4.1%, in three days, past their 3.0% limit. Inside that, technology clients were down 9.6%.
One morning in Liquidity Risk Monitoring: the total is within, the cohort has tripped
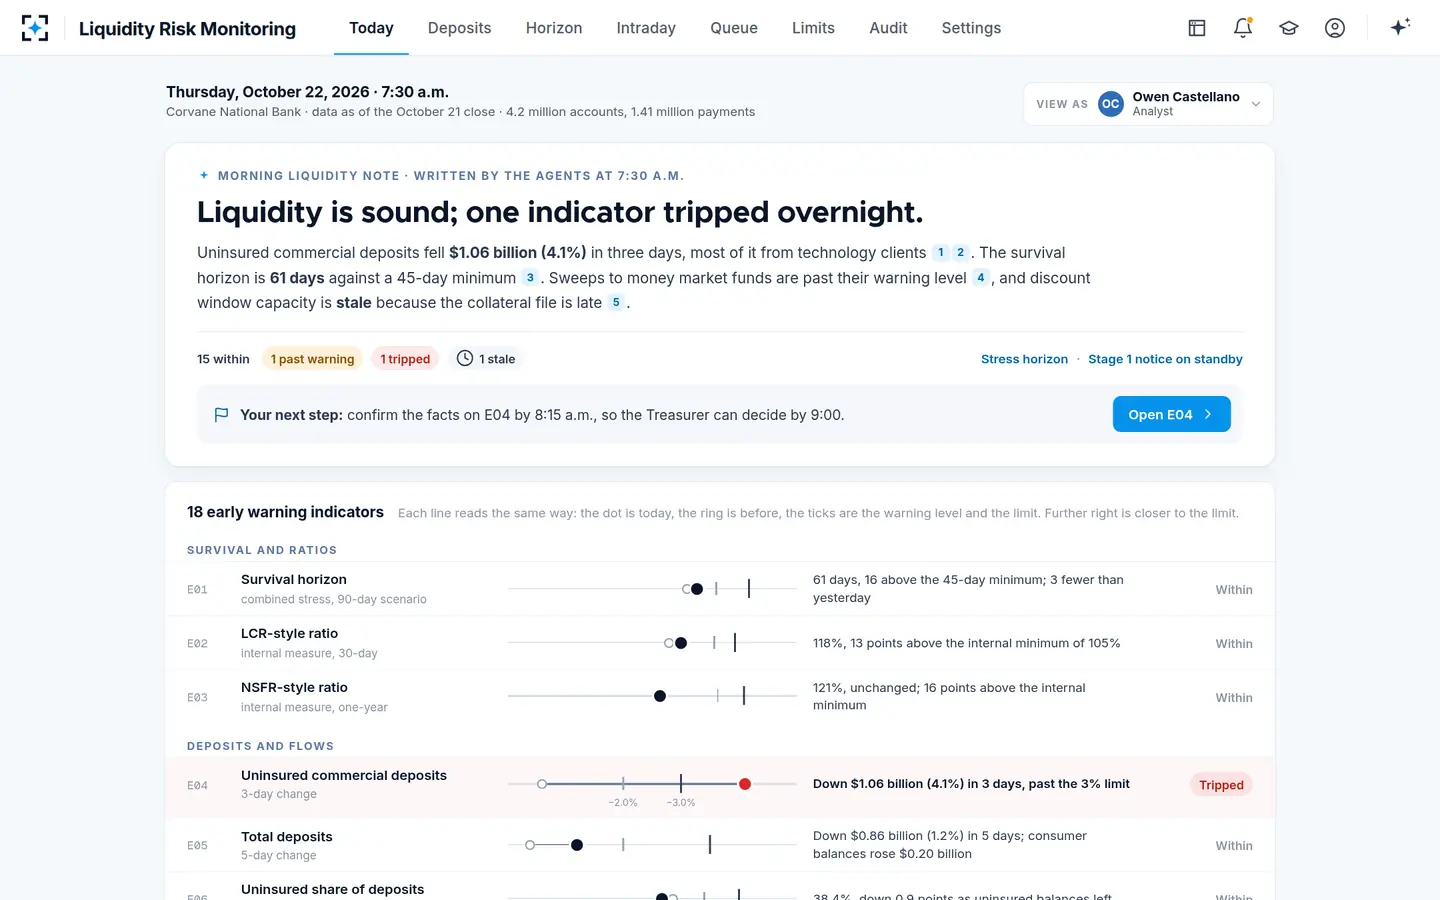
The lesson for an indicator set is to draw at least one line on each cohort that can run together: uninsured commercial deposits by sector, the largest depositors, depositors who share an investor or an industry, and sweep and wire flows out of the bank. The FDIC warns its examiners that heavy aggregation can hide liquidity risk (FDIC RMS Manual), and the replay is where a bank finds which of its own aggregates are doing the masking.
What a replay on your own last stress day shows that a list cannot
A replay on your own data shows which of your indicators are early, which are late and which never move, and it usually shows that the early ones are about who holds the deposits rather than how much there is. Three findings recur when banks replay 2023 on themselves. Aggregate deposit indicators trip late, for the reason above. Cohort indicators trip early but need an explanation to be acted on, which is why naming who moved the money belongs next to them. And contingent-capacity indicators are only as good as the collateral file behind them, which is why a stale mark is part of the indicator, not a footnote.
The second test is the decision log. For every trip in the window, was there a recorded decision, with a reason, by the person the policy names? A bank that cannot show its decisions not to escalate has an indicator set it cannot prove it uses. What two of 2023's failures cost when signals were missed is set out in a liquidity risk example from 2023, and the indicators themselves run every morning in Liquidity Risk Monitoring.
Questions people ask
What does the OCC list as early warning signals for liquidity?
The OCC's Liquidity booklet lists eighteen examples, including rapid asset growth funded with volatile liabilities, rising funding costs in an otherwise stable market, increased redemptions of CDs over $250,000 before maturity, rating agency watches, widening spreads and falling stock prices, and the elimination of committed credit lines. The OCC presents them as examples; each bank is expected to tailor its own set.
Who sets liquidity early warning thresholds?
The bank sets them in its liquidity policy, approved by the board or its delegated committee, with the second line owning the standard and ALCO monitoring compliance. Good practice is that whoever proposes a change cannot approve it; Signature Bank's 2021 decision to raise a breached 10% indicator to 35% of total assets is the cautionary case.
What is the difference between a KRI and an early warning indicator?
The terms overlap. A key risk indicator is any metric tracked against a limit to show risk exposure; an early warning indicator is one chosen because it moves before a stress becomes acute and is wired to the contingency funding plan's stages. Signature Bank's digital-asset deposit growth measure was called a key risk indicator, and it worked as an early warning until its limit was raised.
How often should early warning indicators be reviewed?
The values should be recomputed at least daily for any bank with concentrated or uninsured deposits, and the set and its thresholds reviewed at least annually with the liquidity policy and contingency funding plan, and whenever a replay or a real event shows one failed. Regulation YY requires large holding companies to update the plan at least annually.
Do early warning indicators need model validation?
Usually not as models. The 2026 interagency model risk guidance, SR 26-2, excludes simple arithmetic and deterministic rule-based processes from its definition of a model, which covers most threshold indicators, though a stress model behind an indicator such as the survival horizon may be in scope. Either way, a documented replay on past stress is the evidence the second line and examiners will ask for.
Which early warning indicator would have flagged SVB first?
On the public record, balance-sheet indicators would have flagged it long before market ones: the uninsured share and sector concentration were extreme throughout 2022, client deposits were falling from the second quarter, and the internal stress test was failing from July 2022. The share price and ratings moved only on March 8, 2023, the day before the run.