A liquidity dashboard is the screen where a bank's treasury and risk teams read the liquidity position: deposit balances and flows, early warning indicators against their warning levels and limits, stress results, ratios and contingent funding capacity, refreshed from the core banking system, the payments hub, the general ledger and the ALM model. A good one shows clearly what moved overnight. The decision that follows needs more than that: which depositors moved the money, whether others in the same network will follow, what the move does to the survival horizon, and the evidence for each answer. Botminds' Liquidity Risk Monitoring is an agentic solution that starts from the same indicators a dashboard shows and carries on to that decision. This guide traces one morning in it, step by step, from the overnight files to the treasurer's decision, and shows where a person must confirm what the agents found.
The morning is the solution's fictional sample bank, Corvane National Bank, a US regional bank of about $92 billion in assets, on Thursday, October 22, 2026, with data as of the October 21 close: 4.2 million deposit accounts and 1.41 million payments. The bank, its clients and its people are fictional. The rules quoted come from the banking agencies and are linked where they appear.
Liquidity Risk Monitoring's morning: the agents finish before the analyst opens the note
- Files land; ALM stress run at 6:405:00–6:40
- Indicators6:55
- Trace7:18
- Note7:30
- Before anyone is inuntil 7:30
- Analyst checks7:52
- Treasurer decides8:21
What should a liquidity dashboard show?
A liquidity dashboard should show the bank's exposure, its compliance with limits, the status of its early warning indicators and contingent sources, and the assumptions behind the numbers. That is close to the regulators' own wording. The 2010 Interagency Policy Statement says liquidity risk reports "should impart to senior management and the board a clear understanding of the institution's liquidity risk exposure, compliance with risk limits, consistency between management's strategies and tactics, and consistency between these strategies and the board's expressed risk tolerance" (Interagency Policy Statement).
The OCC's examiner booklet is more specific. Its list of what liquidity management information should include runs from "funding concentration reports that highlight the dependence on sources of funds that may be highly sensitive to bank-specific contingent liquidity risk" to "the status of key early warning signals or risk indicators," the state of contingent funding sources and collateral, and "a selected set of appropriate liquidity ratios that highlight the liquidity risk profile of the bank and trends in these ratios" (OCC, Liquidity booklet). Most dashboards cover the ratios and the trends well. The items that need judgement, the assumptions and their implications, and the dependence on sensitive funds providers, are the ones most often left to a footnote.
What the regulators expect a liquidity dashboard to show, and what the sample note adds
| Expected item | Typical dashboard | Sample 7:30 a.m. note |
|---|---|---|
| Exposure and compliance with limits | Each metric against its limit, coloured | 18 indicators on one scale: today, the prior value, the warning level, the limit, and the value in words |
| Status of early warning indicators | Green, amber, red | Within, past warning, tripped or stale, with what changed since yesterday |
| Funding concentrations and sensitive providers | Top depositors' share | The moving cohort, and the clients and payments behind the move, named only for permitted roles |
| Critical assumptions and their implications | Rarely on screen | The stress outflow assumptions behind the survival horizon, with who set them and when |
| Contingent funding sources and collateral | Capacity totals | Each source with its value and time; discount window capacity marked stale when its file is late |
| Ratios and trends | Usually shown well | LCR-style and NSFR-style ratios, labelled internal measures |
A liquidity dashboard answers "what"; the treasurer asks "who"
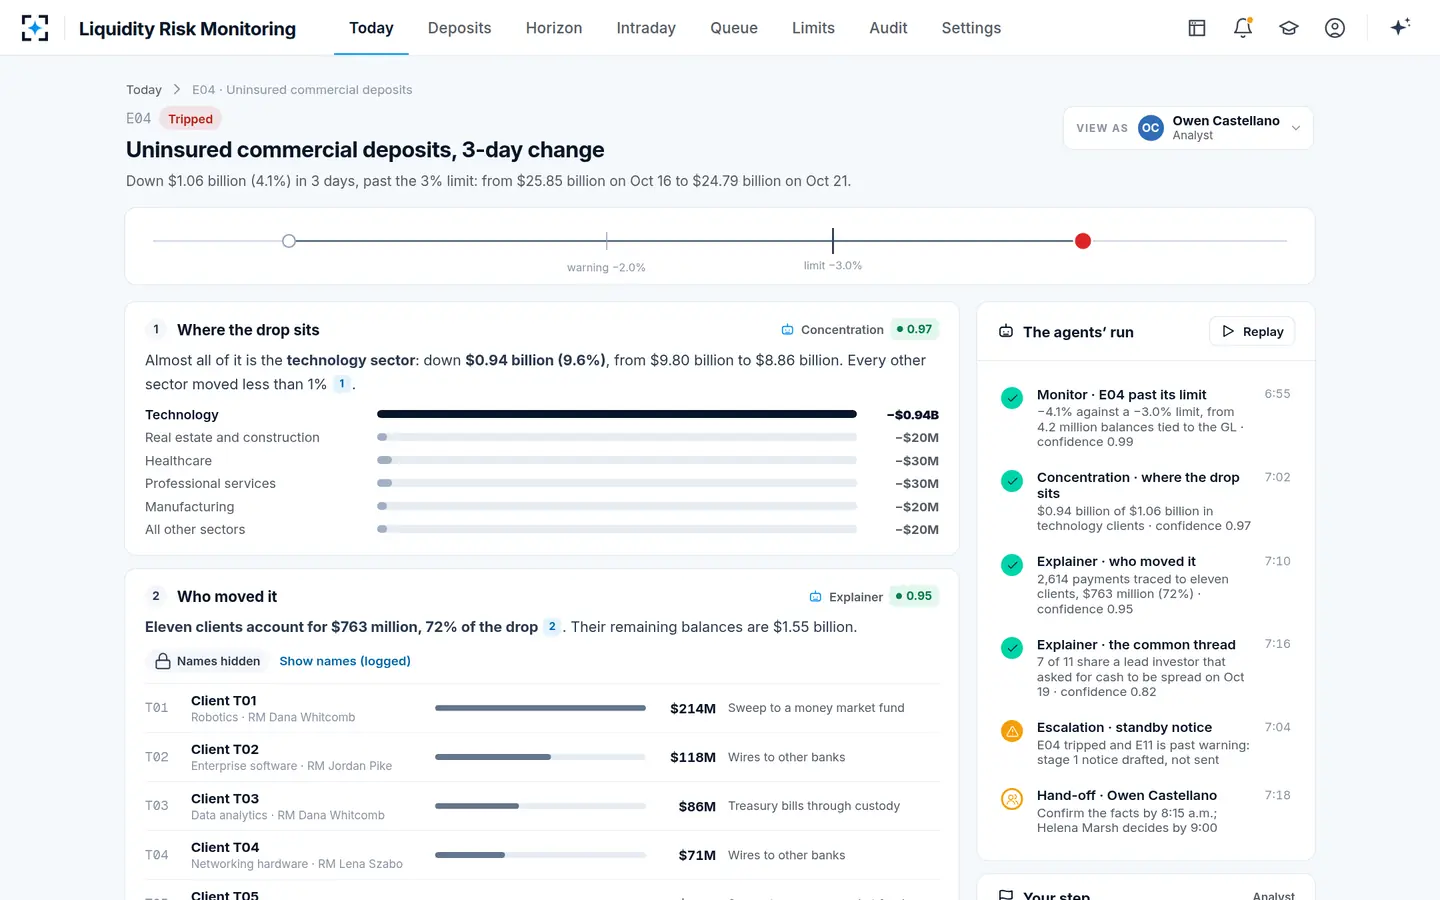
A dashboard answers the question it was designed for: is any measure past its limit? On the sample morning the answer was yes. Uninsured commercial deposits fell $1.06 billion, or 4.1%, in three days, from $25.85 billion to $24.79 billion, past a 3.0% limit. A dashboard turns that cell red.
The treasurer's next three questions are not on a red cell. Who moved the money? Is it one sector, one network, one event? And if the rest of that group follows, how many days of stress does the bank still survive? Answering them by hand means a payments trace and an ALM what-if, which is why the mid-morning report at many banks says what moved but rarely who moved it. The comparison below is the difference in one table.
The same tripped indicator on a dashboard and in the 7:30 a.m. note
Liquidity dashboard: Uninsured commercial deposits, −4.1% in three days, red.
Liquidity Risk Monitoring note: The same, plus where it sits: technology clients, −$0.94 billion (−9.6%); every other sector moved less than 1%.
Liquidity dashboard: Not shown. An analyst traces payments by hand.
Liquidity Risk Monitoring note: Eleven clients, $763 million, 72% of the drop, from 2,614 payments; names hidden unless a permitted role shows them, with a logged reason.
Liquidity dashboard: Not shown.
Liquidity Risk Monitoring note: A common thread at 0.82 confidence: 7 of the 11 share a lead investor that asked its companies on October 19 to spread their cash.
Liquidity dashboard: The survival horizon from last week's run.
Liquidity Risk Monitoring note: 61 days today against a 45-day minimum; 54 if the eleven move their remaining $1.55 billion this week.
Liquidity dashboard: The cell's value.
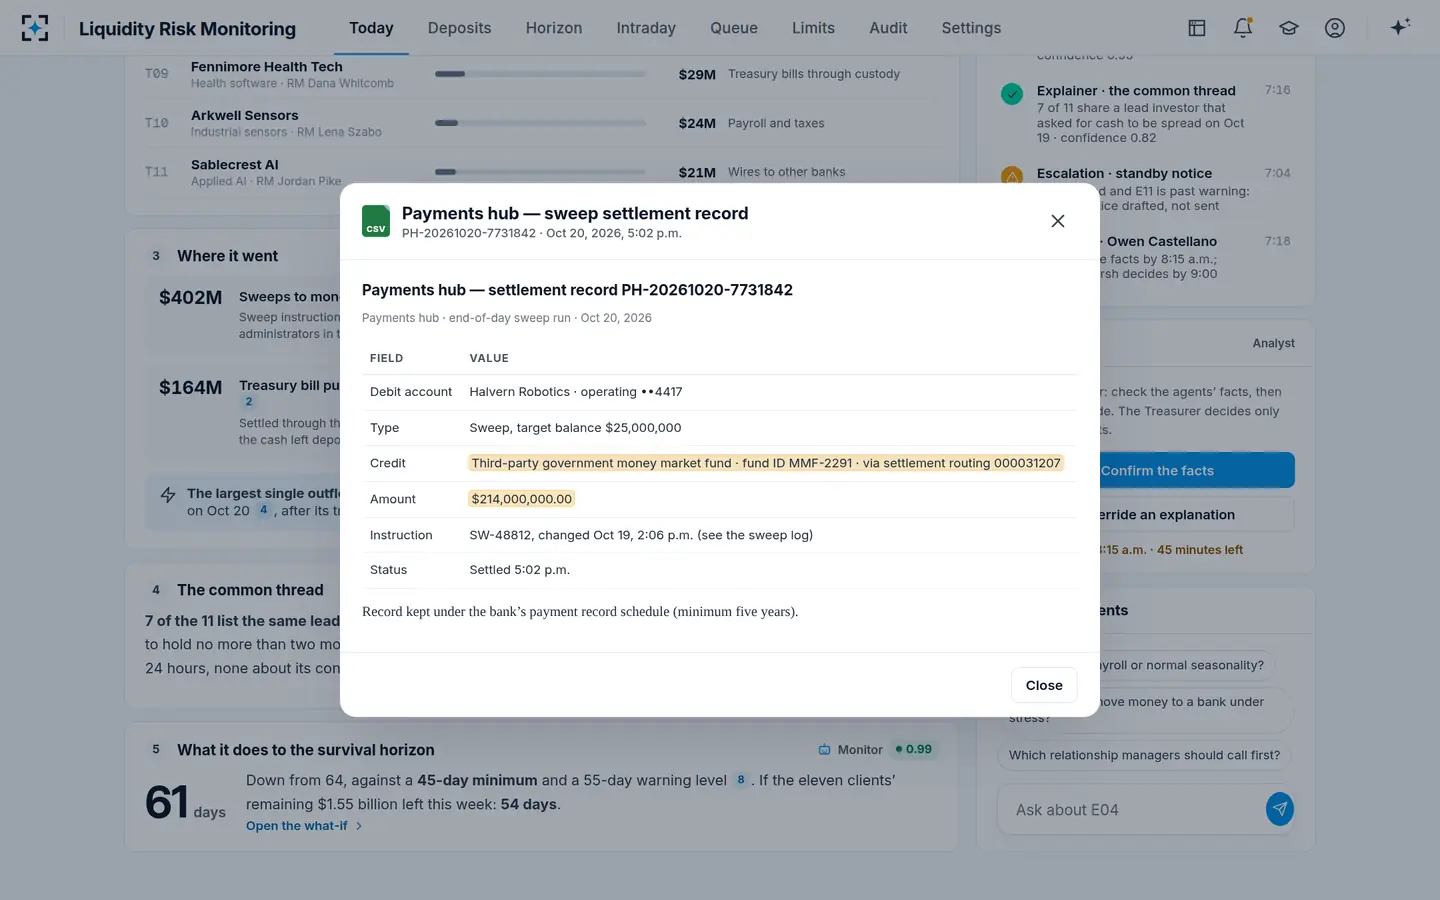
Liquidity Risk Monitoring note: Each statement cites a record: the core extract, a payments hub settlement record, the sweep log, an onboarding record.
Liquidity dashboard: Left to the reader.
Liquidity Risk Monitoring note: Confirm the facts by 8:15 a.m.; the treasurer decides by 9:00 a.m.
One morning, traced from the overnight files to a 9:00 a.m. decision
Traced step by step, the morning is a chain of reads, checks and drafts, each with a time and an owner. The agents' part is finished before the analyst opens the note; the people's part is checking and deciding, and the record keeps both.
The sample morning, step by step: who read, checked or drafted what, and when
| Time | Who | What happened | Evidence kept |
|---|---|---|---|
| 5:00 a.m. | Feed Steward agent | The collateral management system's file is due and does not arrive. Discount window capacity keeps its October 21, 6:12 p.m. value, $6.2 billion, and is marked stale. | File arrival log |
| 6:40 a.m. | ALM model | The stress cash flows for the combined scenario are produced, on assumptions ALCO set in June 2026. | ALM run |
| 6:55 a.m. | Monitor agent | All 18 early warning indicators recomputed from 4.2 million balances tied to the general ledger. E04, uninsured commercial deposits, is past its limit. | Core extract, general ledger tie-out |
| 7:02 a.m. | Concentration agent | Finds where the drop sits: $0.94 billion of the $1.06 billion in technology clients, at 0.97 confidence. | Cohort balances |
| 7:04 a.m. | Escalation agent | One indicator tripped and a related one, sweeps to money market funds, is past warning: drafts the contingency funding plan's stage 1 notice and holds it, unsent. | Draft notice |
| 7:10 a.m. | Explainer agent | Traces 2,614 payments to eleven clients who moved $763 million, 72% of the drop, at 0.95 confidence. | Payments hub settlement records |
| 7:16 a.m. | Explainer agent | Finds the common thread: 7 of 11 list the same lead investor in onboarding, which asked its companies on October 19 to hold no more than two months of cash at any one bank. Confidence 0.82. | Onboarding records, sweep log |
| 7:30 a.m. | Note published | "Liquidity is sound; one indicator tripped overnight." 15 within, 1 past warning, 1 tripped, 1 stale. | Every number cited |
| 7:52 a.m. | Treasury risk analyst | Opens the citations and confirms the facts: the maker step, due by 8:15. | Confirmation with name and time |
| 8:21 a.m. | Treasurer | Decides Watch, reason code "Explained and contained": calls to all eleven by noon, re-check at 2:00 p.m., escalate if sweeps pass their limit. | Decision with nine citations and the agents' versions |
The tripped line opens the cohort behind the move, and the agents' run beside it
What data feeds a liquidity dashboard?
Six feeds carry most of a bank's daily liquidity picture: deposit balances from the core, payments from the payments hub, the general ledger tie-out, sweeps from the treasury management system, stress cash flows from the ALM model, and collateral from the collateral management system. Each one fails differently, and a dashboard is only as current as its latest file.
The six feeds behind a liquidity dashboard, and what goes wrong when one is late or wrong
| Feed | What it gives the morning | When it is late or wrong |
|---|---|---|
| Core banking system | Balances for every deposit account, with sector and insured status | Indicators are computed on yesterday's balances, or on a total that does not tie to the general ledger |
| Payments hub | Fedwire, ACH and book transfers, with the counterparty and channel | A move can be seen but not traced to the clients behind it |
| General ledger | The daily tie-out of deposits to the core, with its difference and tolerance | Nobody knows whether a drop is real or a booking difference |
| Treasury management system | Sweeps and sweep instructions, with the time each changed | A client's decision to move cash is invisible until the money has gone |
| ALM model | Stress cash flows behind the survival horizon and every what-if | The horizon is last week's, on last week's balance sheet |
| Collateral management system | Discount window pledges and lendable value | Contingent capacity is overstated; at Signature Bank pledged securities were misstated until the day it failed |
The collateral row is the one regulators single out. The policy statement wants a bank able to work out, promptly, every collateral position it has: what is pledged against what each lender requires, and what is still free to pledge (the pledged loans guide quotes the OCC's version of the sentence). For bank holding companies of $100 billion or more, Regulation YY puts a clock on it: collateral positions calculated at least weekly, or at least monthly for Category IV firms (12 CFR 252.34(h)).
What happens when a liquidity data feed is late?
When a feed is late, the honest dashboard says so on every number that depends on it, and the dangerous one shows yesterday's value in today's colours. A stale number in a liquidity view is not a cosmetic problem, because the stale inputs tend to be the contingent ones, collateral and borrowing capacity, which matter most on the worst day.
Signature Bank is the case on record. In February 2023 examiners questioned its reporting of pledged securities, and the FDIC found that management kept under-reporting pledged securities, and so overstating its on-balance-sheet liquidity, in what it gave examiners; an accurate report of unpledged securities appeared only on the day the bank failed (FDIC, April 2023; quoted in the ALM report, traced to one balance).
On the sample morning the collateral file was late. The note marks discount window capacity Stale on every screen until the file lands, keeps the last value with its time, and never fills the gap with an estimate. The mark matters: of the $25.5 billion of liquidity counted in the survival horizon, $6.2 billion is discount window capacity, and without it the horizon would fall from 61 days to 36, under the 45-day minimum. When the late file arrives, the Feed Steward agent re-runs the indicators.
How often should liquidity indicators be recalculated?
Liquidity indicators should be recalculated at least as often as the bank's riskiest funding can move, which for most banks with concentrated or uninsured deposits now means daily, with intraday watch on payment flows. The rules give the floor and the direction. The policy statement's floor is reporting to senior managers at least monthly in normal times. The FDIC's examination manual describes the range: "Non-complex community institutions that are in sound condition may forecast short-term positions monthly. More complex institutions may need to perform weekly or daily forecasts, and institutions with large payment systems and settlement activities may need to conduct intraday measurements" (FDIC RMS Manual, Section 6.1).
The same manual adds the sentence that settles the question for stress: "All institutions can benefit from having the ability to increase the frequency of monitoring and reporting during a stress event." A dashboard refreshed weekly cannot do that on the morning it is needed, because the slow part is not drawing the chart but rebuilding the inputs. In the sample bank the indicators are recomputed every business morning before 7:30, a design target for all 18 of them, and the intraday watch reads the payments hub hourly, or every 15 minutes on a stress day.
Can a dashboard explain a deposit outflow?
A dashboard built on aggregates cannot explain a deposit outflow, because the explanation lives in account-level payments that the aggregate has already summed away. The FDIC's examiners are told to look for exactly this: "excessive account aggregations in liquidity analysis can mask substantial liquidity risk. Similar to measuring IRR, there are advantages to using account-level information" (FDIC RMS Manual).
Explaining an outflow means three steps a chart does not take: finding the cohort where the move sits, tracing the payments to the accounts and channels behind it, and looking for what those accounts have in common. On the sample morning the common thread was a lead investor's guidance; on another day it might be a payroll cycle, a tax date, or a competitor's rate. Naming who moved the money works through that method on deposit concentration.
Every statement in Liquidity Risk Monitoring opens the record behind it
Liquidity monitoring ends in a decision, not a display
Liquidity monitoring is finished when someone has decided what to do and written down why, including when the decision is to do nothing. A decision not to escalate is rarely written down at most banks, and it is the decision examiners most often ask about after the fact. In the sample bank the treasurer chooses from three options, each with what it sets in motion, and cannot record the choice without a reason code and a sentence.
From a tripped indicator to a decision on the record
Agent
MonitorRecomputes the indicator and finds it past its limit; re-runs the survival horizon and the what-ifs on the clients named.
Never: changes a limit, an assumption or the ALM model.
Agent
ExplainerStates who moved the money and why, with a citation for each statement and a confidence for each cause.
Never: presents a cause below 70% confidence as fact.
A person decides
AnalystConfirms the facts or overrides an explanation with a reason code and a note.
A person decides
TreasurerChooses watch, escalate or act, with a reason code and a reason; escalation needs the liquidity risk officer's check, and action the CFO's approval too.
Agent
Record KeeperWrites the decision with the facts, the citations, who confirmed them and the agents' versions, and sends it to ALCO.
Never: edits a recorded decision.
Buying a liquidity dashboard: what to test, and where this solution does not fit
Test a liquidity dashboard on your own worst morning, not on a sample month where nothing happened. The questions that separate tools are about late data, explanation and decisions, and each can be checked in an hour with your own files. Fifteen questions to ask before you buy sets out the full list with good and evasive answers; the shortest version is below.
Six tests to run on any liquidity dashboard before you buy
- Hold back one feed
Remove the collateral file from a test day. Every number that depends on it should say stale, with the time of the last good value.
- Break the general ledger tie-out
Load a core extract that differs from the general ledger by more than your tolerance. The view should refuse to publish a clean number.
- Replay your own stress day
Load the week of your largest recent outflow and ask who moved the money. Time the answer, and check it against what your team found by hand.
- Ask for the evidence
Click any number. It should open the record it came from, not a definition.
- Try to move a limit alone
Propose a limit change and try to approve it yourself. It should stop you.
- Record a decision to do nothing
Choose watch, give a reason, then try to edit it the next day. It should be kept as it was, with who and when.
Where the solution does not fit is as useful to know. It does not replace the ALM model, whose stress cash flows it reads and never changes. It does not prepare the FR 2052a or compute a regulatory LCR: those belong to how to calculate the LCR and the reporting team. It does not hold or release payments. And a small bank with a granular, insured deposit base and little payment activity may be well served by a monthly report and a good spreadsheet; the case for daily explanation grows with uninsured concentration and payment volume. The whole solution is on the Liquidity Risk Monitoring page, and a six-week go-live plan shows what a bank brings to start.
Questions people ask
What is a bank liquidity dashboard?
A bank liquidity dashboard is a regularly refreshed view of the bank's liquidity position for treasury, risk and senior management: deposit and funding balances, early warning indicators against limits, stress results such as the survival horizon, liquidity ratios and contingent funding capacity. Regulators expect such reports to show exposure, compliance with limits and the status of early warning indicators and contingent sources.
How do you show stale data on a liquidity dashboard?
Mark every value that depends on a late feed as stale, show the time of the last good value, and do not fill the gap with an estimate unless the estimate is labelled as one. In the sample bank, discount window capacity carried its October 21, 6:12 p.m. value with a Stale mark until the collateral file arrived; it mattered because the horizon without that capacity was 36 days against a 45-day minimum.
Who acts on a liquidity dashboard?
The analyst confirms what the numbers say, the treasurer decides whether to watch, escalate or act, and the liquidity risk officer in the second line checks escalations and limit changes. The policy statement asks banks to identify clearly the individuals or committees responsible for making liquidity risk decisions, so a dashboard should make the owner of each next step visible.
Is a liquidity dashboard the same as FR 2052a reporting?
No. The FR 2052a is a regulatory report that large US banking organizations file with the Federal Reserve on a fixed schedule and format; a liquidity dashboard is the bank's own management view, built on its own indicators and limits. They share data, and a bank subject to the FR 2052a often reconciles the two; what LCR means in banking covers the regulatory ratio.
Should a liquidity dashboard be real-time?
Daily is enough for most indicators if it is reliably before the morning decision and if it can be refreshed on demand; payment flows need intraday watch. The FDIC's manual says institutions with large payment and settlement activity may need intraday measurement, and that every institution benefits from being able to increase monitoring frequency during a stress event.
What indicators belong on a liquidity dashboard?
The bank's own early warning indicators, tailored to its funding: typically the survival horizon, internal liquidity ratios, deposit flows by cohort, the uninsured share, the largest depositors' share, sweeps out of the bank, certificates renewing, intraday peak outflow, unencumbered liquid assets, contingent capacity and market signals. The sample bank watches 18 in five groups; early warning indicators replayed on 2023 tests which ones would have fired.