The US casualty reinsurance market made money in 2025 overall and lost it in its biggest liability line. The NAIC's analysis of the 21 companies it classes as professional reinsurers shows a 97.7% combined ratio across all lines, improved by 3.0 points, with net income of $5.1 billion; but other liability written on an occurrence basis ran at 122.3%, and on a claims-made basis at 107.0%. Nonproportional assumed liability, the excess-of-loss casualty line, ran at 53.3%. For a casualty treaty underwriter the lesson is that the market's average says little about any one line, and less about any one cedant. Selection happens program by program, which is the work Botminds' Treaty Underwriting Workbench is built for: every submission's loss ratio rebuilt from the cedant's own data, and the season ranked on the rebuild.
The figures below come from the NAIC's 2025 full-year report on the property and casualty industry, Treasury's Federal Insurance Office, the Florida Office of Insurance Regulation, the Prudential Regulation Authority and the International Association of Insurance Supervisors, each linked where it appears. Examples from the solution use its fictional sample season.
Professional reinsurers' 2025 combined ratios: three of the five largest lines above 100%
How is the casualty reinsurance market doing? Profitable overall, losing on other liability
On the NAIC's figures, professional reinsurers had a good 2025 and a bad year in occurrence-based general liability at the same time. Their combined ratio improved 3.0 points to 97.7%, turning a $749 million underwriting loss in 2024 into a $1.0 billion gain; net income rose 43% to $5.1 billion, "the seventh consecutive year that the professional reinsurance market reported net income" (NAIC, 2025 full-year results). The NAIC's line detail is blunter: "Four of the top five lines had combined ratios worse than the overall industry, three of which were over 100%: other liability – occurrence (122.3%), other liability – claims made (107.0%), nonproportional assumed property (102.4%), and homeowners multiple peril (98.8%)."
Other liability occurrence is not a niche. It was 16.1% of professional reinsurers' unaffiliated assumed premium in 2025, the second-largest line. A combined ratio of 122.3% on that book means every dollar of premium cost about $1.22 in losses and expenses. Its claims-made counterpart, at 7.7% of premium, also lost money. Across the two, casualty proportional and direct-type liability business is where 2025's money was lost.
What is the combined ratio for reinsurers? Five years of the NAIC's professional group
The professional reinsurers' combined ratio has moved around 100% for five years, between 95.1% and 101.0%. The NAIC uses the same 21 companies for all five years, so the series compares like with like.
Professional reinsurers' combined ratio, 2021 to 2025: around 100% every year
Two features of 2025 stand out. The professional group's expense ratio, 32.4%, was 6.6 points worse than the whole P&C industry's, while its net loss ratio was 1.2 points better, partly because the ceding commissions paid on proportional business count among a reinsurer's expenses. And the improvement came from losses, not premium: net premiums earned fell 0.9% while net losses incurred fell 6.5%. The NAIC credits the industry's 2025 underwriting result largely to "the lack of any large-scale natural catastrophes outside of the California wildfires in the first quarter of the year"; in such a year a drop in property losses can make the overall ratio look healthy while casualty lines continue to deteriorate underneath.
Which lines are unprofitable for reinsurers?
In 2025 the unprofitable lines for professional reinsurers were the general liability lines and nonproportional property. The NAIC adds a count that shows how uneven the book is: "Of the 45 lines of business with net premiums written in 2024, 23 had combined ratios above the industry average, and 20 exceeded 100%." Almost half the lines lost money in a year when the market as a whole made it.
The primary market explains the liability losses. The NAIC defines social inflation as rising claim costs above economic inflation from litigation, broader liability, plaintiff-friendly decisions and larger jury awards, and its report says that "Social inflation and litigation financing by third parties will continue to challenge commercial auto and general liability lines of business without any major reform." A quota share reinsurer takes its cedant's share of that directly. Why it lands harder on reinsurance layers, and what it costs to rebuild a casualty program properly, is set out in casualty reinsurance pricing: what one program costs to rebuild by hand.
What is nonproportional assumed liability, and why 53.3% says less than it seems
Nonproportional assumed liability is the annual statement line for liability reinsurance written on an excess-of-loss basis: per-occurrence casualty layers, clash covers and similar. Its 53.3% combined ratio in 2025 was the best of the professional reinsurers' five largest lines, and it was 15.6% of their unaffiliated assumed premium.
Read it with care. A calendar-year combined ratio on a long-tail excess line mixes this year's early estimates with development on every earlier year, and excess casualty is the slowest-developing business there is. Patrik's chapter in the CAS textbook says it plainly: "the real problem in loss reserving is long-tailed exposure, especially excess casualty reinsurance", meaning the exposures "for which the average aggregate claims dollar report lag is over two years and whose claims are not settled for many years" (Patrik, Foundations of Casualty Actuarial Science, ch. 7). A low ratio on that line in one year may prove right, or may be the start of development to come. The figure supports selective writing of excess casualty, not a conclusion that the line is cheap. The underwriter still has to rebuild each layer's history, as the burning cost method shows.
How big is the US reinsurance market?
The answer depends on whether affiliated business is counted, and most of it is affiliated. The NAIC reports that across the P&C industry "Assumed premiums written increased 5.3% YoY to $897.8 billion, of which 88.9% consisted of affiliated assumptions", mostly intercompany pooling within insurance groups. The open, third-party market is the remaining 11.1%, about $100 billion on our arithmetic. Of that, the 21 professional reinsurers wrote $51.5 billion of unaffiliated assumed premium in 2025, down 0.4% on 2024 but about 12% higher than five years earlier, and "approximately 51.5% of total unaffiliated APW".
What the professional reinsurers write: two-fifths of the book is casualty
Unaffiliated assumed premium, 2025 · $51.5 billion
- Nonproportional property · 18.8%
- Other liability, occurrence · 16.1%
- Nonproportional liability · 15.6%
- Other liability, claims-made · 7.7%
- All other lines, including homeowners · 41.8%
The federal view uses a different data cut. Treasury's Federal Insurance Office, working from S&P Global data, reports that net reinsurance cessions for the P&C sector rose 4.7 percent in 2025, "resulting in a record $979.3 billion in net premiums written for the sector" (FIO, Annual Report on the Insurance Industry, September 2026). Both sources agree on the shape: a very large reinsurance flow, most of it inside groups, around a third-party market of roughly a hundred billion dollars.
Reserve development in 2025: favourable overall, adverse in casualty
The industry released reserves in 2025 on a scale not seen in a decade, and casualty was the exception. Treasury's FIO reports that the sector's 2025 reserve development was the most favourable of any year in the past ten, well above 2024. The NAIC puts the one-year redundancy at $20.0 billion and notes that it came after several years of shrinking releases, held down by adverse development in the commercial liability lines as economic and social inflation pushed costs up. Adverse reserve development, line by line quotes both reports and reads them from the reserving side.
2025 prior-year reserve development: where the releases came from, and where they did not
| What the regulator reports | What it means for casualty treaties | |
|---|---|---|
| Whole P&C industry | One-year redundancy of $20.0 billion; the most favourable development in ten years (FIO). | Aggregate releases can mask strengthening in individual lines. |
| Personal lines | Together accounted for $15.9 billion of favourable development (NAIC). | Most of the release came from lines casualty treaties rarely cover. |
| Workers' compensation | Reserves "continued to develop favorably" (NAIC). | A long-standing exception among casualty lines. |
| Other liability, occurrence | Adverse development of $7,278 million in 2025, the most of any line in the NAIC's chart. | The line with the 122.3% reinsurance combined ratio is also where prior years kept getting worse. |
For a reinsurer, adverse development on the cedant's side arrives twice: once in the cedant's own triangles, which is where the next treaty's price starts, and once in the reinsurer's own reserves on the treaties already written. That is why the development factor a cedant selects is the largest single item in most casualty rebuilds. In the solution's sample program, factors selected from 2016–2019 against the cedant's own faster recent development accounted for 7.6 of a 13-point gap.
Is the reinsurance market softening?
Supervisors describe a softening market, and the only government price series confirms it for property; casualty is not the same story. The Prudential Regulation Authority told UK insurers in January 2026: "In the general insurance market, we observe a continuing softening underwriting cycle in many lines of business, which may place pressure on pricing, terms and conditions, and reserving levels. This trend appears particularly pronounced in some wholesale lines in the London Market, as illustrated by the recent reinsurance renewal seasons" (PRA, insurance supervision priorities 2026).
The only regulator-measured reinsurance price series: Florida property programs
+27.03%
average risk-adjusted change in reinsurance cost, 2022 to 2023
−1.70%
2023 to 2024
−0.46%
2024 to 2025
15–25%
risk-adjusted reductions for nearly half of insurers, preliminary 2026
Florida's regulator measures what most of the market only describes: "In 2025, industry experienced a -0.46% change in average risk-adjusted reinsurance costs from 2024. In 2024, companies reported the risk-adjusted change in reinsurance cost from 2023 decreased on average by -1.70%. From 2022 to 2023, the risk-adjusted change in reinsurance cost increased on average by 27.03%" (Florida OIR, January 2026). Those are property programs. Casualty has no comparable public series, and the casualty results above point the other way: losses still running ahead of premium in occurrence liability. A softening market in property and a still-loss-making one in casualty is exactly the condition in which a reinsurer's mix, and its selection inside each line, decide the year.
Selection, line by line: what the 2025 data asks of a casualty underwriter
The data asks for selection inside lines, because the line averages hide wide spreads between cedants. A 122.3% combined ratio on occurrence liability is an average of programs that made money and programs that lost a great deal; the reinsurer that can tell them apart before 1 January writes a better book than the line. That depends on seeing each cedant's loss ratio rebuilt from its own data rather than as its summary states it.
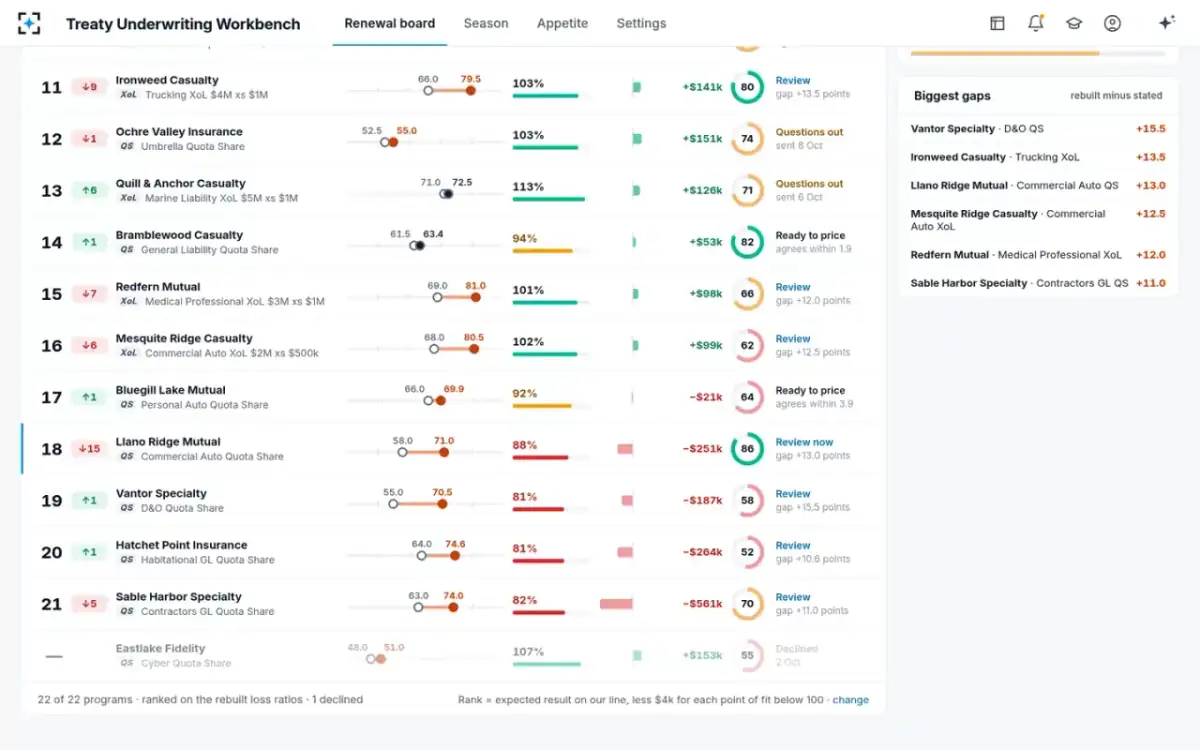
The sample season in the Treaty Underwriting Workbench shows what that looks like on one desk. As the cedants stated them, one underwriter's 22 programs expected +$4.70 million on the reinsurer's lines and none lost money. Ranked on the rebuild, seven moved five points or more, all upwards, and five lost money at the terms offered: a contractors general liability quota share, a habitational general liability quota share, a commercial auto quota share, a D&O quota share and a personal auto quota share. Four of the five were general liability, commercial auto or D&O business, the casualty lines the 2025 data shows under the most pressure.
Ranked on the rebuild: the casualty programs that lose money, and the biggest gaps
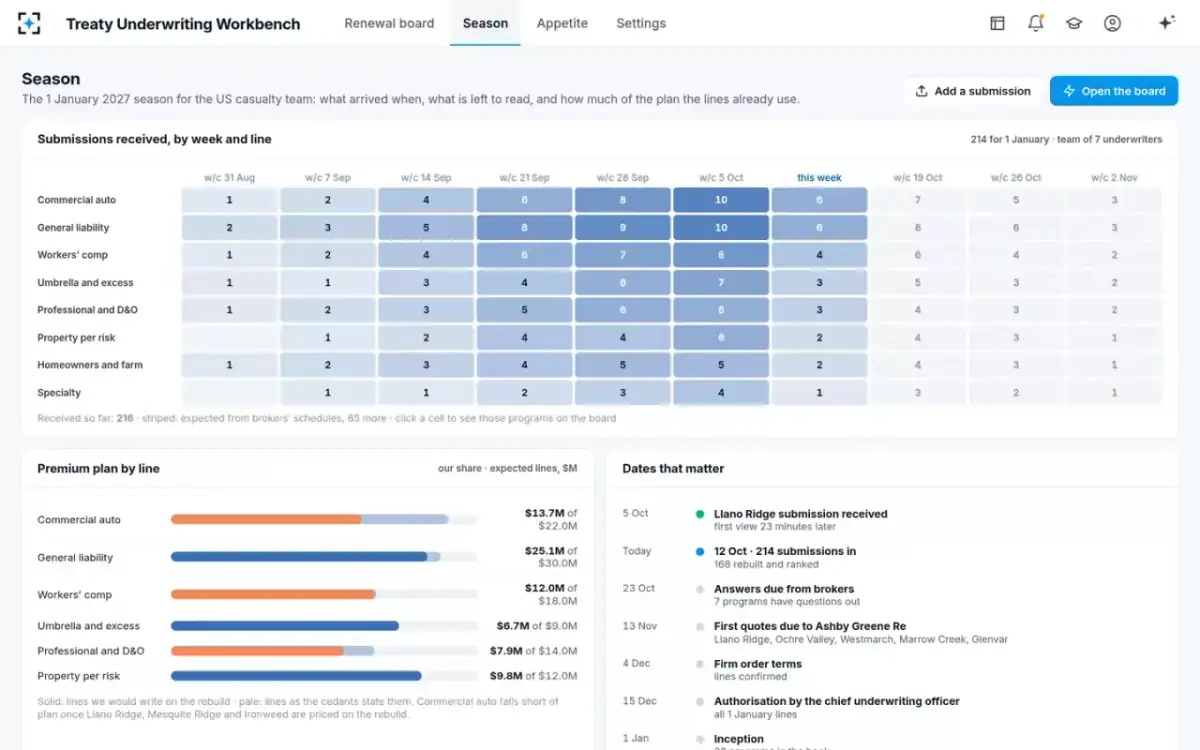
Selection also has a calendar. The sample season's submissions peaked in the weeks of 28 September and 5 October, with answers due from brokers on 23 October and first quotes on 13 November. A team that rebuilds only the programs it has time for in those weeks writes the rest at the market's average, which in occurrence liability was 122.3%. Why a cedant's figure and a reinsurer's differ, step by step, is set out in the as if loss ratio.
The season: arrivals by week and line, and how the premium plan looks on the rebuild
The global picture: a stable non-life reinsurance market
Supervisors' global data shows the same pattern of overall stability. The International Association of Insurance Supervisors reports gross reinsurance premiums "reaching $1.75 trillion by the end of 2024" across reporting jurisdictions, and a non-life reinsurance combined ratio steady at 95% in 2024, back from a 2022 peak that was the highest since 2005 (IAIS, Global Insurance Market Report 2025; the reinsurance market in 2026, from regulators' numbers sets these figures beside the renewals). A market can be stable in aggregate and still contain the losses described above; the averages are where the selection question begins, not where it ends.
To rank a casualty season on rebuilt loss ratios rather than stated ones, start from the Treaty Underwriting Workbench.
Questions people ask
What are professional reinsurers in NAIC data?
The NAIC defines them as "insurers in which reinsurance is their primary business, particularly through unaffiliated assumptions", and its 2025 report aggregates 21 of them, the same group for all five years shown. Together they wrote about 51.5% of the US industry's unaffiliated assumed premium.
Did reinsurers make money in 2025?
The NAIC's professional reinsurers did: net income of $5.1 billion, up 43%, the seventh consecutive year of net income, with a $1.0 billion underwriting gain after a $749 million loss in 2024. Investment gains contributed $5.6 billion, so the underwriting result was the smaller part of the profit.
What is the difference between occurrence and claims-made other liability?
An occurrence policy covers injuries or damage that happen during the policy period, whenever the claim is made; a claims-made policy covers claims first made during the period. Occurrence business carries a longer tail, which is one reason its reserves are harder to set; in 2025 the professional reinsurers' combined ratio was 122.3% on occurrence and 107.0% on claims-made.
What is APW in reinsurance?
APW is assumed premiums written: premium a company takes on as reinsurance, as opposed to premium it writes directly. In NAIC data, affiliated APW is reinsurance within an insurance group, such as pooling, and unaffiliated APW is reinsurance of other companies, the third-party market.
Is casualty reinsurance getting cheaper?
No regulator publishes a casualty reinsurance price series. Supervisors describe a softening cycle, measured in Florida property programs, while casualty results in 2025 still ran above 100% on other liability; any softening in casualty terms is happening on a book that was losing money.