An as if loss ratio is a cedant's historical loss ratio restated as if the treaty being priced, today's rate level and the current view of loss development had applied throughout the experience period: losses developed to ultimate with factors that fit the data, large losses counted the way the treaty counts them, and premium brought to the rates the cedant actually achieved. Cedants present one in every submission, and reinsurers rebuild their own; the two differ because each adjustment involves a choice. On the sample program used here, the cedant stated 58.0% and the rebuild from its own data reached 71.0%. Botminds' Treaty Underwriting Workbench builds the bridge between those two numbers, one cited correction at a time, so the difference can be argued with the broker on evidence rather than assertion.
The program is fictional sample data from the solution: Llano Ridge Mutual's commercial auto quota share, offered to Kestrel Point Re for 1 January 2027. The method is the Casualty Actuarial Society's, linked where it appears.
From the cedant's 58.0% to the rebuilt 71.0%, in three cited steps
What is an as if loss ratio? History restated to today's terms
An as if loss ratio answers one question: what would this cedant's past years have cost the treaty being priced, under that treaty's terms and today's rates? The phrase comes straight from the pricing method. Clark's study note for the Casualty Actuarial Society, describing the first step of pricing a proportional treaty, says that where the treaty's own history is not available, "the gross experience (i.e., prior to the reinsurance treaty) should be adjusted "as if" the surplus share terms had been in place, to produce the hypothetical treaty experience" (Clark, Basics of Reinsurance Pricing).
"As if" therefore covers more than one adjustment. It restates the losses to the treaty's terms (its limits, caps, inuring cover and ALAE treatment), restates premium to the rate level the treaty will see, and develops young years to their ultimate cost. A loss ratio that has had all three done is comparable across years and across programs. One that has had only some done, or has had them done with generous choices, is not, and the reader of a submission usually cannot tell which from the summary alone.
How do you calculate an as if loss ratio? Four adjustments
To calculate an as if loss ratio, adjust each experience year's losses and premium four ways, then divide the totals. The table sets out the four adjustments and the question each one asks of the cedant's data.
The four adjustments in an as if loss ratio, and where the cedant's choice and the reinsurer's can differ
| Adjustment | What it does | Where the choices differ |
|---|---|---|
| Develop losses to ultimate | Multiplies each year's reported losses by factors from the loss development triangle. | Which years the factors are selected from; volume-weighted or averaged; the tail. |
| Restate losses to the treaty's terms | Counts each loss as the treaty would: its limits, any per-loss cap, catastrophe and shock losses, ALAE, inuring cover. | Whether large losses are capped, removed or left as the treaty covers them, and whether anything is loaded back. |
| On-level premium | Brings each year's premium to the rate level expected in the treaty period. | Filed rate changes or achieved ones; how pending changes are treated. |
| Trend | Brings past losses and exposure to the cost level of the treaty period. | Which index, at what rate, and whether it differs for large losses. |
The sum is simple once the adjustments are done: total developed, restated losses over total on-level premium. On the sample program, the cedant's adjustments produced 58.0% over accident years 2019 to 2025, on-level and at ultimate. The rebuild made the same four adjustments with different choices, using only data in the same submission, and reached 71.0%. The rest of this guide takes the three steps that moved, one by one. The arithmetic of trend and layering is worked line by line in the burning cost method in reinsurance.
Development: old factors on a triangle that now develops faster
The largest single difference between a stated and a rebuilt loss ratio on a casualty program is usually development, because the youngest years carry the largest factors. Llano Ridge's summary developed each year with factors "selected from calendar years 2016–2019", which take a twelve-month year to ultimate at 1.78. Its own triangle, rebuilt from 16,412 claim rows and tied to its own tab in all 28 cells, gives 2.51 on the latest three years, volume-weighted. On the same premium, ultimate losses rise from $767.6 million to $868.7 million: 7.6 points.
Neither choice is wrong in principle. The cedant's narrative explains that its factors predate a 2020 claims system change, and that it strengthened case reserves in 2022, which speeds up measured development in later diagonals. The underwriter's question is which pattern the next treaty year will follow, and the answer has to come from the cedant: what factors does its own reserving now use? How to check a rebuilt triangle, and test the agent that builds it, is the subject of replaying a loss development triangle.
How do large losses change the loss ratio? Caps, shock losses and the treaty's terms
Large losses change a loss ratio as much as the treaty's terms say they should, and no more; the question is whether the summary used the treaty's terms. Pricing methods commonly set unusual losses aside so they do not distort the base: Clark's proportional steps exclude catastrophe and shock losses, then load the expected loss ratio for catastrophes. The danger is a summary that removes or caps large losses and adds nothing back.
Llano Ridge's summary counted every loss at no more than $1 million. The quota share follows original policies with limits up to $5 million and has no per-loss cap (slip, clause 4). The cedant's own large-loss listing held sixteen losses above $1 million, $59.68 million gross, $43.68 million of it above the cap; three were at the $5 million policy limit. Counting them as the treaty counts them added 3.3 points. A cap the treaty does not have is not a pricing choice; it is a different treaty.
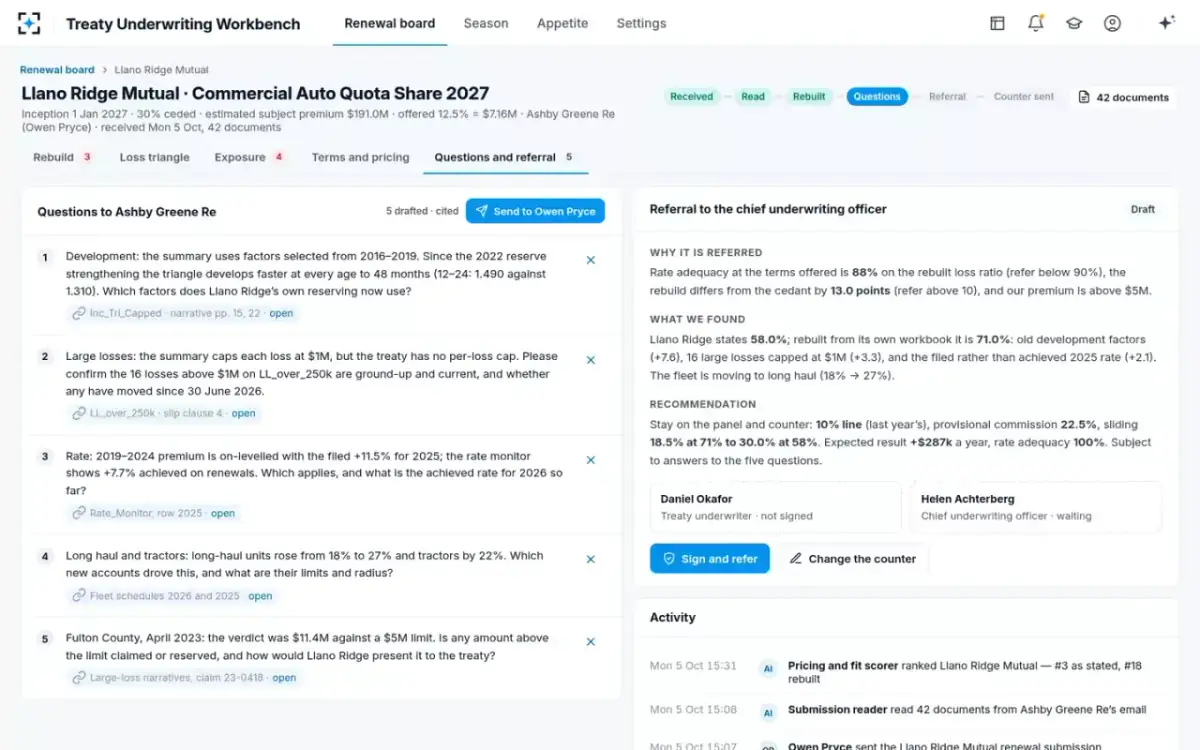
Questions to the broker: each correction on the bridge becomes a cited question
What is on-level premium? Filed against achieved
On-level premium is each year's premium restated at the rate level expected in the treaty period, so that a year written at lower rates is not made to look worse than it would be today. It is the denominator of every as if loss ratio, and a generous on-level makes every year look better at once. The usual inputs are the cedant's rate changes; the choice is whether to use the changes it filed or the changes it achieved on renewals.
Llano Ridge on-levelled 2019 to 2024 premium with the filed +11.5% for 2025; its own rate monitor, tab six of the workbook, showed +7.7% achieved. Using the achieved rate added 2.1 points. When the broker replied to the drafted question, the answer settled it: 7.7% was the achieved figure, the 11.5% filing having been approved in March 2025 and written from June. The rule in the solution's sample settings is to on-level with the achieved rate from the cedant's own rate monitor first, with the filed rate shown beside it.
Why do reinsurers restate the cedant's loss ratio?
Reinsurers restate it because the commission they pay turns on it, and the cedant chooses the adjustments. On a quota share with a sliding scale, the loss ratio sets the commission; Patrik's CAS chapter states the principle the terms are meant to serve: "The ceding commission should fairly reimburse the cedant's expenses, but should not put the cedant into a position significantly more advantageous than that of the reinsurer. Except in unusual circumstances, the cedant should not make a significant profit while the reinsurer is losing money, and vice versa" (Patrik, Foundations of Casualty Actuarial Science, ch. 7).
Of the 13-point gap, the slide gives back 5.3; the reinsurer keeps 7.7
58.0% to 71.0%: who bears the 13.0 points
- Lower commission on the slide · 41%
- The reinsurer's result · 59%
The split shows why the number matters to both sides. A slide shares part of any deterioration with the cedant, but only down to its floor; beyond that, every point is the reinsurer's. At the cedant's 58.0% the terms looked balanced. At the rebuilt 71.0% the cedant still received the floor commission while the reinsurer lost money, the outcome Patrik's principle says the terms should avoid. That is why the sample counter moved the slide rather than only the line: 22.5% provisional, sliding 18.5% at 71% to 30% at 58%, so the commission is fair at either loss ratio.
What does follow the fortunes mean for pricing?
In pricing, follow the fortunes is a principle, not a forecast: a reinsurer shares the cedant's fortunes on the business ceded, but its results can differ widely from the cedant's own. Clark puts it directly: "In theory, a reinsurer should "follow the fortunes" of the ceding company, but in practice their results may be quite different. Reinsuring a profitable insurer is no guarantee of profits for the reinsurer."
The reasons are the ones on the bridge. The reinsurer takes a share of a particular book, on particular terms, with a commission that may not move with results beyond its floor or ceiling; the cedant's company-wide figures include business, investment income and expense ratios the treaty never sees. Clark draws the practical consequence: "There will often remain disagreement between the ceding company and reinsurer about the loss ratio and the appropriate ceding commission," and "In the negotiations to resolve these differences, adjustable features are often built into the treaty." The as if loss ratio is where that negotiation starts.
Two as if loss ratios from one submission: the same data, different choices
The cedant's summary: 58.0%: Factors selected from calendar years 2016–2019; 12 to ultimate 1.78.
The rebuild from its own data: 71.0%: Latest three years of its own triangle, volume-weighted; 12 to ultimate 2.51; benchmark used only for the tail.
The cedant's summary: 58.0%: Each loss capped at $1 million.
The rebuild from its own data: 71.0%: Sixteen losses above $1 million counted to the treaty's terms: policy limits up to $5 million, no per-loss cap.
The cedant's summary: 58.0%: On-levelled with the filed +11.5% for 2025.
The rebuild from its own data: 71.0%: On-levelled with the +7.7% achieved, from the cedant's own rate monitor.
The cedant's summary: 58.0%: Narrative page 14.
The rebuild from its own data: 71.0%: Each step cited to the workbook tab, cell, slip clause or narrative page.
Taking the bridge to the broker
A broker accepts a restated loss ratio when every step can be traced to the cedant's own documents, because then the argument is about choices, not about whose spreadsheet is right. In the sample, the three steps of the bridge became the first three of five questions to the broker, each tied to its source: the triangle tab and narrative pages 15 and 22 for development, the large-loss tab and slip clause 4 for the caps, and the rate monitor's 2025 row for the on-level. The broker answered the rate question with the cedant's own figure.
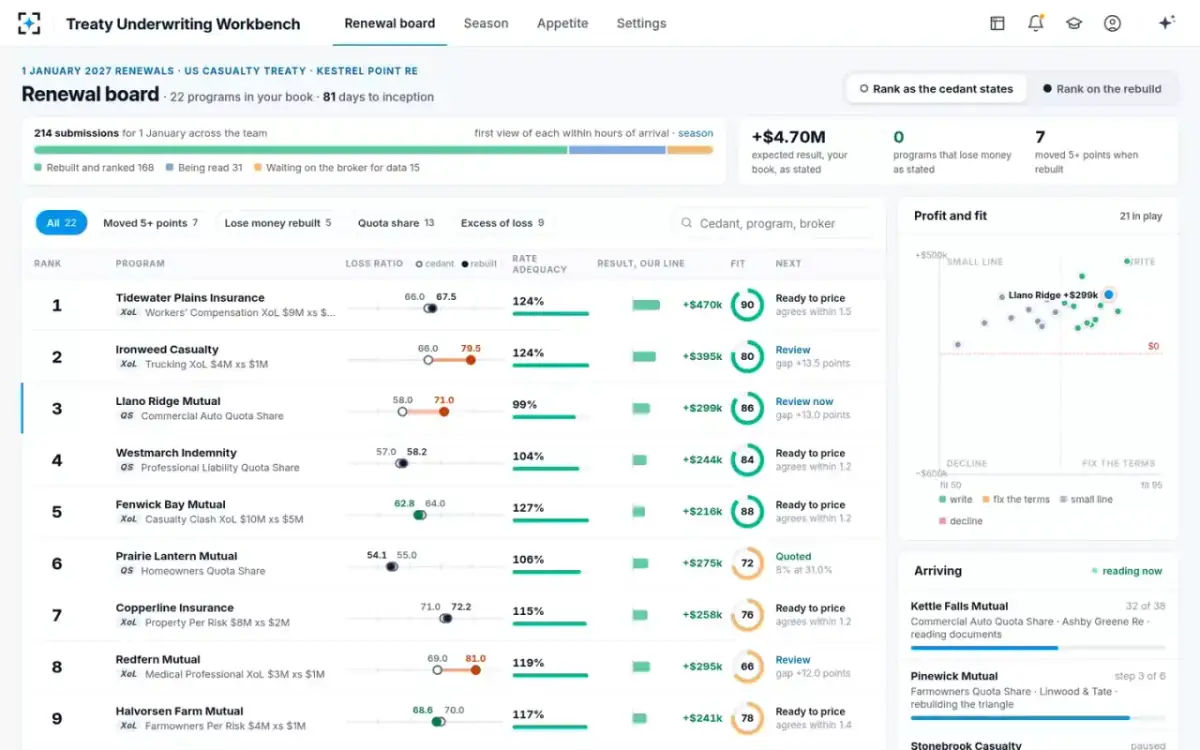
The bridge also travels inside the reinsurer. The referral note to the chief underwriting officer repeated it in one sentence, "old development factors (+7.6), 16 large losses capped at $1M (+3.3), and the filed rather than achieved 2025 rate (+2.1)", with the recommendation beneath. And on the renewal board the same two numbers sit side by side for every program in the season, so an underwriter can rank on either; on the sample book, switching to the rebuilt figures moved seven programs by five points or more.
Every program, stated and rebuilt: a hollow dot for the cedant's loss ratio, a filled one for the rebuild
To see stated and rebuilt loss ratios side by side on your own submissions, start from the Treaty Underwriting Workbench.
Questions people ask
Can an as if loss ratio be lower than the cedant's stated one?
Yes. A rebuild can come out lower when the cedant's factors are slower than its own data, when it achieved more rate than it filed, or when its summary includes losses the treaty would not cover, such as amounts above policy limits that the treaty excludes. On the sample season most programs' rebuilt figures sat within a few points of the stated ones.
Is an as if loss ratio the same as a burning cost?
They use the same adjustments for different treaties. An as if loss ratio restates a whole book's losses and premium, the basis for a quota share's commission; a burning cost restates only the losses that fall in an excess layer, as a share of subject premium, to price that layer.
How many years should an as if loss ratio cover?
Enough for credibility and recent enough to reflect the book being reinsured. Clark's proportional example uses six years and Patrik's five to ten policy years plus individual large claims; the sample program supplied seven accident years, 2019 to 2025.
What is the difference between filed and achieved rate?
A filed rate change is what the cedant asked its regulator to approve; the achieved rate is what it actually obtained on renewals, after the filing took effect and after schedule credits. On the sample program the filing was +11.5% and the achieved rate +7.7%; the broker's answer explained part of the gap: the filing was approved in March 2025 and written only from June.
Why does the cedant's loss ratio look better than the reinsurer's so often?
Because each adjustment is a choice, and the cedant makes them for its own summary: older development factors, large losses capped, filed rather than achieved rates. Each can be defended on its own; together, on the sample program, they were worth 13 points. That is why a reinsurer rebuilds rather than accepts the summary.