A loss development triangle is a table of a cedant's losses with accident years down the side and ages across the top, so each row shows how one year's incurred or paid losses grew as claims were reported and settled; the ratios between columns, called age-to-age or loss development factors, project the younger years to their ultimate cost. In casualty reinsurance the triangle drives the price more than any other input, because the latest years are the least developed and the factors applied to them are the largest. Botminds' Treaty Underwriting Workbench rebuilds paid and incurred triangles from the cedant's own claim rows and ties them to the cedant's triangles cell by cell. The fairest way to decide whether to trust that work is to replay last year's programs, the ones your team already priced by hand, and score the agent against your own files.
The examples come from the solution's fictional sample season: a commercial auto quota share submitted by Llano Ridge Mutual to Kestrel Point Re for 1 January 2027. The methods come from the Casualty Actuarial Society's own study notes and textbook, linked where they appear.
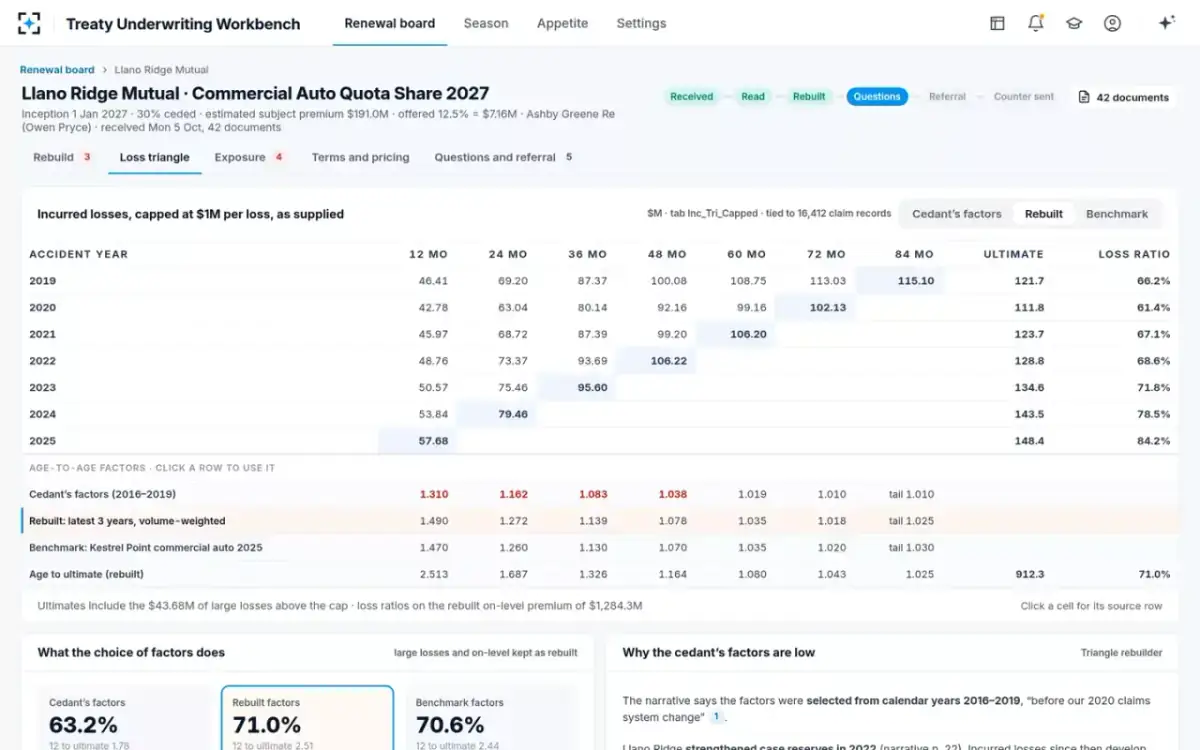
A loss development triangle: seven accident years, incurred losses capped at $1 million, $ millions
What is a loss development triangle? Accident years down, ages across
Each row of a loss development triangle is one accident year; each column is an age, the number of months since the start of that year; each cell is the cumulative loss at that age. Read along a row and you see one year maturing: Llano Ridge's 2019 accident year stood at $46.41 million of incurred loss after twelve months and $115.10 million after 84. Read down a column and you compare years at the same age: at twelve months the years run from $42.78 million (2020) to $57.68 million (2025).
The triangle's shape is the point. The oldest year has seven evaluations, the newest has one, and the price of next year's treaty depends on guessing how the young years will finish. Patrik's chapter in the CAS textbook says what a reinsurance pricer wants from the cedant: "some history of claims values (an historical policy year/development year triangle)" (Patrik, Foundations of Casualty Actuarial Science, ch. 7). A triangle can be built on incurred losses (paid plus case reserves) or on paid losses alone; the incurred triangle reaches its final value sooner, the paid one is free of reserving habits, and a careful pricer looks at both.
How do you build a loss development triangle from claim records?
You build a triangle by summing every claim's value, at each evaluation date, into the cell for its accident year and age. That needs claim-level data with an accident date and a history of values, not just today's: a claim reported in 2023 for a 2021 accident adds nothing to 2021's twelve- and 24-month cells, and its value at each later evaluation to the cells from 36 months on. Capping matters too. Llano Ridge's tab is "capped at $1M per loss", so every claim above $1 million enters the triangle at $1 million; the excess has to be handled separately, which is where large losses re-enter the rebuild.
The test of a rebuilt triangle is that it ties. In the sample, the solution rebuilt incurred and paid triangles from 16,412 claim rows and matched the cedant's own capped triangle within $0.01 million in all 28 cells. A tie-out like that proves two things at once: that the agent read the claim data correctly, and that the cedant's triangle is what its claim data says. When a cell does not tie, either the claim file and the summary tab disagree, which is a question for the broker, or the rebuild is wrong, which is a question for the vendor.
What is a loss development factor, and what is the chain ladder method?
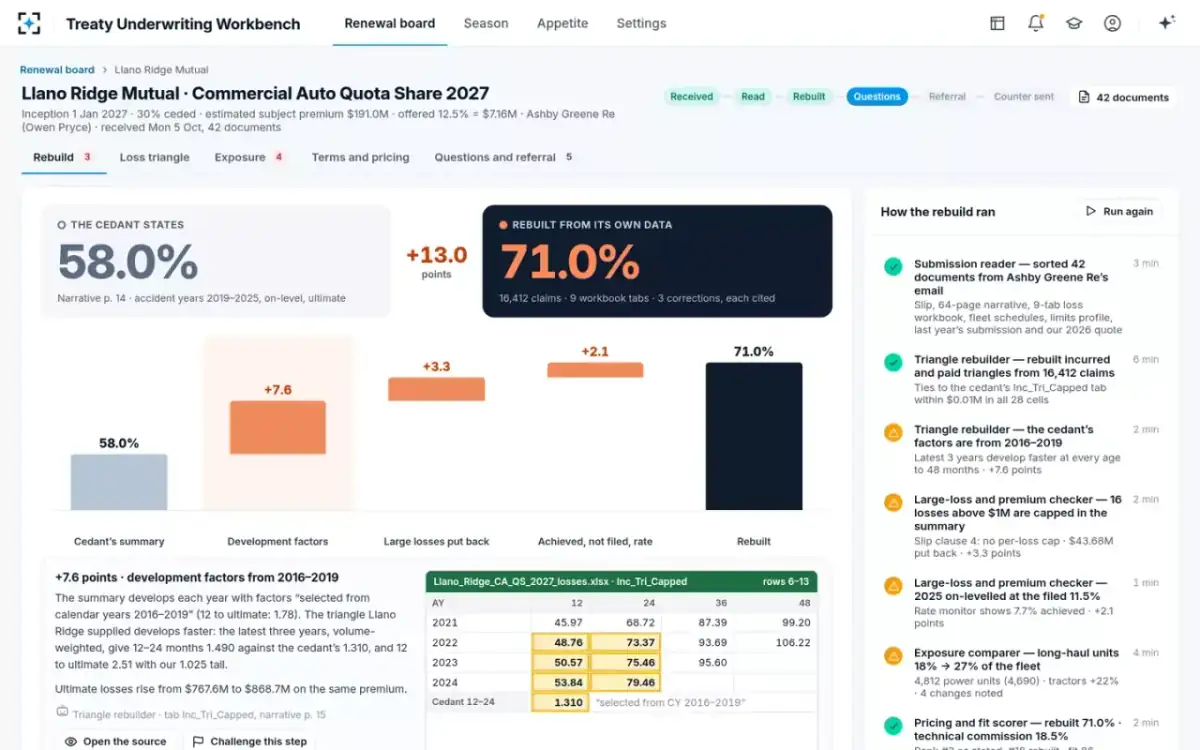
A loss development factor is the ratio of a year's losses at one age to the same year's losses at the age before; the chain ladder method multiplies those factors together to take each year from its latest age to ultimate. The volume-weighted 12-to-24-month factor over Llano Ridge's latest three years is the sum of their 24-month values over the sum of their 12-month values: (73.37 + 75.46 + 79.46) ÷ (48.76 + 50.57 + 53.84) = 1.490. The cedant's narrative used 1.310 for the same step, "selected from calendar years 2016–2019".
Three sets of factors, one triangle: the cedant's take a 12-month year to ultimate at 1.78, the rebuild at 2.51
The factor that matters is the cumulative one. A 2025 year evaluated at twelve months is multiplied by every factor to the right of it: 1.78 on the cedant's choice, 2.51 on the rebuild. On the same premium, Llano Ridge's ultimate losses move from $767.6 million to $868.7 million on that choice alone, worth 7.6 points of loss ratio. Every year of the triangle develops faster than the cedant's factors say: the 2019, 2020 and 2021 years, whose first step is fully observed, went from twelve to twenty-four months at 1.491, 1.474 and 1.495.
Why excess and casualty triangles are hard to trust
Casualty triangles develop for years, and excess layers develop later and more erratically than the business beneath them. Patrik warns that "excess claims development is almost always extremely chaotic", and that with the chain ladder method on long-tailed lines "the reported, very random nose wags the extremely large tail estimate for recent, immature years". A small change in an early cell, multiplied by a cumulative factor of two or more, moves the youngest year's ultimate a long way.
Clark's CAS study note on reinsurance pricing adds the benchmark problem. For excess development, where a cedant's own data is too thin, the Reinsurance Association of America's biennial study "is considered an industry benchmark", but "the user should remember that the data is simply what is reported by its members", and its mix of attachment points is not cleanly broken out (Clark, Basics of Reinsurance Pricing, CAS study note). Very slow patterns, he notes, often give either zero or very high projected layer losses, so the actuary turns to smoothing methods such as Bornhuetter-Ferguson or Cape Cod.
The profession says plainly that this is unsolved. The first question in the CAS Reinsurance Working Group's 2026 call for papers is "How should we select loss development factors (LDFs) in the absence of credible data, especially for excess of loss layers?" (CAS, 2026 Reinsurance Call Paper Program). With no standard to test an agent against, the only fair standard is your own team's past judgment on the same submissions.
The replay test: rebuild last year's closed programs and compare
The replay test runs last renewal's submissions, exactly as the brokers sent them, through the agents and compares every output with the file your team built at the time. It is fair because the inputs are real and the answers are known: your analysts rebuilt those programs, your actuaries selected those factors, your underwriters priced them. It is cheap because the data already sits in your submission archive. And it tests the thing that matters, the agent's work on your kind of submission, not a vendor's showcase.
How to run a triangle replay on last renewal's programs
- Pick 20 to 30 programs you priced fully by hand last renewal
Mix quota share and excess of loss, three or more lines, several brokers, and at least five programs whose data you remember as messy.
- Feed the submissions exactly as received
The broker's email and every attachment, not a cleaned copy. Cleaning the inputs tests your analysts, not the agent.
- Set the house method before the run, not after
Factor selection (say, latest three years volume-weighted), the benchmark used for the tail, and the rate used for on-level, written down and fixed.
- Score the tie-out first
Every rebuilt cell against the cedant's own triangle, within a stated tolerance. A cell that does not tie is either a cedant inconsistency or an agent error, and you need to know which.
- Compare factors with the ones your team selected
Age-to-age and cumulative, by program. Where they differ, read why: the method, a data issue, or a judgment your actuary made that the setting does not capture.
- Compare the rebuilt loss ratio with your file's
Count programs within one point, within three, and beyond five. The ones beyond five are the test.
- Open every citation on the disagreements
Each rebuilt figure should open the tab, cell or page it came from. A figure you cannot trace is a failed figure, however close it is.
- Count the questions it asked instead of guessing
Missing data should become a broker question, never an assumption. Check that the agent flagged what your analyst had to chase last year.
Run the scoring before anyone looks at the ranking. A pilot that starts with the board tends to argue about which programs should be at the top; one that starts with the tie-out establishes whether the numbers underneath can be trusted at all. The full pilot design, from the sample of programs to the scorecard and the stop rules, is in piloting a reinsurance underwriting platform on last 1/1's submissions.
What to compare: your file and the agent's rebuild, side by side
Compare the parts, not just the answer. Two rebuilds can reach the same loss ratio by different routes, one right and one lucky, and only the parts show which. The table below is the comparison to make for each replayed program.
Score the parts of the rebuild, not only the loss ratio it ends at
Your team's file from last renewal: Copied from the cedant's tab, or rebuilt from claim rows where the analyst had time.
The agent's rebuild of the same submission: Rebuilt from claim rows and tied to the cedant's tab cell by cell; any cell outside tolerance flagged.
Your team's file from last renewal: Selected by the analyst or actuary; the reasoning is often in an email, not the file.
The agent's rebuild of the same submission: Selected by the house setting, shown beside the cedant's and the benchmark's, each with its source.
Your team's file from last renewal: Taken from the summary, capped or not as the cedant presented them.
The agent's rebuild of the same submission: Read against the slip: losses the treaty covers that the summary capped are put back and listed.
Your team's file from last renewal: On-levelled with whichever rate the narrative quoted.
The agent's rebuild of the same submission: On-levelled with the achieved rate from the cedant's rate monitor; the filed rate shown beside it.
Your team's file from last renewal: One number in the pricing sheet.
The agent's rebuild of the same submission: A bridge from the cedant's figure, each step a correction with its evidence.
Your team's file from last renewal: In the analyst's inbox.
The agent's rebuild of the same submission: Drafted, each tied to the tab, cell or page it rests on.
The triangle screen: three sets of factors on one triangle, and what each does to the loss ratio
How do reinsurers check a cedant's triangles?
Reinsurers check a cedant's triangle by rebuilding it, by asking where its factors came from, and by reading the narrative for anything that changed the way claims were counted. The sample program shows all three. The rebuild tied, so the data was consistent. The factors did not match the data: the narrative said they were selected from calendar years 2016–2019, "before our 2020 claims system change", while every year in the seven-year triangle developed faster than that. And the narrative itself explained part of why: Llano Ridge strengthened its case reserves in 2022, which raises incurred losses in later diagonals and speeds measured development.
Each of those findings leads to a different question. A claims system change can move when claims are recorded, so factors from before it may be the wrong base. A reserve strengthening can make recent development look faster than the long-run pattern, so factors from after it may overstate the tail. Neither answer is in the triangle. Both are in the question the underwriter sends: "Which factors does Llano Ridge's own reserving now use?" was the first of the five drafted for the sample broker, cited to the triangle tab and to narrative pages 15 and 22.
What if the cedant's data is thin?
When the cedant's own triangle cannot support a factor, the pricer borrows one and says so. Clark's study note says that if the treaty's own experience "is insufficient to estimate loss development factors, data from other sources may need to be used", with adjustments for the reinsurer's reporting lag. That is a legitimate choice, and also the easiest place for a rebuild to hide a judgment.
The rule in the solution is narrow: outside data is used only for the tail, and it is labelled. On Llano Ridge the tail beyond 84 months came from the reinsurer's own commercial auto benchmark, 1.025 on the rebuild against the cedant's 1.010; every earlier factor came from the cedant's own triangle. A replay should check that rule on the thin programs specifically. Where a program has three years of data and a benchmark supplies most of the development, the rebuilt loss ratio is the benchmark's answer, and the screen should say so.
Reading the results: when the agent is wrong, and when your file is
A replay disagreement has three possible causes, and the citations tell you which. Either the agent misread the data, and the source cell shows it; or the setting does not capture a judgment your actuary made, and the file's notes show that; or your file was wrong last year, and the claim data shows that. The third case is common enough to plan for: last year's files were built under the same deadline pressure the agents are meant to relieve.
A rising run of loss ratios is a warning about the factors, not only about the business
Clark gives the check to apply. The projected loss costs "should be randomly distributed about the average"; if they rise or fall steadily from the earliest to the latest years, "then the assumptions of the model may need to be reexamined. The trend or development factors may be too high or low." The sample rebuild fails that check mildly: the two youngest years run well above the rest. That may be real, given the fleet's move to long-haul trucking, or it may be faster factors over-projecting immature years, the nose wagging the tail. A good rebuild does not settle that. It puts the pattern in front of the actuary, with the factors beside it, before the quote goes out. The same rebuild feeds the as if loss ratio that goes to the broker.
Stated against rebuilt: the development step is the largest of three, and each is cited
To replay last renewal's programs on your own archive, start from the Treaty Underwriting Workbench.
Questions people ask
What is the difference between a paid and an incurred loss triangle?
A paid triangle sums only what has been paid on each accident year at each age; an incurred triangle adds the case reserves set on open claims. Incurred values approach ultimate sooner but move with reserving practice, as when a cedant strengthens its reserves; paid values are free of that but develop for longer, so pricers usually look at both.
What is a tail factor?
It is the factor that takes the oldest age in the triangle to ultimate, for development that continues beyond the data. On the sample program the cedant used 1.010 beyond 84 months, the rebuild 1.025 and the house benchmark 1.030; because every younger year is multiplied by it too, a small tail difference moves the whole loss ratio.
Why use volume-weighted factors rather than a simple average?
A volume-weighted factor divides the sum of losses at the later age by the sum at the earlier age, so large years count for more; a simple average gives each year's ratio equal weight, so a small, erratic year counts as much as a large one. Which to use, and over how many years, is a house choice the replay should fix before it runs.
How many years of data does a casualty triangle need?
Clark's study note suggests gathering experience for as many years as possible, and about ten for per-risk excess pricing, balancing credibility against responsiveness. The sample program supplied seven accident years of claim-level data; with fewer, more of the development has to be borrowed from a benchmark, and the rebuild should say how much.
Can I build a loss development triangle in Excel?
Yes: a pivot of claim values by accident year and evaluation age is enough for a basic triangle, and age-to-age factors are simple ratios of its columns. The difficulty is not the arithmetic but keeping each value traceable to its claim row and each factor choice written down, which is what a replay checks.