A reinsurance pricing tool turns a treaty's inputs into a technical price: an expected loss ratio or loss cost, the ceding commission and its slide, brokerage, the reinsurer's expenses and target return, and, for loss-sensitive terms, a distribution of possible outcomes. Price one commercial auto quota share three ways, in a spreadsheet, in a dedicated pricing tool and in an agent workbench, and the formula in the middle is nearly the same in all three. The differences are at the edges: who turns the broker's workbook into the inputs, whether every input can be traced to the page it came from, and how well each handles a sliding scale. Botminds' Treaty Underwriting Workbench is the third kind: agents rebuild the inputs from the cedant's own data and work out the commission, expected result and rate adequacy on both the cedant's loss ratio and the rebuilt one, and the pricing team keeps its own models for the rest.
The treaty used throughout is fictional sample data from the solution: Llano Ridge Mutual's commercial auto quota share for 1 January 2027, offered to Kestrel Point Re at a 12.5% line. The methods come from the Casualty Actuarial Society's study note and textbook, linked where they appear.
One quota share, three ways: where the work and the evidence sit
| Step | Spreadsheet | Pricing tool | Agent workbench |
|---|---|---|---|
| Read the submission | Analyst opens 42 documents and copies what the template needs. | Analyst prepares the data in the tool's import format. | Agents sort and read every document; each value cited to file, tab and cell. |
| Triangles and development | Pasted from the cedant's tab or rebuilt by hand; factors typed in. | Loaded and developed with the tool's methods; inputs as prepared. | Rebuilt from 16,412 claim rows, tied to the cedant's triangle, factors by house setting. |
| Large losses and on-level | As the cedant presented them unless someone checks the slip. | As loaded. | Read against the slip: capped losses put back, achieved rate used before filed. |
| Price formula | Cells the pricer built; may hide loadings in one factor. | Documented, tested, consistent across programs. | Commission on the slide, expected result, rate adequacy and technical commission on both loss ratios. |
| Loss-sensitive terms | Point estimate unless the pricer builds a distribution. | Aggregate distributions and simulation: the tool's strength. | Point estimates on each loss ratio; the distribution stays with the actuary's model. |
| Audit trail | Versions of a file. | Model runs and parameters. | Every figure opens its source; settings and decisions versioned. |
What is a reinsurance pricing tool? The model, and the inputs it is fed
A reinsurance pricing tool is the model that turns an expected loss into a premium, plus the machinery to estimate that expected loss. Patrik's chapter in the CAS textbook writes the core as one formula: the reinsurance premium equals the present value of the expected loss cost divided by (1 − ceding commission − brokerage) × (1 − internal expense loading) × (1 − target economic return) (Patrik, Foundations of Casualty Actuarial Science, ch. 7). In his worked example a $100,000 expected loss cost, a 25% commission, 5% brokerage, a 10% expense loading and a 20% target return give a premium of $198,413.
Patrik's footnote on that formula is the best argument for writing pricing down explicitly. "Formulas traditionally used by reinsurance underwriters have more often been of the form: undiscounted loss estimate divided by a judgmental loading factor such as 0.85," he writes, and the problem "is that all the information about the expenses, discounting and profit loading are buried in one impenetrable number." Every serious pricing tool, and every well-built spreadsheet, exists to unbury that number. The expected loss in the numerator is where the three approaches really differ.
Technical commission on a quota share: what the terms can afford at a given loss ratio
Premium
100
Ceded premium, as a percentage.
The base
Expected losses
− 71.0
The rebuilt loss ratio on the sample program; the cedant states 58.0.
The rebuild
Brokerage and expenses
− 2.5 − 3.0
Brokerage on the slip and the reinsurer's own expense load.
Slip and house setting
Target margin
− 5.0
The return the reinsurer requires; at this margin rate adequacy is 100%.
CUO's setting
Do reinsurers still price in Excel?
Spreadsheets remain part of the profession's own toolkit, and no public survey says how many reinsurers rely on them. The CAS's 2026 call for papers on standardising reinsurance pricing asks for exactly that: "Model templates: A practical Excel or R-based model for reinsurance pricing would be valuable" (CAS, 2026 Reinsurance Call Paper Program). Clark's study note, too, picks the lognormal for aggregate modelling partly because "most spreadsheet software applications allow it to be programmed directly" (Clark, Basics of Reinsurance Pricing).
The spreadsheet's weakness is not the arithmetic. It is that the inputs arrive by copy and paste from a broker's workbook, so the cedant's caps, factors and rate assumptions come in with them unless someone checks; and that a pricing sheet records a number, not where it came from. A well-built sheet with a careful analyst is as good as any tool on one program. Across two hundred programs in six weeks, the copying is what gives way.
What does a reinsurance pricing model include?
A complete model for a proportional treaty includes an expected loss ratio, built from trended, developed and on-levelled experience with a catastrophe load; the ceding commission terms, including any slide, profit commission or loss corridor; brokerage; the reinsurer's expenses; and a target return. For excess treaties it adds exposure rating from the cedant's limits profile and a credibility weighting between the two. For anything that varies with losses it adds an aggregate loss distribution.
Clark makes the last point bluntly. His worked property quota share reaches a 65% expected loss ratio and tests a suggested 30% commission with 5% brokerage and 2% of expenses: a 102% combined ratio, "unlikely to produce an acceptable return". But the expected loss ratio is not where the work ends: "This should serve to illustrate that the actuary's job is not finished after the expected loss ratio is calculated." The features that move with experience have to be valued across the range of outcomes, not at the average.
How do pricing tools handle sliding scales?
A good pricing tool values a sliding scale across a distribution of loss ratios, because the commission at the expected loss ratio is not the expected commission. Clark's example slide pays a 30% provisional commission, a 25% minimum at a 65% loss ratio, sliding 1:1 to 35% at 55% and 0.5:1 to a 45% maximum at 35%.
Clark's sliding scale: the commission paid at each loss ratio
At an expected loss ratio of 65% the slide reads 25%, a technical ratio of 90%. Weighted across a distribution of outcomes, Clark's expected commission is 31.0% and the technical ratio 96%, because every outcome better than 65% pays more commission while every outcome worse pays the floor. Carryforward provisions complicate it further, and Clark says candidly that he knows of no standard method for handling them, least of all when a deficit carries forward but a credit does not (sliding scale commission and carryforward, explained).
The same slide, priced at the average and across the outcomes
25%
commission read off the slide at the 65% expected loss ratio
31.0%
expected commission across Clark's distribution of outcomes
90%
technical ratio on the naive reading
96%
technical ratio once the distribution is used
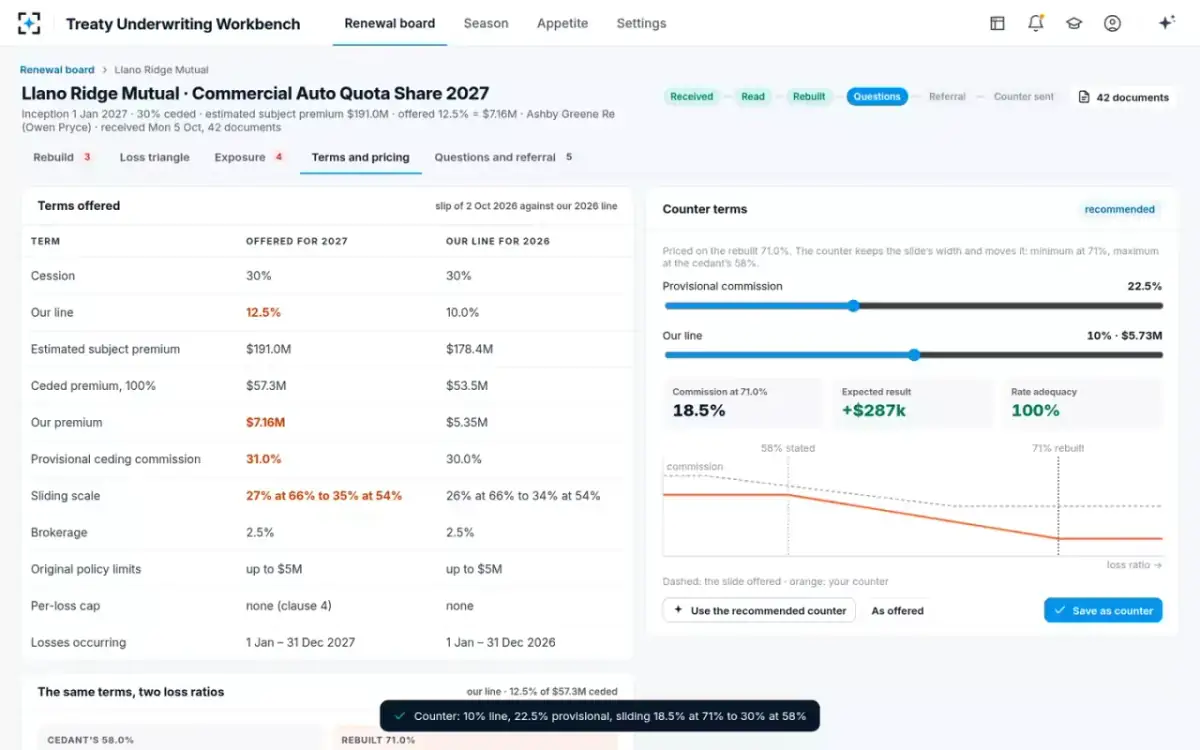
This is where the honest comparison favours the pricing tool. The Treaty Underwriting Workbench computes the commission on the slide at the cedant's loss ratio and at the rebuilt one: on Llano Ridge, 32.3% at 58.0% and the 27% floor at 71.0%. Those are point estimates. Because the slide pays more for every outcome better than 66%, the expected commission at a 71% expected loss ratio is above the 27% floor, so the true expected result on the offered line is somewhat worse than the −$251,000 the point estimate shows. A pricing actuary with an aggregate model should price the counter's slide; the workbench gives that model a rebuilt expected loss ratio to start from.
What is technical rate adequacy?
Technical rate adequacy compares what the terms leave for losses with the losses expected; at 100% the terms earn exactly the target margin. On the sample program, the offered terms at the rebuilt 71.0% leave 100 − 27 commission − 2.5 brokerage − 3.0 expenses − 5.0 margin = 62.5 points for losses: 88% adequacy. The recommended counter, a 22.5% provisional commission sliding 18.5% at 71% to 30% at 58% on a 10% line, leaves 71 points: 100%, an expected +$287,000 a year.
Adequacy is only as good as its denominator. The same terms on the cedant's stated 58.0% show 99% adequacy and a +$299,000 result. A tool that computes adequacy faultlessly on the cedant's loss ratio has answered the wrong question precisely. That is the case for putting the rebuild in front of the pricing, whichever tool does the pricing, and it is worked through program by program in what one casualty program costs to rebuild by hand.
Terms and pricing: the slide offered, last year's line, and a counter priced on the rebuild
Can AI price a reinsurance treaty?
AI agents can do the arithmetic of a price on rebuilt inputs; they should not choose the price. In the solution the pricing and fit scorer works out commission on the slide, combined ratio, expected result on the reinsurer's line, rate adequacy and the technical commission on both loss ratios, and recommends a counter. It never quotes, binds or sends. The loss picks, the development benchmark, the target margin and the line are people's choices, set as versioned settings or made by the underwriter on the program.
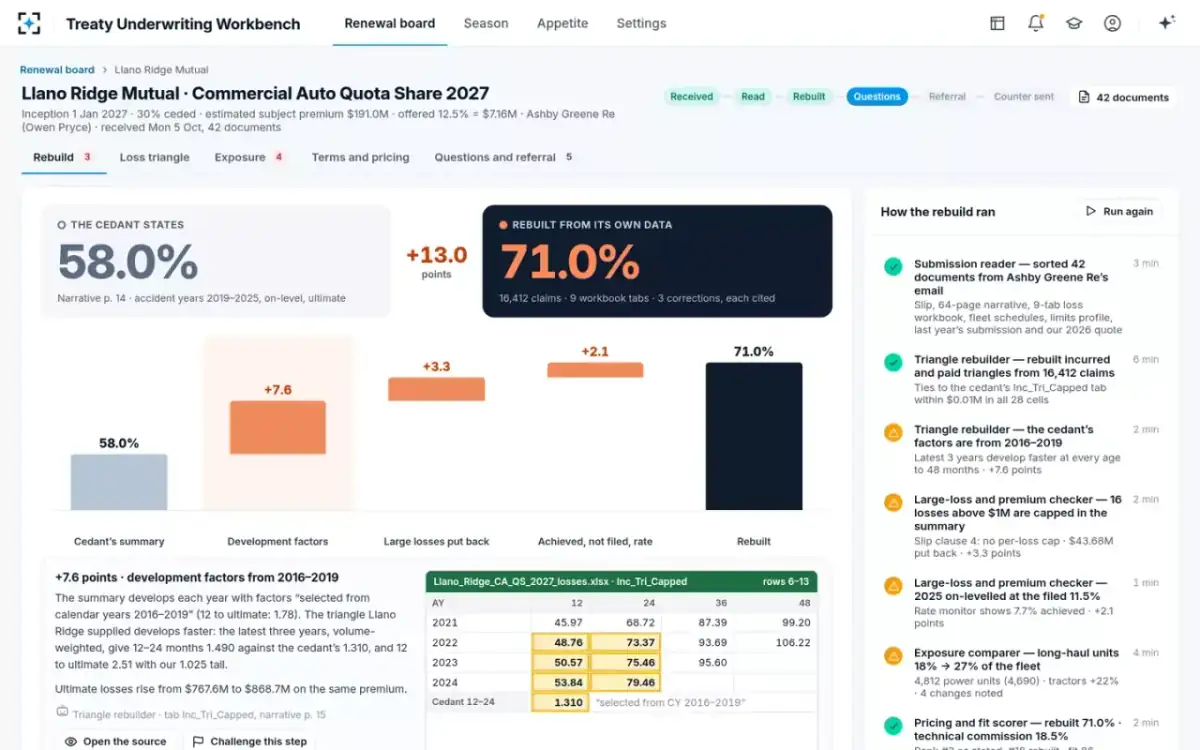
Clark's warning about aggregate models applies with more force to agents: "The complexity of the calculations can lead to a "black box" mentality - assuming the numbers must be right because of the accuracy of the computer." The defence he prescribes is checking results against the data and against more than one method. For an agent, the practical defence is the citation: each figure on the bridge from the cedant's 58.0% to the rebuilt 71.0% opens the tab, cell or page it came from, and the cedant's own figure stays beside it. What supervisors expect when AI supports underwriting decisions is set out in the use of AI in reinsurance underwriting.
The rebuild behind the price: three corrections from the cedant's 58.0% to 71.0%, each cited
What to look for in a reinsurance pricing tool, whichever kind you buy
Look first at what happens before the formula, then at the formula. Seven checks cover both.
Seven checks for any reinsurance pricing tool
- Can every input be traced to the submission?
A loss ratio that cannot be opened to its tab, cell or page cannot be defended to a broker or an auditor.
- Does the cedant's figure stay beside yours?
The argument with the broker is about the difference; the tool should show both, unaltered.
- Are loadings explicit?
Commission, brokerage, expenses and return as separate terms, not one judgmental factor.
- How are loss-sensitive features valued?
Slides, profit commissions and corridors need an aggregate distribution, not the commission at the mean.
- Who sets the method, and is it recorded?
Benchmarks, factor selection, on-level rules and margins should be versioned settings with an approver.
- What happens with missing data?
A gap should become a question to the broker, never a silent default.
- How does it hand off?
Rebuilt tables and expected loss ratios should move into your actuarial model with their sources intact.
Which approach fits which pricing desk?
The three approaches fit different bottlenecks, and many desks will want two of them. A spreadsheet fits a small book of programs a team knows well, priced by people who built the sheet and check every input. A dedicated pricing tool fits where the bottleneck is actuarial depth: loss-sensitive features, layered programs, exposure curves and aggregate distributions across a large book. An agent workbench fits where the bottleneck is volume and variety: hundreds of submissions in brokers' own layouts, arriving in six weeks, each needing a rebuild before anyone can judge it.
The combination most casualty desks need is the last two together: agents to read and rebuild every submission and rank the season, the actuary's model to price the loss-sensitive terms on the programs worth writing. The way to find out whether that combination works on your book is to run last renewal through it; a pilot on last 1/1's submissions sets out the design. To see the rebuild and pricing on a program of your own, start from the Treaty Underwriting Workbench.
Questions people ask
What is the difference between reinsurance pricing software and an underwriting platform?
Pricing software turns inputs into a technical price and values loss-sensitive terms; an underwriting platform covers the work around it, from reading submissions and rebuilding the cedant's figures to ranking the season and recording decisions. Many reinsurers run both: the platform prepares and ranks, the pricing model prices the programs worth writing.
Is there free reinsurance pricing software?
The Casualty Actuarial Society publishes research code and models, and its 2026 call for papers names its DFA Dynamo model as an example of a model template and encourages authors to share code in the CAS's public repository. Those are starting points for actuaries, not complete pricing systems.
How is a ceding commission calculated?
On a quota share the technical commission is what the premium can pay after expected losses, brokerage, the reinsurer's expenses and its target margin: on the sample program, 100 − 71.0 − 2.5 − 3.0 − 5.0 = 18.5%. A sliding scale then pays more or less around that point depending on the loss ratio that emerges.
What is the difference between a loss cost and a rate?
A loss cost is the expected loss as a share of subject premium; a rate is what the reinsurer charges, which must also pay commission, brokerage, expenses and return. In Patrik's CAS example a $100,000 expected loss cost supports a premium of $198,413.
Should a pricing tool use the cedant's loss ratio or a rebuilt one?
The rebuilt one, with the cedant's beside it. On the sample program the same terms show 99% rate adequacy on the cedant's 58.0% and 88% on the rebuilt 71.0%, which is the difference between writing the offered line and countering it.