High yield default rates measure the share of below-investment-grade borrowers, or of their debt, that defaulted over the past twelve months. The figures most often quoted for high yield bonds are published by rating agencies and data vendors from their own ratings and databases; no US government agency publishes an official high yield bond default rate. The public record still answers the question for 2026. The Federal Reserve reports that the dollar-weighted default rate on leveraged loans stayed below its historical median while the issuer count including distressed exchanges stayed high, and the US bankruptcy courts recorded 9,986 chapter 11 cases in the twelve months to 30 September 2026, the most in that period of any year since at least 2019. For a credit team those rates set the weather; the work is knowing which held names are in it. Botminds' Credit Surveillance, a credit early warning system for buy-side credit teams, reads every held issuer every day so that the market's default rate becomes a short list of the firm's own cases.
The figures below come from the Federal Reserve, the US Courts and the Fed's staff research, each linked; examples from the solution's sample data concern fictional firms.
Four public numbers on US high yield credit in 2026
$1.77T
high yield and unrated corporate bonds outstanding at the end of 2025, up 4.7% in a year
$1.55T
leveraged loans outstanding at the end of 2025, up 9.2% in a year
9,986
chapter 11 cases in the twelve months to 30 September 2026
27,054
business bankruptcy cases under all chapters in the same twelve months
What is the high yield default rate in 2026?
It depends on whose rate, and on what it counts. The rates printed in market commentary are compiled by rating agencies and data vendors; they differ by universe (bonds or loans, rated or not), by weighting (issuers or dollars) and by whether distressed exchanges count. The public measures available in 2026 point in two directions at once: few dollars in outright default, many borrowers in some form of distress.
The Fed's May 2026 report put it in one sentence: the volume-weighted default rate on leveraged loans stayed below its historical median, while defaults including distressed exchanges remained high (Federal Reserve, Financial Stability Report, May 2026). Read together with the courts' counts, the most consistent reading is that distress is spread across many smaller borrowers rather than concentrated in a few large ones. That is our interpretation of the public numbers, not a statistic. Inside a CLO the same defaults change the arithmetic directly, as CLO haircuts on CCC and defaulted assets shows.
How are default rates calculated?
A default rate is the number or amount that defaulted over a period, divided by the number or amount that could have defaulted at its start. The choices inside that sentence change the answer. The Fed's chart shows both versions side by side: one divides "the amount in default over the past 12 months" by the outstanding volume of loans not in default at the start, and the other divides "the number of issuers in default or distressed exchange" by the number of issuers not in default at the start (Financial Stability Report, November 2025, figure 2.9 notes).
Which default number answers which question
| Measure | What it covers | Weighting | How often | What it misses |
|---|---|---|---|---|
| Fed: realized default rate | Leveraged loans, from a vendor's data, since December 1998 | Dollars | Charted twice a year in the Financial Stability Report | Distressed exchanges; small borrowers count little |
| Fed: default rate including distressed exchanges | Leveraged loan issuers, since December 2016 | Issuers | Twice a year | The size of each default |
| US Courts: chapter 11 cases | Every chapter 11 case filed, business and individual | Cases | Quarterly, twelve-month windows | Out-of-court restructurings; counts each affiliate's case |
| Fed staff: corporate spread and excess bond premium | US nonfinancial corporate bonds, since January 1973 | Market prices | Monthly | Not a default count; what investors expect and charge |
| Rating agency and vendor studies | Rated bonds and loans by rating, often over decades | Issuers or dollars | Monthly to annual | Built on each agency's own ratings and definitions |
Two details trip up comparisons. The denominator excludes borrowers already in default, so a wave of defaults can lower the next year's rate simply by shrinking the pool. And twelve-month trailing rates move slowly: a quarter of heavy defaults stays in the figure for a year, and a turn for the worse shows up months after it starts. What counts as a distressed exchange explains why the two Fed measures now diverge.
What is the leveraged loan default rate?
On the Fed's dollar-weighted measure, below its historical median through 2025 and into 2026; on its issuer-weighted measure including distressed exchanges, high relative to its own history, which only starts in December 2016. The Fed reports both on a chart built from PitchBook Leveraged Commentary & Data rather than as a published number, so the exact level is the vendor's; what the Fed adds is the reading.
The loan market's size makes the measure matter. Leveraged loans outstanding reached $1.549 trillion at the end of 2025, up 9.2% in the year, faster than high yield bonds at 4.7% (Financial Stability Report, May 2026). Where an issuer has both loans and bonds outstanding, a distressed exchange in its loans is a warning for its bonds.
How many companies filed chapter 11 in 2026?
US bankruptcy courts received 9,986 chapter 11 cases in the twelve months to 30 September 2026, of which 9,453 were business cases, and 27,054 business cases under all chapters (US Courts, Table F-2). Those are cases, not companies: when a corporate group files, each entity files its own case, and the court may administer a debtor's case jointly with "a debtor and an affiliate" (Bankruptcy Rule 1015(b)(1)(D)). One large restructuring can add dozens of chapter 11 cases.
Business bankruptcy cases in US courts, twelve months to 30 September
Are defaults rising in 2026?
Court filings are: business bankruptcy cases rose 12.5% in the year to September 2026 and have roughly doubled from the 13,125 of the year to September 2022, and chapter 11 cases were the highest in the eight years shown. The Fed's dollar-weighted loan default rate is not; it stayed below its median. And the bond market is not pricing a rise: on the Fed staff's measure, the average US corporate bond spread was 93 basis points in September 2026, below its median since 1973, with the excess bond premium, the part not explained by expected defaults, below zero (Federal Reserve staff, excess bond premium data).
Those readings are consistent with each other if distress is concentrated among smaller borrowers and resolved partly out of court, while large borrowers keep paying. For a fund that matters in two ways: a market-wide default rate understates the risk in a book of smaller issuers, and the defaults that do happen arrive as exchanges and court filings at subsidiaries rather than as headline missed payments. What credit spread widening means covers how spreads and defaults relate.
What is PIK interest a sign of?
Payment-in-kind interest, paid by adding to the loan's principal rather than in cash, keeps cash in the business today at the cost of more debt tomorrow. The Fed has flagged it: in its May 2026 report it found private credit defaults still relatively low but read the elevated use of PIK provisions as a sign that some borrowers may struggle to repay, and it describes PIK as preserving liquidity while possibly indicating a deterioration in credit quality (Financial Stability Report, May 2026). A switch to PIK on a held name is a warning in its own right, and what PIK interest means in private credit covers the mechanics.
What is the historical high yield default rate?
The long histories of high yield default rates, decades of annual rates by rating, are compiled by rating agencies and data vendors from their own ratings, and no US government agency publishes an equivalent. Public series reach back in other forms. The Fed's realized default rate on leveraged loans runs from December 1998; the US Courts publish bankruptcy statistics every quarter; and the Fed staff's corporate spread series runs monthly from January 1973, peaking at 784 basis points in November 2008.
For a credit team, history is more useful as a calibration than as a forecast. A default rate by rating says how often a B-rated issuer has defaulted on average; it cannot say which of the B-rated issuers in the book will. That second question is answered issuer by issuer, from the issuer's own filings, courts and prices.
Where to find official default statistics
Official default statistics in the US are spread across several public sources, each answering a different question. A credit team can assemble a quarterly view from them without a vendor's study, as long as it states which measure it is quoting.
Public sources for default and distress statistics
- Federal Reserve, Financial Stability Report
Twice a year: market sizes, leveraged loan default measures with and without distressed exchanges, private credit and PIK.
- US Courts, bankruptcy statistics (Table F-2)
Quarterly, in twelve-month windows: cases by chapter, business and nonbusiness, by district.
- Federal Reserve staff, excess bond premium data
Monthly since 1973: the corporate spread, the premium not explained by expected default, and a model-implied recession probability. Staff research, revised each month.
- Federal Reserve, Financial Accounts of the United States
Quarterly: who holds corporate bonds and loans, and how much.
- MSRB, for municipal bonds
The EMMA system publishes issuers' event notices, including payment delinquencies and defaults, as they are filed.
- Your own book
Defaults, exchanges and court cases on the names you hold, by fund: the only rate that is yours.
From a market default rate to the names in your book
A market default rate is a probability over a population; a credit book is a list of names. The useful translation is not the rate times the book, but a watch list that shows which held issuers carry warning signs today, how much each fund holds, and who must decide. In the fictional sample, 14 open watch cases put $166.2M on watch across 35 funds, with the highest share in any one fund 0.53% of its NAV.
Watch exposure by fund in Credit Surveillance: where the market's defaults would land in one book
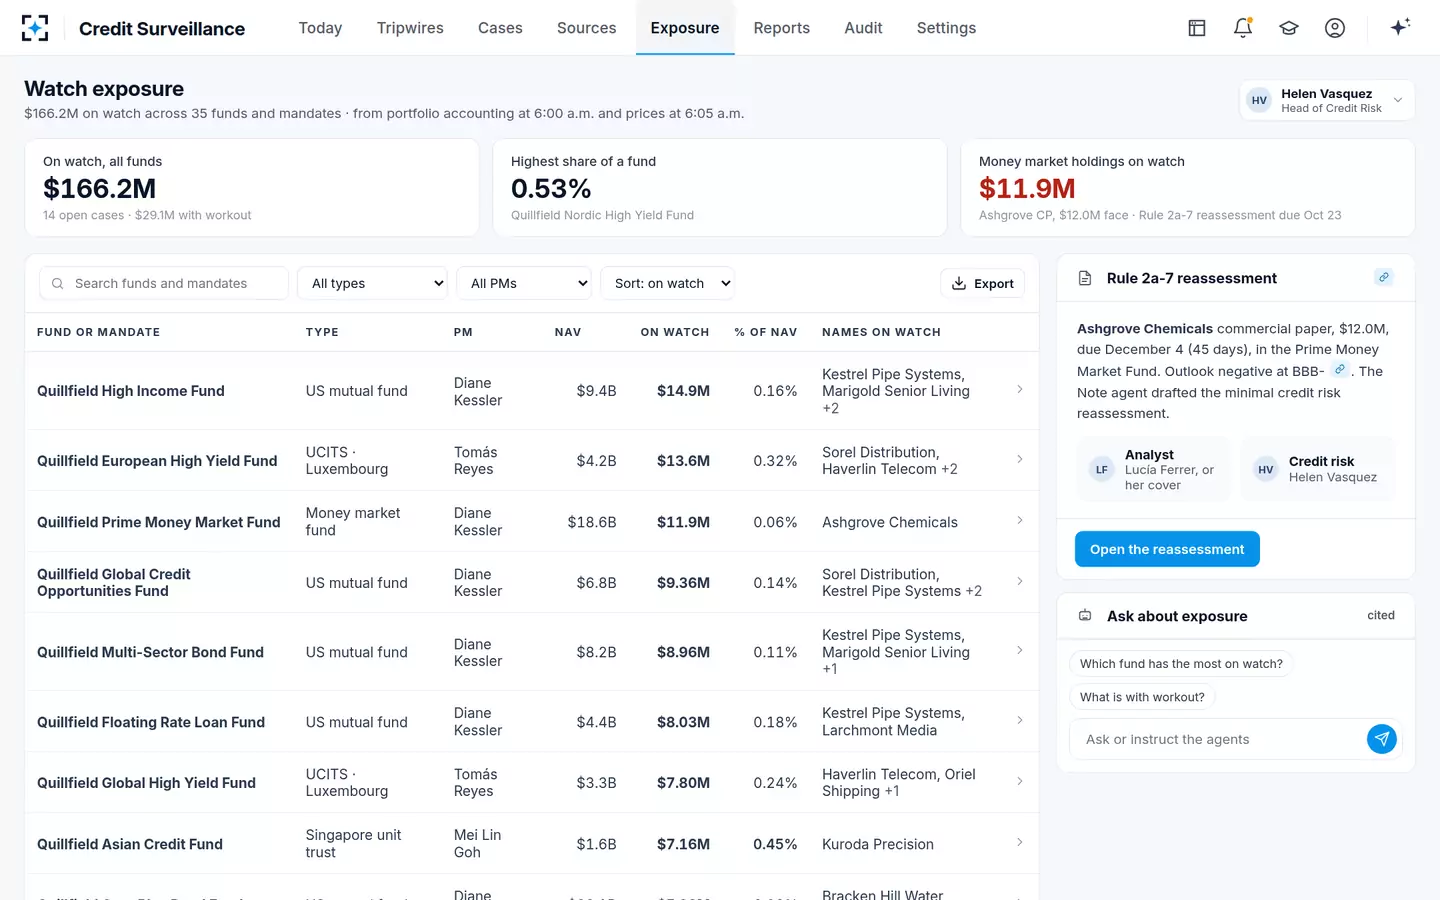
Money market funds add a rule to the arithmetic. Under SEC Rule 2a-7, any default on a portfolio security that is not both immaterial and unrelated to the issuer's finances is one of the events after which the fund must dispose of the security as soon as practicable unless its board finds otherwise (17 CFR 270.2a-7(f)(1); credit rating outlook vs watch sets out the review clock that follows). A rising count of defaults among commercial paper issuers is therefore not just a statistic for those funds but a list of possible forced sales.
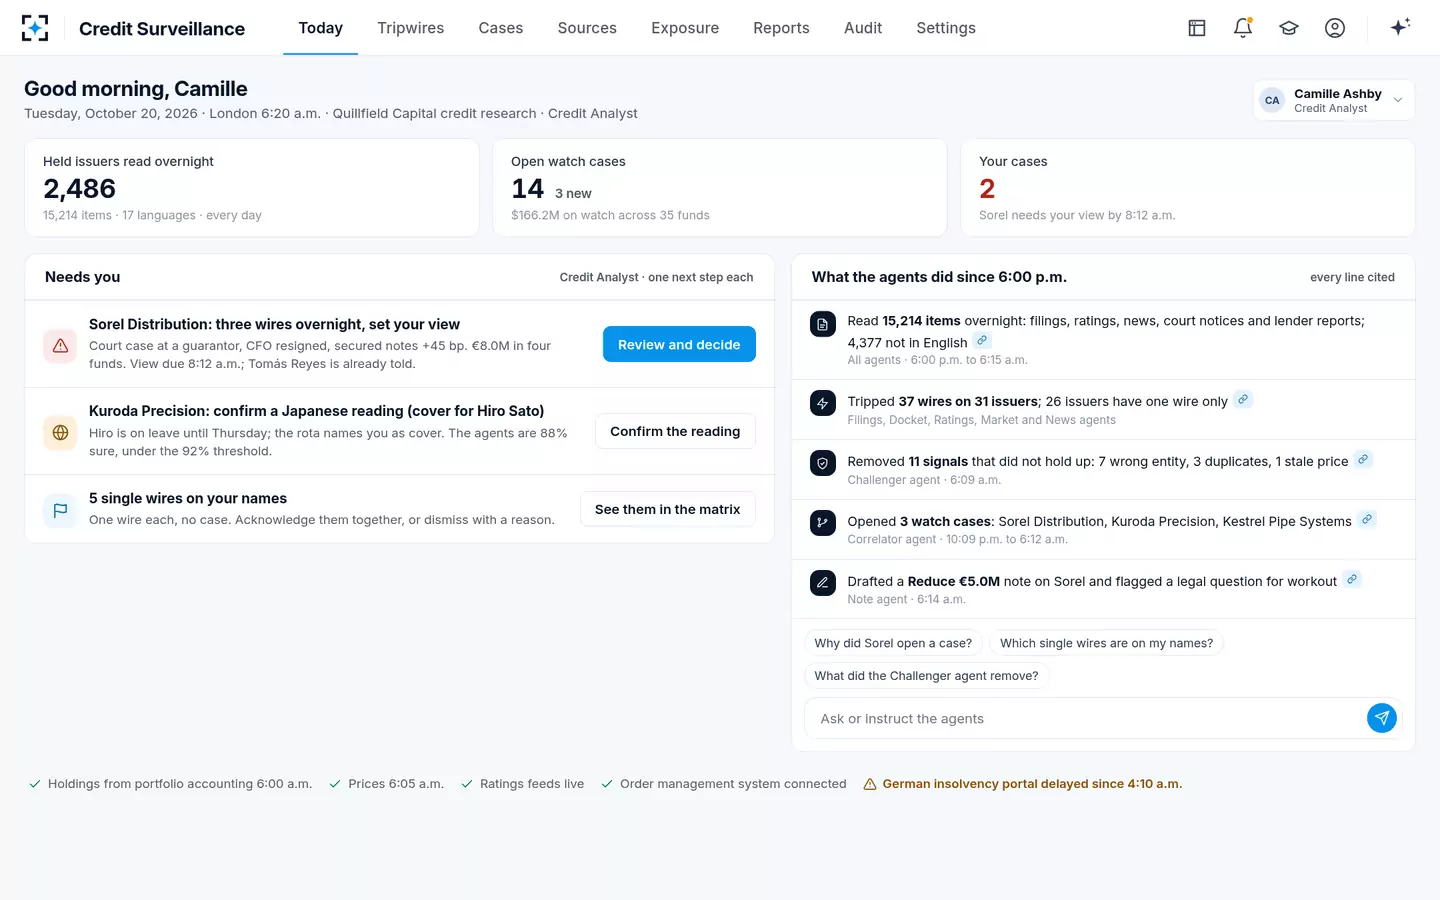
The analyst's morning: the names behind the numbers
Where Credit Surveillance fits, and what it does not forecast
It fits a credit team that wants the warning signs behind default statistics watched on its own holdings every day: court filings at issuers and guarantors, distressed exchanges and consent solicitations, late filings, covenant waivers, rating actions and spreads against the sector. Each becomes a tripwire on the right issuer, and two warnings within ten days, or one red one, become a watch case sized in every fund.
It does not forecast default rates or produce a probability of default for a name, and it does not replace the rating agencies' or vendors' studies a risk team may license for calibration. What it adds is the list of the firm's own names in distress, with sources, owners and decisions. Who watches every issuer on the credit watch list covers what happens next, and the sample night is on the Credit Surveillance page.
Questions people ask
Does the Federal Reserve publish a high yield bond default rate?
No. The Fed's Financial Stability Report charts default rates for leveraged loans, built on a vendor's data, with and without distressed exchanges, and reports market sizes for high yield bonds. Bond default rates by rating are compiled by rating agencies and data vendors.
Why do different sources give different default rates for the same year?
They count different things: bonds or loans, rated issuers or all issuers, dollars or issuers, with or without distressed exchanges, over calendar or trailing twelve-month periods. The Fed's own two loan measures differ for exactly these reasons, one weighted by dollars and one by issuers.
Do chapter 11 filings measure corporate defaults?
Partly. They capture court-supervised restructurings, including small businesses and individuals filing under chapter 11 (533 nonbusiness cases in the year to September 2026), and count each affiliated debtor separately. They miss defaults resolved out of court, such as distressed exchanges.
How often are official default and bankruptcy statistics updated?
The US Courts publish bankruptcy tables every quarter, each covering a twelve-month period. The Fed's Financial Stability Report comes out twice a year, and its staff post the corporate spread and excess bond premium monthly, usually on the fourth business day. That cadence is why a credit team watches its own names daily rather than waiting for the next release.
What is a good default rate assumption for a high yield portfolio?
There is no official figure. Teams typically calibrate on long rating-based histories they license and adjust for the cycle; the public measures above say that in 2026 dollar-weighted loan defaults are low while distress by issuer count is high, which argues for assumptions that weight smaller issuers more.