Insurance data analytics software turns policy, premium, claims and exposure data into the measures an insurer acts on: loss ratios, rate change, mix, reserves, trends. For program business the hard part comes before the analytics, because the data is not the carrier's own: it arrives monthly from each managing general agent (MGA) in that MGA's layout, and must be checked, standardised and tied to the binder before a single ratio can be trusted. Botminds' MGA Program Performance Analytics is analytics software built for that starting point. Six agents check each bordereau, re-rate renewals, re-project the loss ratio and redraw each program's bridge from plan to projected; the program actuary and the head of program business keep the judgments the rules assign to them. This guide splits a program's monthly work task by task, so a buyer can see exactly what moves to software and what does not.
The tasks and examples are taken from fictional sample data in the solution: the carrier Harlow Ridge Specialty and its Brickline Habitational program, written by Corbel Program Underwriters, as at the May 2026 bordereaux. The regulators' expectations are quoted from their own publications.
A program's fifteen monthly tasks: ten move to agents, five stay with people
Monthly tasks for one program
- Agents: read, check, re-rate, project, draft, 10 · 67%
- People: rule, sign, decide, 5 · 33%
What is insurance data analytics software? Five kinds a carrier may already own
Insurance data analytics software is any system that turns an insurer's transaction data into measures for decisions, and most carriers already own several kinds. Business intelligence dashboards report what the carrier's own systems hold. Reserving tools develop loss triangles and estimate ultimate losses. Pricing and rating tools build and apply rates. Policy administration systems report on the business they process. Exposure tools aggregate insured values against catastrophe scenarios.
Each assumes the data is already clean, complete and in the carrier's own format. Program business breaks that assumption. Under the NAIC's model act, the MGA must account for every transaction at least monthly, and the carrier may access and copy the records in a form it can use (Model #225 §4B, §4D), but usable is not standard: nine MGAs send nine layouts. Software for programs therefore has a first job the others do not: read each MGA's files as sent and check them against the binder before anything is calculated.
How is analytics used in program business? From the bordereau to a decision
In program business, analytics answers one recurring question for each program: is it running to the plan it was priced on, and if not, why and what should change. The answer feeds four decisions the carrier can take under the binder: continue, re-price, reduce its line, or exit. The analytics is useful only if it explains the movement by cause, because each cause has a different remedy: a rate shortfall is fixed by charging the rate guide, a mix drift by underwriting guidance, a run of large losses by risk selection or reinsurance.
Fifteen monthly tasks on one program, and who does each
| Task | Done by | What stays with a person |
|---|---|---|
| 1. Log each MGA file with its landing time against the due date | Bordereau intake checker | Chasing a late MGA, if the reminder fails |
| 2. Map the MGA's layout to one standard | Bordereau intake checker | Approving a new mapping when a layout changes |
| 3. Tie row counts to the MGA's control totals | Bordereau intake checker | — |
| 4. Tie written premium to the monthly account statement | Bordereau intake checker | Following up a break with the MGA's finance team |
| 5. Check every row against limits, territory, classes and dates | Bordereau intake checker | Ruling on each referral (task 11) |
| 6. Re-rate renewals on the rate guide; list each surcharge or credit missed | Rate monitor | — |
| 7. Measure mix against the plan with the plan's relativities | Mix analyst | — |
| 8. Separate large losses; develop incurred to ultimate; propose a loss pick | Loss projector | Signing the loss pick (task 13) |
| 9. Redraw the bridge; flag any step that moved; test the binder's levels | Bridge builder | — |
| 10. Draft the commentary and queries, citing every number | Commentary writer | Approving them (task 14) |
| 11. Rule on referrals, such as a risk outside the territory | Program underwriter | The ruling |
| 12. Confirm matches and send queries back to the MGA | Bordereaux analyst | What is sent |
| 13. Sign the loss pick and the method | Program actuary | The signature |
| 14. Approve the commentary; decide continue, re-price, line or exit | Head of program business | The decision |
| 15. Sign any notice to the MGA | Head of program business | The signature; the agents never send one |
Can AI analyse MGA bordereaux? Yes, if it reads, checks and cites
AI can analyse MGA bordereaux, and back-office reading and extraction is where insurers are using it first. EIOPA's February 2026 survey of 347 insurers in 25 countries found that 64% of the reported uses were back-office productivity tools such as data extraction (quoted in AI underwriting assistant tools), and that "Most undertakings are nevertheless still at a proof-of-concept stage" (EIOPA, 2 February 2026). Bordereaux are a natural case: structured but inconsistent files, checked against written rules.
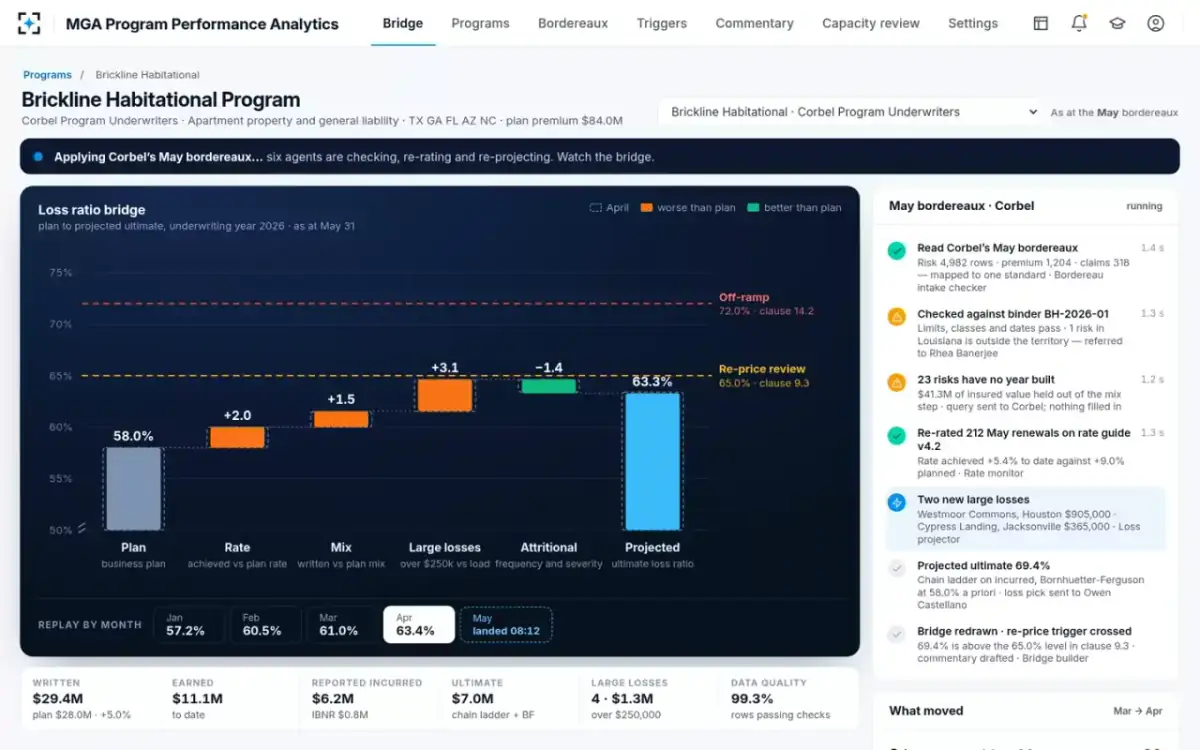
The conditions matter more than the capability. An agent that reads a bordereau should never change it, should hold out a row it cannot classify rather than guess, and should cite the file and row behind every number it produces. In the sample, Corbel's May risk bordereau arrived with 23 risks, $41.3 million of insured value, missing their year built. The intake checker queried them back to the MGA and the mix analyst held them out of its step, reporting a range rather than filling the gap.
One program's May bordereaux through the agents, and where people sign
Agent
Bordereau intake checkerReads 4,982 risk rows, 1,204 premium rows and 318 claims rows; ties them to control totals and $7.41 million of premium to the account statement; refers one risk outside the territory; queries 23 with no year built.
Never: fills in a missing field
Agent
Rate monitor and mix analystRe-rate 212 May renewals on rate guide v4.2; measure pre-1980 buildings at 26.4% of insured value against an 18.0% plan.
Never: changes a rate or re-classes a risk
Agent
Loss projectorFinds two new large losses and re-projects the ultimate loss ratio to 69.4%, proposing the loss pick.
Never: sets or changes a case reserve
Agent
Bridge builder and commentary writerRedraw the bridge, show the re-price level crossed, open a review under the binder clause and draft the commentary.
Never: sends a notice
A person decides
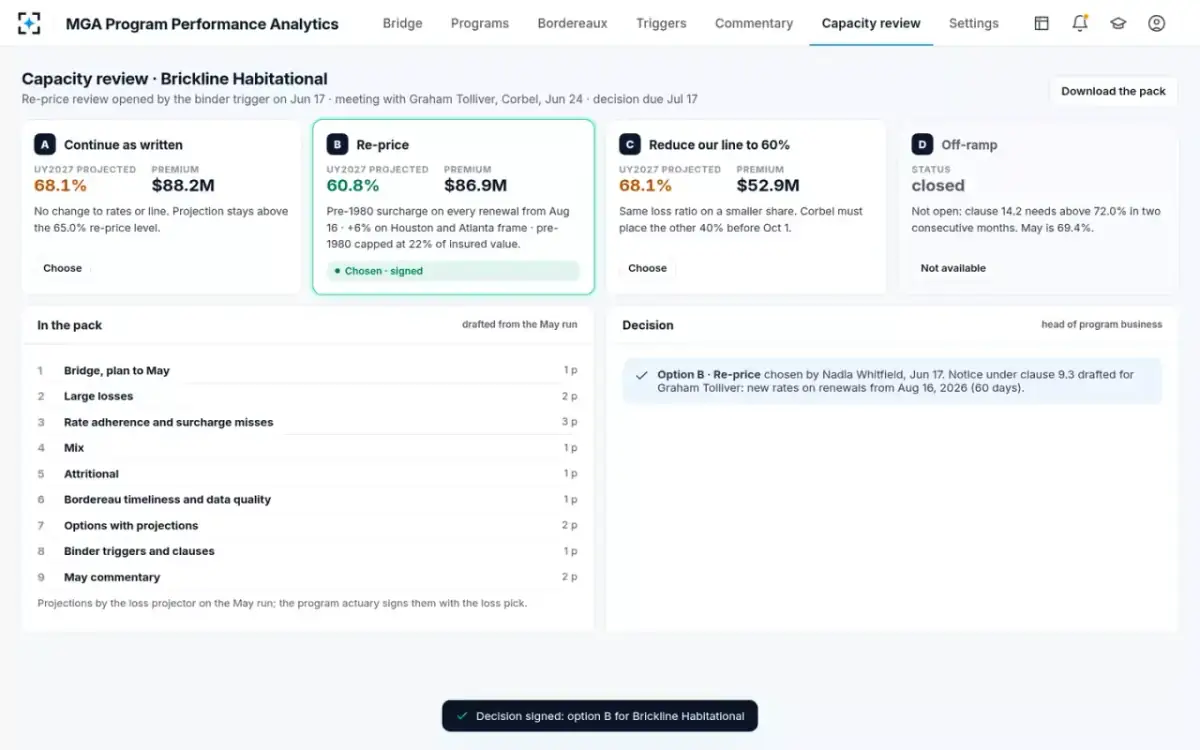
Program actuary, then head of program businessThe actuary signs the 69.4% loss pick; the head of program business approves the commentary, weighs four options and signs the decision.
What regulators expect when software does the checking
No regulator has published a rule specific to AI in bordereaux processing, so the general expectations apply, and they all put responsibility on the insurer. EIOPA's 2025 opinion on AI governance is direct: the insurer stays ultimately responsible for the AI it uses, whether built in-house or with an outside provider (EIOPA-BoS-25-360). In the US, the NAIC's model bulletin on AI asks insurers to address due diligence on third-party AI systems and their data; the guide to the NAIC AI bulletin requirements covers what that means in practice.
UK supervisors add the risks they watch for. The PRA's 2026 priorities letter warns that advanced technologies bring new risks and magnify old ones: poor data, dependence on outside providers and cyber exposure (PRA, January 2026), and the FCA plans this year to "assess how firms use AI in their internal processes – underwriting, claims, services to consumers – and identify barriers to adoption" (FCA, Regulatory Priorities: Insurance, 2026). Software that cites every number to its source row, and leaves every decision with a named person, answers most of those concerns by design rather than by policy.
What does a program actuary do, and what changes when the triangles build themselves?
A program actuary estimates each program's ultimate loss ratio, chooses and documents the method, and signs the loss pick the carrier books. Where an MGA sets loss reserves, the carrier must also obtain an actuary's opinion every year on whether the reserves the MGA set for its business are adequate (Model #225 §5B), in addition to its other reserve certifications.
What changes with analytics software is the starting point. Instead of rebuilding a program's development from re-keyed spreadsheets each quarter, the actuary starts each month from a projection whose every step drills to the claims rows, with the method stated. In the sample, the actuary signs a 69.4% loss pick using chain ladder on incurred losses, with Bornhuetter-Ferguson at the 58.0% plan loss ratio for months under 12. The point is that the actuary's time goes on the choice of method and the large claims, where judgment is needed, rather than on rebuilding the data. The reserving role itself is described in the guide to the reserving actuary.
The agents at work on one program's May files
What tasks can analytics automate, and which should it never touch?
Analytics can automate the tasks that are mechanical given the rules: reading and mapping files, tying totals, checking rows against binder limits, re-rating on a rate guide, measuring mix against a plan, separating large losses, running a stated development method, testing trigger levels and drafting cited commentary. Those are ten of the fifteen monthly tasks in the table above, and they are where re-keying hours used to go.
It should never take the five that carry accountability: ruling on a referral, deciding what goes back to the MGA, signing the loss pick, deciding to re-price, cut or exit, and signing a notice. Those stay with people because the statutes and the binder make them the carrier's acts. The decision screen below is where the sample program's month ends.
The decision stays with a person: four options, one signature
Insurance data analytics software for programs: what to ask before you buy
A buyer should judge analytics software for programs on how it handles the MGA's files and the carrier's accountability, not on its charts. The questions below expose both.
Eight questions for insurance data analytics software, for program business
- Does it read each MGA's files as sent, or need them re-keyed first?
Re-keying is where the delay and many of the errors come from.
- Does it check every row against the binder, or a sample?
Limits, territory, classes and dates are written rules; there is no reason to sample them.
- Does every number open the rows and clauses behind it?
The actuary and the underwriter will act only on figures they can trace.
- What does it do with a missing field?
It should query and hold out, and say how many rows are affected, never fill the gap.
- Does it explain movement by cause?
Rate, mix, large losses and attritional each need a different fix.
- Can the binder's own levels and signers be set per program?
Re-price and exit levels, months-running rules and who signs differ by binder.
- Can it send anything to an MGA without a signature?
The right answer is no.
- Can you replay last year on it before you buy?
A replay on your own closed year is the fairest test of a monthly view.
The last question carries most weight. How to replay a closed year and score the result is set out step by step, and how the underwriters and actuaries come to trust the new numbers after go-live has its own guide.
What program analytics software needs from the carrier on day one
Program analytics software needs six inputs, and most carriers already hold all of them in some form. The work of implementation is finding the version in force for each program, not creating anything new.
Six inputs for program analytics, and why each one matters
| Input | Why the analytics needs it | Where it usually lives |
|---|---|---|
| Risk, premium and claims bordereaux, as each MGA sends them | Every measure is calculated from the rows; the MGA's own layout is the starting point | The delegated authority or finance team's shared drive or inbox |
| Binders, with their schedules and amendments | Limits, territory, classes and dates for every row check; the re-price and exit clauses for the triggers | Legal or the program team, often as signed PDFs |
| Business plans | Plan loss ratio, plan rate change and plan mix: the bridge starts from them | The program team's planning files |
| Rate guides, by version | Re-rating renewals needs the version in force on each renewal date | Underwriting, sometimes only at the MGA |
| Development data for each program | Projecting reported losses to ultimate | The reserving team's triangles |
| MGA account statements | Tying premium on the bordereau to money the MGA says it owes | Finance or credit control |
Two of the six cause most delay. Rate guides are often versioned at the MGA and not at the carrier, so the first month's re-rating may run on the wrong version unless the dates are checked. And binder amendments, a territory added mid-year or a limit raised for one account, are easy to miss; a row check against the original binder will raise referrals for business the carrier already approved. Both are found quickly in a replay, which is one more reason to run one before go-live.
Where MGA Program Performance Analytics fits, and where it does not
The solution fits between the MGA's files and the carrier's decisions: it is program analytics that starts from bordereaux, binders, business plans and rate guides, and ends at a signed loss pick and a signed decision. It works with what MGAs already send, in their own layouts, and with each program's development data.
It is not a general business intelligence tool, a rating engine, a policy administration system or a reserving platform, and it does not try to replace them. Where a carrier's reserving system holds the official triangles, the solution's projection is a monthly view the actuary can reconcile to them, not a second set of books. And where an MGA sends only summaries, without row-level claims or premium, the bridge can show levels but not the rows behind them. To see the agents and the signatures on your own programs, start from MGA Program Performance Analytics.
Questions people ask
What is insurance analytics?
Insurance analytics is the use of policy, premium, claims and exposure data to measure and predict insurance results: loss ratios, rate adequacy, reserves, retention, fraud. In program business it is mostly performance analytics on delegated books, measured against each program's plan and binder.
Do insurance data analytics companies need access to policyholder data?
For program analytics, yes: bordereaux carry policy and claims rows, and may carry insureds' names and addresses. That makes the provider a third party handling the carrier's data, so the carrier's third-party due diligence and data security obligations apply. The analysis itself rarely needs more than policy and claim identifiers, locations and building attributes.
Can analytics software replace the on-site review of an MGA?
No. The model act requires an on-site review of the MGA's underwriting and claims operations at least semi-annually (annually in Florida), and only a visit can test files, people and controls. Monthly analytics gives the review its agenda: the referrals, missed surcharges and late files already found.
How long does a program analytics run take?
In the sample, applying one month's bordereaux for one program, about 6,500 rows across three files, took 6.8 seconds from start to a redrawn bridge. The design target for a live book is that each program's view moves the same day its files land; the slower part is the human review that follows.
Who is responsible if the analytics are wrong?
The carrier. EIOPA's 2025 opinion makes undertakings ultimately responsible for AI systems they use however they are supplied, and under the model act the MGA's acts are the insurer's acts. That is why the actuary signs the loss pick and a named person signs every decision.