A good loss ratio is one low enough to leave room, after claims, for the book's expenses and the profit the risk-taker needs, and that point differs by line, by distribution cost and by year. The US industry's net loss ratio, including claim expenses, was 66.5% in 2025, the lowest in the ten years NAIC shows (NAIC 2025 analysis). But the same NAIC report shows pure loss ratios from 43% in commercial property to 71% in commercial auto liability, and each line can make money at its own level. For a program written by a managing general agent (MGA), the only meaningful benchmark is the loss ratio its binder and business plan were priced on. Botminds' MGA Program Performance Analytics measures every program against that plan each month, with the binder's own re-price and exit levels drawn across the chart.
The industry figures here are NAIC's and the rules are regulators'; the program figures come from fictional sample data in the solution, a carrier with nine programs, each priced to its own plan.
Good depends on the line: 2025 pure loss ratios from 43% to 71%
What is a good loss ratio? The one your expenses and profit leave room for
A good loss ratio is at or below the permissible loss ratio: one hundred percent of premium, less the expense ratio, less the target profit. Rate regulators build it exactly that way. Texas's rate filing exhibit asks an insurer to list commission and brokerage, other acquisition, general expenses, taxes, licences and fees, the net cost of reinsurance and profit, total them, and then state the "Permissible loss and LAE ratio" that remains (TDI form PC369, Exhibit G).
The arithmetic explains why lines differ. A line sold direct with low acquisition costs can run a higher loss ratio than one sold through layers of intermediaries. A long-tail liability line earns investment income on reserves for years, which can justify a smaller underwriting profit provision than a short-tail property line. And a program written through an MGA carries the MGA's commission on top of the carrier's own costs, which lowers the loss ratio the program can afford.
What is a target loss ratio? An example from a court opinion
A target loss ratio is the share of premium a program is designed to spend on claims, after the parties' agreed shares come out. A federal appeals court set one out for an auto program. After the fronting carrier took "a small percentage off the top", the MGA "would receive 20.6% of what remained as compensation for its administrative work", and "The remaining 10% of premiums was expected to go to Lincoln as its profit for bearing the risk" (5th Cir. 2015). What was left for claims was the target.
How one program in a court opinion divided each premium dollar after the fronting fee
Premium after the fronting carrier's share
- Target loss ratio · 69.4%
- MGA compensation · 20.6%
- Reinsurer's margin · 10%
The court called the claims share by its name: incurred losses were expected to "amount to 69.4% of the remaining collected premiums. This percentage is the 'target loss ratio.'" A loss ratio of 65% would have been good for that program and 75% bad, not because of any market norm but because 69.4% was what its other shares left. The same logic sets the plan loss ratio in any program's business plan.
“As things turned out, actual losses for all relevant years fell below the target loss ratio of 69.4%. This should have resulted in all parties making money. Instead, Lincoln lost millions.”
US Court of Appeals for the Fifth Circuit, Lincoln General Insurance Co. v. U.S. Auto Insurance Services, 18 May 2015
The case is also the best warning against judging a program by its loss ratio alone. The program hit its target every year; the reinsurer lost money because premium was diverted to related companies before it reached the trust account, and because the MGA later changed how its commission was calculated. A good loss ratio says nothing about whether the premium arrived.
How is a program's target loss ratio built? Costs out first, then a load for large losses
A program's target loss ratio is built by taking every non-claims cost out of premium, then splitting what remains between expected attritional claims and a load for large ones. The first step follows the regulators' permissible-ratio arithmetic; the second is what makes the target usable month to month, because large losses arrive irregularly and need their own allowance.
Building a program's plan loss ratio, line by line
| Line | Illustrative program | Where the figure comes from |
|---|---|---|
| Premium | 100.0% | — |
| MGA commission and fees | − 24.0% | The binder's commission schedule |
| Carrier's own costs: taxes, licences, fees, oversight | − 8.0% | The carrier's expense exhibit, by state |
| Net cost of reinsurance | − 4.0% | The program's treaty or facultative cost |
| Target underwriting profit | − 6.0% | The carrier's return on the capital the program uses |
| Permissible loss and LAE ratio | = 58.0% | What the program can spend on claims and claim costs |
| of which: load for large losses | 9.0 points | Plan allowance for claims above the large-loss threshold |
| of which: attritional | 49.0 points | Everything below the threshold |
Loads differ by line as much as plans do. In the sample book the large-loss load runs from 6.0 points for a pet care program to 12.0 points for nonprofit directors' and officers' liability, reflecting how much of each line's cost comes from a few severe claims. A month in which large losses run far above the load, as they did on the sample habitational program, is a reason to look at the claims, not yet a reason to re-price; a run of months in which attritional losses exceed their share is.
What is the average loss ratio?
The average US property and casualty loss ratio, measured as NAIC measures it, net losses and loss adjustment expenses over net earned premium, was 66.5% in 2025 and ranged between 66.5% and 76.4% over the ten years to 2025 (NAIC 2025 analysis). Without claim expenses, the 2025 figure is about 57.6%. Those are averages across lines with very different economics, so they describe the market's year, not a target for any one book.
NAIC's own definitions are worth keeping straight. Its glossary defines the loss ratio as incurred losses as a percentage of earned premium, and the combined ratio as the loss and expense ratios added together (NAIC glossary). Whether a quoted average includes loss adjustment expenses moves it by about nine points, more than the gap between a good year and a bad one.
Is a 60% loss ratio good? It depends on the expense load
A 60% loss ratio is good for a book whose expenses and target profit add up to less than 40% of premium, and bad for one whose costs are higher. Take two illustrative books. A carrier writing direct, with expenses of 25% and a 5% profit target, can afford a 70% loss ratio; at 60% it earns 15 points. A program written through an MGA, with a 25% MGA commission and fees, 8% of carrier costs and premium taxes and a 7% target return, can afford 60% exactly; at 60% it earns its target and nothing more.
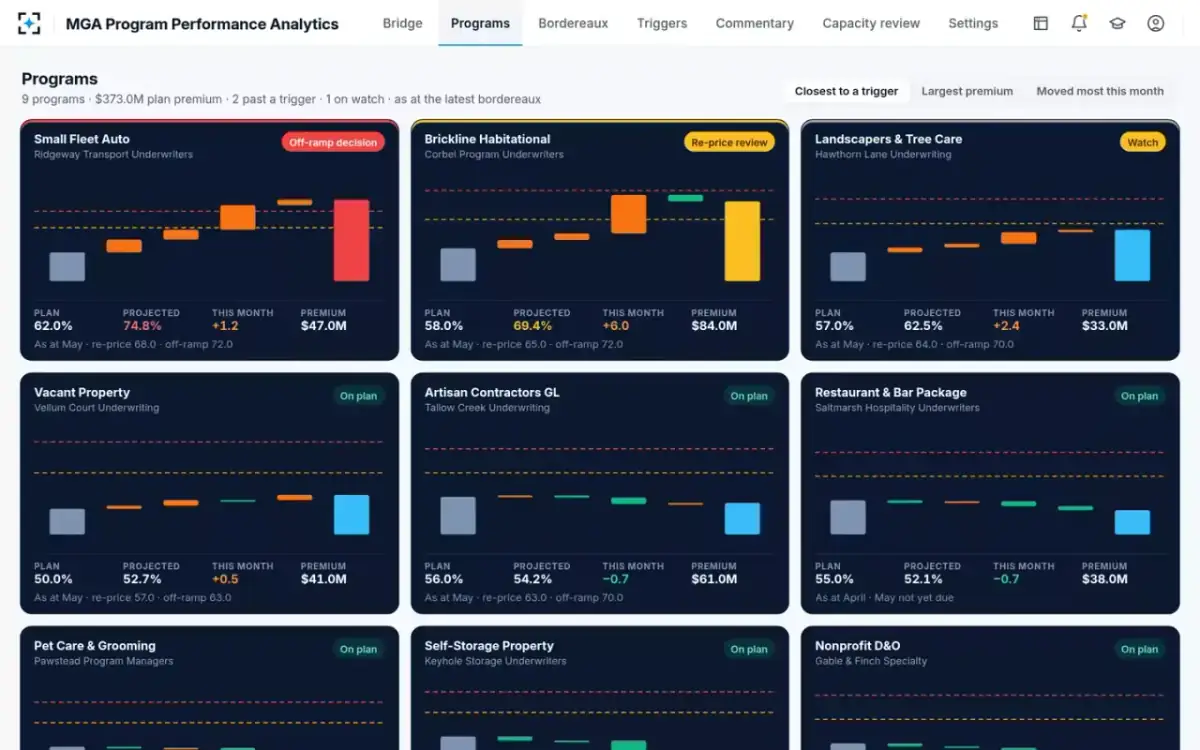
That is why programs in one book carry very different plans. In the sample book, plan loss ratios run from 45.0% for a self-storage property program to 62.0% for small fleet auto, and a 60% month is comfortably good for the auto program while it would breach the self-storage program's 52.0% re-price level. Comparing them with each other, or with the industry average, tells the carrier little; comparing each with its own plan tells it what to do.
Nine programs, nine plans: each judged against its own
What is a good loss ratio for an insurance company in a single year? Less than it looks
A single year's loss ratio is a weak verdict on an insurer or a program, because catastrophes, large claims and reserve changes move it by more than underwriting quality does. NAIC's state table for 2025 shows how far one year moves: Florida's pure direct loss ratio fell 23.3 points, while California's rose 16.4 in the year of the Palisades and Eaton wildfires, which NAIC says accounted for nearly half of the year's insured losses from natural disasters.
One year's swing in pure direct loss ratios, by state
| State | 2024 | 2025 | Change |
|---|---|---|---|
| Florida | 62.4% | 39.1% | −23.3 points |
| Georgia | 77.4% | 57.4% | −20.0 points |
| Texas | 64.9% | 57.7% | −7.3 points |
| California | 61.5% | 77.9% | +16.4 points |
| United States, all states | 61.8% | 57.0% | −4.7 points |
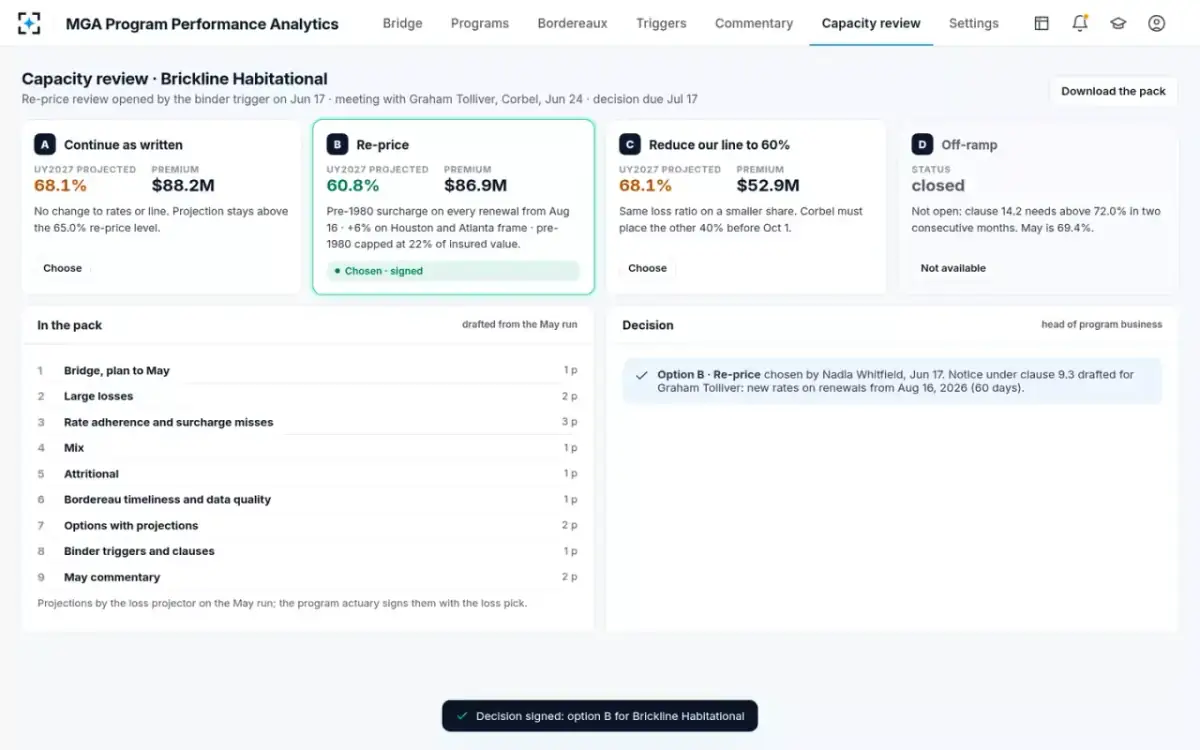
A program is smaller than a state and swings further. One large fire can add several points to a habitational program's year, as it did to the sample program in May, without telling anyone that the underwriting changed. That is why a monthly view should separate large losses from the attritional rest, and why a re-price or exit decision should rest on the causes that persist: rate, mix and attritional frequency.
When is a low loss ratio a warning? Three lenses on the same number
A low loss ratio is good for the risk-taker's underwriting result, but regulators of customer value read it differently, and solvency supervisors care whether it is real. The same number answers three different questions.
Three ways regulators and carriers read the same loss ratio
What a low ratio suggests: Premium comfortably covers claims; room for expenses and profit.
What the reader checks: Whether the losses are fully developed, and whether premium was actually received.
What a low ratio suggests: Customers may be paying for little cover; the FCA expects firms reviewing products to use claims information including "claims ratios".
What the reader checks: Whether the product still offers fair value, under PROD 4.2.
What a low ratio suggests: Too little premium spent on care.
What the reader checks: Insurers must rebate below an 80% medical loss ratio in the small group market and 85% in the large group market (45 CFR §158.210).
What a low ratio suggests: Possibly optimism rather than performance.
What the reader checks: Whether reserves rest on plan loss ratios; the PRA has warned that "Using optimistic business plan loss ratios for this purpose is not realistic".
For a program carrier the middle rows matter in the UK: since December 2025 the FCA has refused to let an MGA take sole responsibility, as lead manufacturer, for a product's fair value, and a persistently tiny claims ratio on a consumer product is a question the carrier, not only the MGA, will have to answer. The last row matters everywhere: a loss ratio that looks good because reserves were set to the plan is not a result.
What loss ratio do MGAs aim for? The plan, and two levels above it
MGAs aim for the plan loss ratio in each binder's business plan, and a well-written binder adds two levels above it at which the carrier acts. In the sample book, every program has a re-price level six or seven points above its plan and an off-ramp level ten to fourteen points above, the latter requiring two consecutive months before the exit clause opens. Brickline Habitational, planned at 58.0%, has its re-price level at 65.0% and its off-ramp at 72.0%.
The MGA's own incentive usually points the same way. Where its contract pays a profit commission below a target, as in the court case above, the MGA gains from every point under the plan. The model act stops it collecting that gain early when it can influence the result through reserves or claim payments: one year after the profits are earned on property business, five years on casualty, and only once verified. A good loss ratio, from the carrier's side, is one that is still good when the claims are closed.
A re-price decision priced against the plan, not the market
How the loss ratio itself is calculated, and why reported and projected figures differ by many points on a young year, is the subject of the loss ratio calculation guide. Whether a program's rates can still reach its plan is the subject of the rate adequacy index guide, and the expected loss ratio actuaries start from is set out in the guide to the a priori loss ratio. To see every program against its own plan, start from MGA Program Performance Analytics.
Questions people ask
What is a good loss ratio for workers' compensation?
There is no regulatory figure, but NAIC reported a 2025 pure net loss ratio of 48% for workers' compensation and called it one of the most profitable commercial lines. Workers' compensation claims run for years, so a carrier judges a workers' compensation book on developed accident years and its own permissible loss ratio rather than on one year's reported figure.
What is a good loss ratio for health insurance?
In US health insurance the law sets a floor rather than a ceiling. Under 45 CFR §158.210, an issuer must rebate premium if its medical loss ratio is below 85% in the large group market or 80% in the small group market. A health insurer's good loss ratio is therefore above those minimums, the opposite of the property and casualty intuition.
What is a good combined ratio?
Below 100% means the book made an underwriting profit before investment income. The US property and casualty industry's combined ratio was 92.9% in 2025 and above 100% in 2016, 2017, 2022 and 2023, according to NAIC. Long-tail lines can accept a combined ratio near or above 100% if investment income on reserves is large enough.
Is the loss ratio the same as the claims ratio?
Usually, yes. UK regulators and firms tend to say claims ratio, and the FCA lists claims ratios among the information firms must use when reviewing whether a product offers fair value. As with the loss ratio, check whether claim handling costs are included before comparing figures.
What is an expected loss ratio?
An expected loss ratio is the loss ratio a book is expected to produce before its own experience is credible, set from pricing, the business plan or similar business. In a program it is usually the plan loss ratio; in the sample, the program actuary uses the 58.0% plan as the a priori loss ratio for months with less than a year of development.