Prior year reserve development is the amount by which an insurer's estimate of what it owes on earlier accident years changed during the current year: the reserves held at the start for those years, compared with the payments made on them since plus the reserves still held at year-end. A positive result means the old reserves were too low, adverse development, and is charged to this year's earnings; a negative one means they were too high, favorable development or a redundancy, and adds to them. In 2025 the US property and casualty industry recorded a one-year redundancy of $20.0 billion, the NAIC reports, but the total hides a split: personal lines and workers' compensation released reserves while other liability, commercial auto and commercial multiple peril strengthened them. The same split happens inside individual books, and Botminds' Loss Development Monitoring is built to find it each month, by segment and accident year, rather than at year-end.
The industry figures come from the NAIC's 2025 full-year results and IRIS ratio publications and from the Federal Insurance Office; the book-level example is a sample casualty book in the solution, with fictional companies and claims.
2025 at a glance: a large release on top, adverse lines underneath
$20.0B
one-year reserve redundancy, US property and casualty industry
$13.5B
two-year reserve redundancy
+$10.4B
adverse development across the five lines that strengthened
$1.03T
loss and LAE reserves at year-end 2025, up 5.1%
What is prior year reserve development?
Prior year reserve development measures how far last year's reserves for old claims missed. The NAIC's IRIS manual defines the one-year version precisely: "The estimate of losses outstanding a year prior and up to the current statement date is the sum of the current reserves for those losses still outstanding plus the payments on those losses made during the past year. The difference between this current estimate and the reserves that were established at the end of the prior year is the one-year reserve development" (NAIC IRIS Ratios Manual). The two-year version does the same against reserves set two year-ends earlier.
The sign convention matters and is easy to invert. In the NAIC's ratios a positive figure is a deficiency: the current estimate exceeds what was reserved, so reserves were short. A negative figure is a redundancy. Press releases tend to speak of "favorable" and "adverse" development instead; favorable means a redundancy released into income, adverse means a deficiency charged against it.
Was 2025 reserve development favorable?
Yes, for the industry as a whole, and strongly. The NAIC reports a one-year redundancy of $20.0 billion and a two-year redundancy of $13.5 billion for 2025, and attributes the turnaround mainly to personal lines, which together released $15.9 billion (NAIC, 2025 Full Year Results). The Federal Insurance Office, using S&P Global data on total incurred net loss development, describes 2025 as more favorable than any year in the past ten (FIO, 2026).
The NAIC also places 2025 in context: it followed several years in which prior-year releases had been shrinking, mainly because of adverse development in the commercial liability lines, which the NAIC attributes to economic and social inflation. Favorable at the total, in other words, was not the same as favorable everywhere.
Which lines had adverse reserve development in 2025?
Five lines developed adversely in 2025 in the NAIC's chart: other liability on an occurrence basis, commercial auto liability, commercial multiple peril, product liability on an occurrence basis and international. Other liability alone, at $7,278 million, was more than twice the next four combined. Five lines released reserves, led by workers' compensation and private passenger auto liability.
Prior year reserve development by line in 2025: five lines adverse, five favorable
The pattern is the long tail. The adverse lines are those where claims take years to settle and are exposed to litigation, juries and medical cost: general liability, commercial auto, product liability. The favorable lines are mostly short-tail property and auto damage, plus workers' compensation, whose reserves have released for years. A company whose book is weighted to the adverse lines could have strengthened in 2025 while the industry released.
What is a one-year reserve redundancy, and what is two-year development?
A one-year reserve redundancy is negative one-year development: the reserves at the end of 2024 for accident years 2024 and earlier proved larger than the payments in 2025 plus the reserves still needed at the end of 2025. The NAIC's $20.0 billion figure is that redundancy across the industry. Two-year development compares the same claims with reserves held two year-ends earlier, at the end of 2023, and the NAIC's $13.5 billion is the two-year redundancy.
The two measures can tell different stories, and the difference is a diagnostic. The IRIS manual warns that results which keep showing adverse development, or a two-year ratio that keeps running worse than the one-year ratio, can mean an insurer is understating its reserves on purpose and paying the deficiencies as losses (NAIC IRIS Ratios Manual; the manual's words are quoted in IRIS ratios explained). A reserve that keeps being found short, a year at a time, is a pattern regulators look for.
What is IRIS ratio 11, and how do ratios 12 and 13 work?
IRIS ratio 11 is one-year reserve development divided by the prior year-end's policyholders' surplus, expressed as a percentage; a result of 20% or more is outside the NAIC's usual range. Ratio 12 is the two-year version against the surplus of the second prior year, with the same 20% line. Ratio 13 estimates the current reserve deficiency from the company's own developed reserves-to-premium ratios of the last two years, and flags at 25%. The NAIC generates them from each insurer's statutory annual statement.
The NAIC's three IRIS reserve ratios: what each measures, where it flags, and the 2025 industry medians
| Ratio | What it measures | Unusual at | 2025 median, all companies | 2025 median, defaults excluded |
|---|---|---|---|---|
| 11. One-year reserve development to surplus | Development on prior years during the latest year, against prior year-end surplus | 20% or more | 0 | −1 |
| 12. Two-year reserve development to surplus | Development over two years, against surplus two year-ends ago | 20% or more | 0 | −2 |
| 13. Estimated current reserve deficiency to surplus | Reserves the company’s own developed ratios imply, less reserves held, against surplus | 25% or more | 0 | −2 |
The medians are a reminder that most companies sit near zero and the tests are about outliers. The NAIC says a ratio outside its range "is not necessarily considered adverse" and that the ratios are not, in themselves, indicative of adverse financial conditions; for ratio 11 it adds that a significant increase might also point to reserve strengthening. When an appointed actuary's company has an unusual ratio 11, 12 or 13, the actuary must comment on the company-specific causes in the statement of actuarial opinion; what reserve strengthening means for earnings and for that comment is set out in what reserve strengthening is, and what a late quarter costs.
How do you find an insurer's reserve development?
In the annual statement's Schedule P. Part 2 of Schedule P shows incurred losses and defense and cost containment expense by accident year at successive year-ends, and the IRIS formulas take their one-year and two-year development from the annual statement's Part 2 totals. When reserves look deficient, the NAIC manual sends analysts to the same schedule: "The amount of deficiency for each line of business and accident year may be determined from Schedule P, Part 2" (NAIC IRIS Ratios Manual). Inside the company, the same question is answered faster and at a finer grain from the claim data.
Reading reserve development from the industry total down to the claims behind one accident year
| Level | Where to look | What it tells you | How often |
|---|---|---|---|
| Industry | NAIC full-year results: one-year and two-year development, development by line | Which lines strengthened and which released | Annually |
| Your company | IRIS ratios 11 to 13; Schedule P, Part 2 totals | Whether development is unusual against surplus | Annually, quarterly in your own close |
| Line and accident year | Schedule P, Part 2 by line | Which accident years moved, and by how much | Annually |
| Segment and month | Actual against expected development at each monthly evaluation, against the last signed review | When a cell left its expected range, and the unexpected in dollars | Weekly in Loss Development Monitoring |
| The claims behind it | The claims that moved, with the adjuster note, large-loss report or counsel letter passage that came first | Why it moved, in the claim file’s own words | Weekly in Loss Development Monitoring |
An industry that released $20 billion still had $10.4 billion of strengthening underneath. A company's own total can hide the same thing, one accident year at a time.
Why did commercial liability develop adversely?
The NAIC attributes the years of shrinking releases before 2025 mainly to adverse development in the commercial liability lines, driven by economic and social inflation (NAIC, 2025 Full Year Results). Economic inflation raises the cost of repairs, medical care and wages; social inflation, a term the NAIC uses for claim costs rising faster than general inflation because of litigation and larger awards, lengthens and enlarges liability claims. Both hit accident years that were reserved on older assumptions, which is why the effect shows up as prior-year development rather than only in current-year loss ratios.
Litigation funding is part of the picture regulators are watching. The Federal Insurance Office reports that since August 2025 four more states, California, New Hampshire, New York and North Carolina, have adopted reforms concerning third party litigation funding (FIO, 2026). For a reserving actuary, the practical consequence is that the drivers of adverse development in these lines show up first in the claim file, as attorney representation, suits, expert reports and demands, and only later in the triangle. The claim desk's side of the same story is in adverse reserve development, traced to the file.
The same split inside one book: favorable at the total, adverse underneath
What the 2025 industry figures show across lines, a reserving team sees inside its own book across accident years: a total that looks fine can hide one accident year running hot behind another running cold. On the sample casualty book, eight commercial casualty segments reported $45.8 million of development between the second-quarter review and the end of August against $36.3 million expected, $9.5 million more. Half of it was one accident year: contractors general liability, accident year 2024, at $4.9 million unexpected. At the same evaluation, workers' compensation for accident year 2023 was running $0.2 million below expectations after three claims closed under their reserves.
Every accident year outside its range, with what the claims say: four open flags at the August evaluation
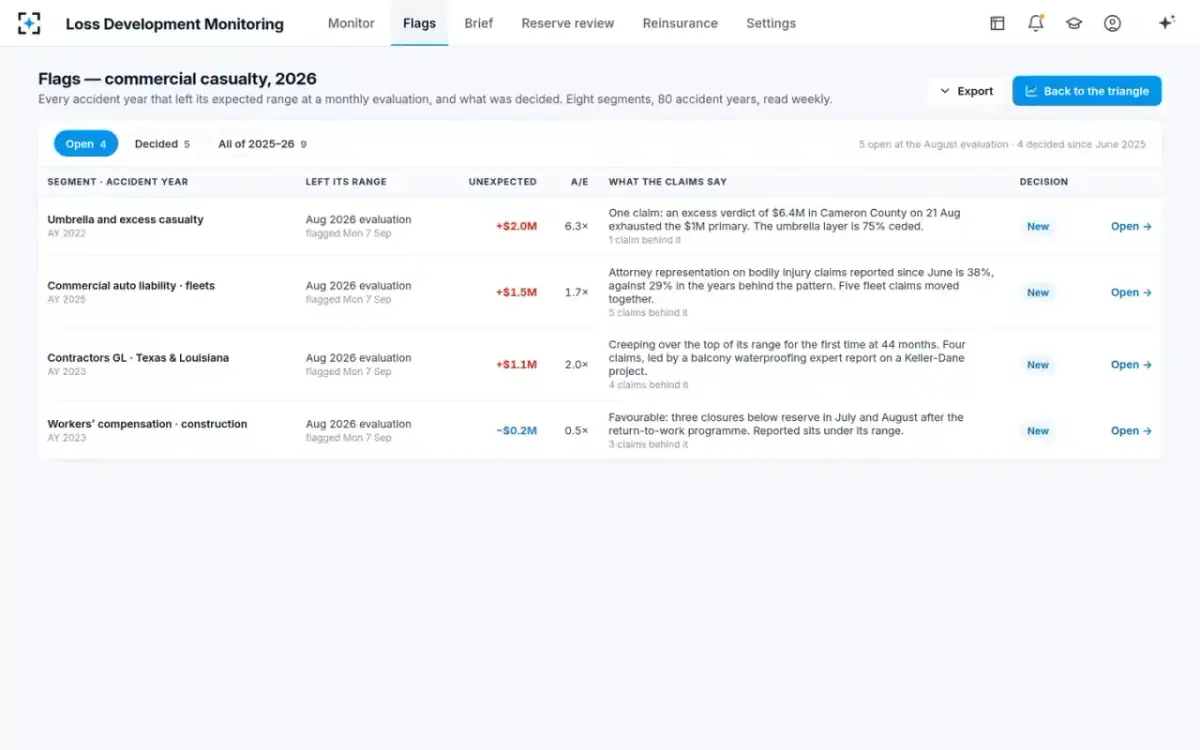
Each of those flags is the company-scale version of a line in the NAIC chart, with its reason attached. The umbrella flag is one verdict; the commercial auto flag is a rise in attorney representation that will carry into every future accident year; the contractors general liability flags are construction defect claims that were not in the expected loss ratio. A year-end Schedule P would show these as development on prior years. Seen in the month they emerge, they are questions for the next reserve committee, with time to answer them; terms of reference that make those questions standing items are drafted separately.
What 2025 means for reserving in 2026
The 2025 numbers are a reason for confidence at the industry level and for attention at the line level. The NAIC notes that reserve leverage, loss and LAE reserves to surplus, improved to 81.5% at year-end 2025 because surplus grew; a favorable year adds capacity. But the lines that strengthened are the long-tail lines whose next development will come from accident years written in the last few years, and those years are where a monthly comparison against the selected pattern pays off soonest.
Inside one segment: the cells that sit on their pattern and the one that does not
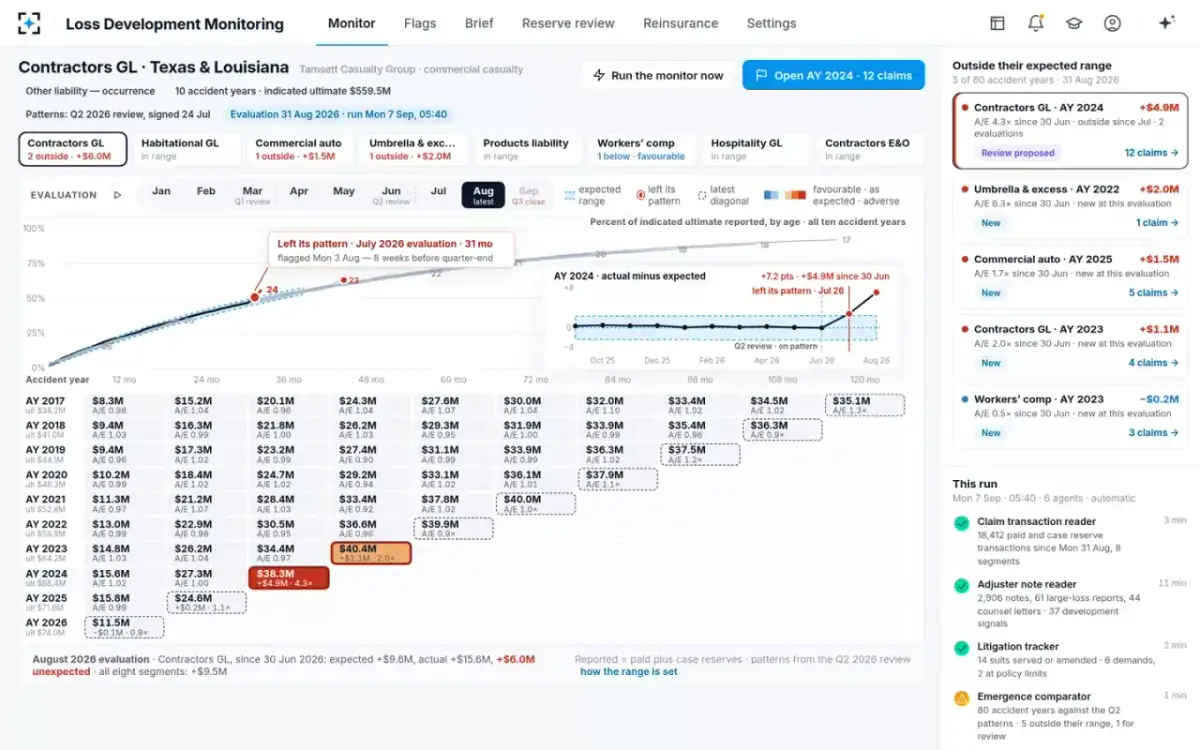
Loss Development Monitoring does that comparison every week: every segment and accident year against the last signed review's patterns, flags at the evaluation where a curve leaves its range, the claims and note passages behind each move, and the effect gross, ceded and net. It does not produce Schedule P, compute IRIS ratios or select reserves. It makes sure that by the time the year-end numbers are drawn, the accident years that will show as adverse development have already been explained.
Questions people ask
Is favorable reserve development good?
It adds to current earnings and means earlier reserves were prudent, so in moderation it is a sign of conservative reserving. Large or persistent releases can also mean reserves were held higher than needed, which regulators and analysts read alongside adverse years.
Where is prior year development reported in the annual statement?
In Schedule P, Part 2, which shows incurred losses and defense and cost containment expense by accident year at successive year-ends. The NAIC's IRIS manual sends analysts there to find a deficiency by line of business and accident year.
How large was 2025 reserve development for the US industry?
The NAIC reports a one-year redundancy of $20.0 billion and a two-year redundancy of $13.5 billion. Personal lines accounted for $15.9 billion of favorable development, while other liability on an occurrence basis developed adversely by $7,278 million.
What is the difference between reserve development and reserve strengthening?
Development is the measured change in prior-year estimates; strengthening is management's decision to raise the carried reserve. The NAIC's IRIS manual lists strengthening among the causes of an adverse two-year ratio, alongside reinsurance write-offs, commutations and discount changes.
What causes favorable development in workers' compensation?
The NAIC reports that workers' compensation reserves continued to develop favorably in 2025, with $6,651 million of prior-year releases in its chart. The report does not break down the causes, so a company should read its own accident years rather than assume the industry's.