IBNR software is software that estimates incurred but not reported losses, the part of the unpaid claim reserve for claims not yet reported and for further development on claims already reported, usually by projecting loss triangles with methods such as the chain ladder and Bornhuetter-Ferguson. Most of it computes the estimate at each valuation date. Watching that estimate between valuations is a different job, and it turns on rules: how far an accident year may move from its expected development before anyone is told, how large the move must be, and how long it must last before it goes to the reserve committee. In Botminds' Loss Development Monitoring those rules are eight settings owned by the reserving team, versioned, and applied from the next run. This guide explains each one, the default, and what changing it does, using a replay on public data to show the trade-offs.
The trade-off figures come from our own replay of an actual-versus-expected monitor on the Casualty Actuarial Society's Schedule P research data; the screens show a sample casualty book in the solution, with fictional companies and claims.
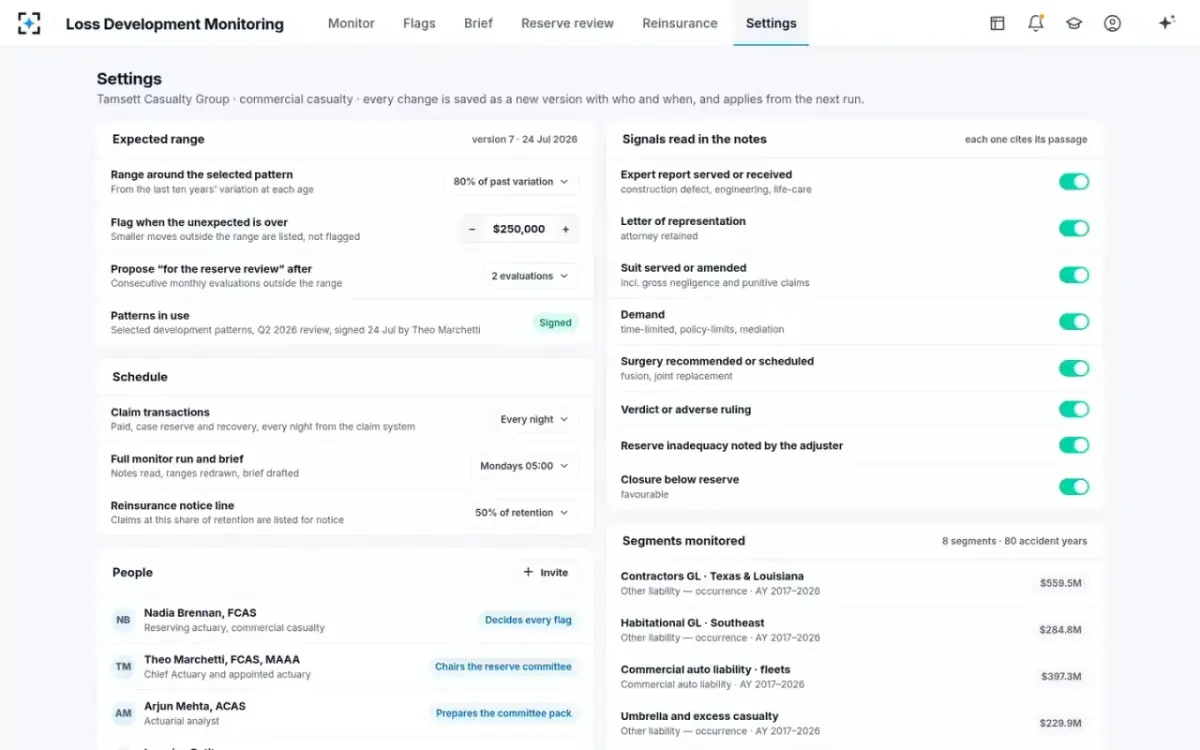
The eight settings that decide a flag in Loss Development Monitoring, with defaults and effects
| Setting | Default | Options | What changing it does |
|---|---|---|---|
| 1. Range around the selected pattern | 80% of past variation | 70% · 80% · 90%, from the last ten years at each age | Narrower catches more breaks and raises more false alarms; wider the reverse. |
| 2. Flag when the unexpected is over | $250,000 | $100,000 to $1,000,000 in $50,000 steps | Keeps small accident years quiet; moves outside the range below it are listed, not flagged. |
| 3. Propose the reserve review after | 2 evaluations | 1 · 2 · 3 consecutive monthly evaluations outside the range | Separates a bad month from a changed pattern. The actuary decides either way. |
| 4. Patterns in use | Last signed review | The selected patterns as signed by the chief actuary | Sets what expected means. Changing it re-bases every comparison. |
| 5. Claim transactions | Every night | Every hour · every night · every week | How fresh reported losses are between full runs. |
| 6. Full monitor run and summary | Mondays 05:00 | Mondays 05:00 · daily 05:00 · Fridays 17:00 | When notes are read, ranges redrawn and the weekly summary drafted. |
| 7. Reinsurance notice line | 50% of retention | 40% · 50% · 60% of retention | Which moving claims are listed for the reinsurance accountant to notify. |
| 8. Signals read in the notes | 8 signals on | Each switched on or off | Which events in adjuster notes and letters count as development signals. |
What is IBNR software, and how is IBNR calculated in it?
IBNR software calculates the reserve for losses incurred but not reported by projecting each accident year's losses to an ultimate and subtracting what has been reported. The arithmetic is standard: build paid and reported triangles, compute development factors, select a pattern and a tail, and apply methods such as the chain ladder, which develops reported losses with the factors, and Bornhuetter-Ferguson, which adds expected unreported losses from an a priori loss ratio to what has been reported. IBNR is then the selected ultimate less reported losses. ASOP No. 43 expects the actuary to consider multiple methods and to select them for the nature of the claims, their development characteristics and the data available (ASOP No. 43, section 3.6.1).
The output is a number at a date. What happens to that number over the following weeks, whether the accident years are emerging as the selection assumed, is not something the calculation tells you; it is something you watch for. The settings below are what turn IBNR software from a calculator into a watch.
Can IBNR software monitor monthly?
It can if it has monthly expected development, which is harder than it sounds when patterns are selected annually. The CAS study text says so directly: "for insurers who only have annual claim development data, linear interpolation of annual development patterns is usually not appropriate, particularly for the most immature accident years" (Friedland, CAS). Insurers with quarterly development data can interpolate between quarters for monthly monitoring; the youngest accident years, whose development within the first year is uneven, need the most care.
Loss Development Monitoring compares at monthly evaluations against the selected patterns of the last signed review, and runs the comparison every week. The schedule settings, five and six in the table, decide how fresh the data is: claim transactions roll up every night by default, and the full run, in which notes are read, ranges redrawn and the weekly summary drafted, happens on Monday mornings. A team that closes monthly may prefer daily runs at month-end; one with thin weekly volume may prefer Fridays.
How wide should an expected range be?
Wide enough that ordinary months stay inside it, narrow enough that a real break does not. The solution draws the range at each age from the past ten years' variation and lets the team choose how much of it to cover: 70%, 80% or 90%. A wider range means fewer flags, fewer false alarms and fewer adverse years caught early. Our replay of an actual-versus-expected monitor on the CAS Schedule P research data shows the trade in numbers.
Range width on closed data: wider ranges flag less and catch less, at much the same precision
| Range covers | Accident years flagged in year 1 (1997 / 2007 data) | Of those, later adverse | Adverse years caught by a year-1 flag |
|---|---|---|---|
| 70% of past variation | 323 / 389 | 49.8% / 57.3% | 37.2% / 47.6% |
| 80% of past variation (default) | 259 / 327 | 51.7% / 57.5% | 30.9% / 40.2% |
| 90% of past variation | 219 / 276 | 51.6% / 55.1% | 26.1% / 32.5% |
The striking result is that precision barely moves with the range: about half of first-year flags preceded adverse development at every width. What moves is coverage. Narrowing from 90% to 70% caught roughly ten to fifteen percentage points more of the adverse accident years and raised the number of flags by 40% to 50%. A team that can afford to read more flags gains coverage; one that cannot should keep the default and lean on persistence. The full method is in replaying a reserve monitor on closed years.
What thresholds should trigger a reserve review?
Two: a dollar floor on the unexpected, so that only material moves are flagged, and a persistence rule, so that only moves that last go to the review. In the replay, adding a modest floor did more for precision than any range width. With no floor, 44.2% of first-year flags in the 1997 data preceded adverse development; with a floor of 1% of the selected ultimate, 51.7%; with 3%, 57.7%. Persistence did more still: accident years flagged two years running later developed adversely about four times in five at the 1% floor.
Share of flags followed by adverse development, by dollar floor and persistence (1997 data)
Those results map onto the solution's defaults. The dollar floor is $250,000, adjustable from $100,000 to $1 million; moves outside the range below the floor are listed but not flagged, so nothing is hidden. The persistence rule proposes the reserve review after two consecutive monthly evaluations outside the range, adjustable to one or three. On the sample book, contractors general liability accident year 2024 left its range at the July evaluation with $1.9 million unexpected and stayed out at August's with $4.9 million, so the agents proposed the review; the reserving actuary decided. How expected and unexpected are calculated for each cell is in actual vs expected, cell by cell.
The settings screen: the reserving team's rules, each change a new version
Patterns in use: what expected is measured against
The fourth setting decides the meaning of every flag: expected development comes only from the selected patterns and indicated ultimates of the last signed review. On the sample book that is the second-quarter 2026 review, signed on 24 July by the chief actuary. Agents cannot edit the patterns, the ultimates or the indications; when the next review is signed, the team switches the setting and every comparison re-bases from the next run. Comparing against the pattern the committee actually approved, rather than a pattern a tool fits for itself, is what makes a flag a statement about the reserve the company carries.
It also means a monitor cannot correct a wrong pattern on its own. If the selected pattern understates development at every age, every month can sit inside its range while the reserve drifts. That is a question for the review, not for the monitor, and it is why the annual review should look at the monitor's history: cells that sat at the top of their range month after month are telling the actuary something even without a flag.
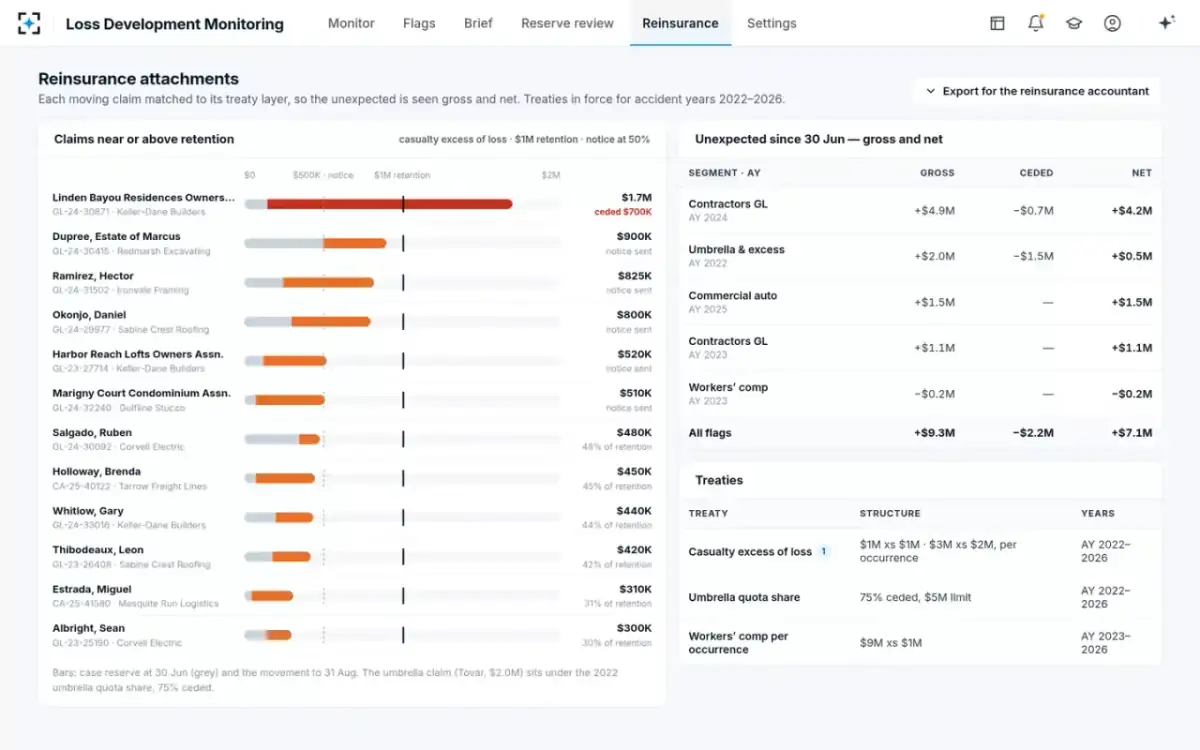
The reinsurance notice line: gross, ceded and net in the same flag
The seventh setting lists every moving claim that reaches a share of its treaty retention, 50% by default, for the reinsurance accountant to notify under the treaty's terms. It exists because reserving and ceded reinsurance look at the same claims for different reasons. The CAS study text tells reserving actuaries to examine large claims to confirm that retentions and limits for ceded claims are consistent with the excess of loss contracts, calling that verification "an important part of ensuring that the ceded and/or net claim triangles are correct" (Friedland, CAS).
Every moving claim against its layer, with the notice line drawn
Can IBNR software read adjuster notes? Setting eight, the signals
Traditional IBNR software does not; it works on transactions and counts. Loss Development Monitoring reads adjuster notes, large-loss reports and defense counsel letters, and the eighth setting decides which events count as development signals. Each signal is marked with its date, amount and the passage it came from; the reader never infers a signal the text does not state. On the sample book, the twelve claims behind the accident year 2024 break each carried a signal a median of 15 days before the case reserve moved.
The eight signals the note reader can mark, and why each one matters to the reserve
- Expert report served or received
Construction defect, engineering or life-care reports put a number on the claim, sometimes before the adjuster does.
- Letter of representation
An attorney retained changes the likely cost and duration of a bodily injury claim.
- Suit served or amended
Including amendments that plead gross negligence or punitive claims.
- Demand
Time-limited, policy-limits or mediation demands, each with a figure and often a deadline.
- Surgery recommended or scheduled
Fusions and joint replacements move medical and wage loss estimates in one step.
- Verdict or adverse ruling
Often the largest single moves on a book, and the likeliest to reach a reinsurance layer.
- Reserve inadequacy noted by the adjuster
The adjuster recording that the reserve is short is a signal in itself, before the reserve changes.
- Closure below reserve
The favourable signal: claims closing under their reserves can explain a cell running cold.
A flag rule written down as settings is a rule the committee can read, the auditors can test and the next actuary can inherit. A rule that lives in someone's head is none of those.
Who should approve changes to reserving thresholds?
The reserving team should own the thresholds, and changes to them should be versioned and visible, because a change in a threshold changes what the committee hears. ASOP No. 56 requires the actuary to use, or rely on others to use, "reasonable governance and controls to mitigate model risk", and its informational appendix lists examples including limits on who can modify a model and "implementing a model change management process" (ASOP No. 56). For a monitor that means the range, the floor, the persistence rule and the signals are changed deliberately, recorded with who and when, and never changed to make a flag go away.
In Loss Development Monitoring every settings change is saved as a new version with who made it and when, and applies from the next run, so the history of a flag can always be read against the rules in force when it was raised. The patterns in use are the chief actuary's signed selections. Who decides each flag, and what the reserve committee should receive, is set out in reserving committee terms of reference.
What to look for when buying IBNR software that watches
Look for rules you can read and change, arithmetic you can reproduce, and evidence you can open. The settings should be the reserving team's, not the vendor's; every flag should show expected, actual, the range and the A/E; every signal should cite its passage; and the whole thing should be testable on your own closed months before it speaks to a committee. Ask how a setting change is recorded and whether it re-runs history or applies forward; ask what happens to moves below the floor; ask whether it can show a flag gross, ceded and net.
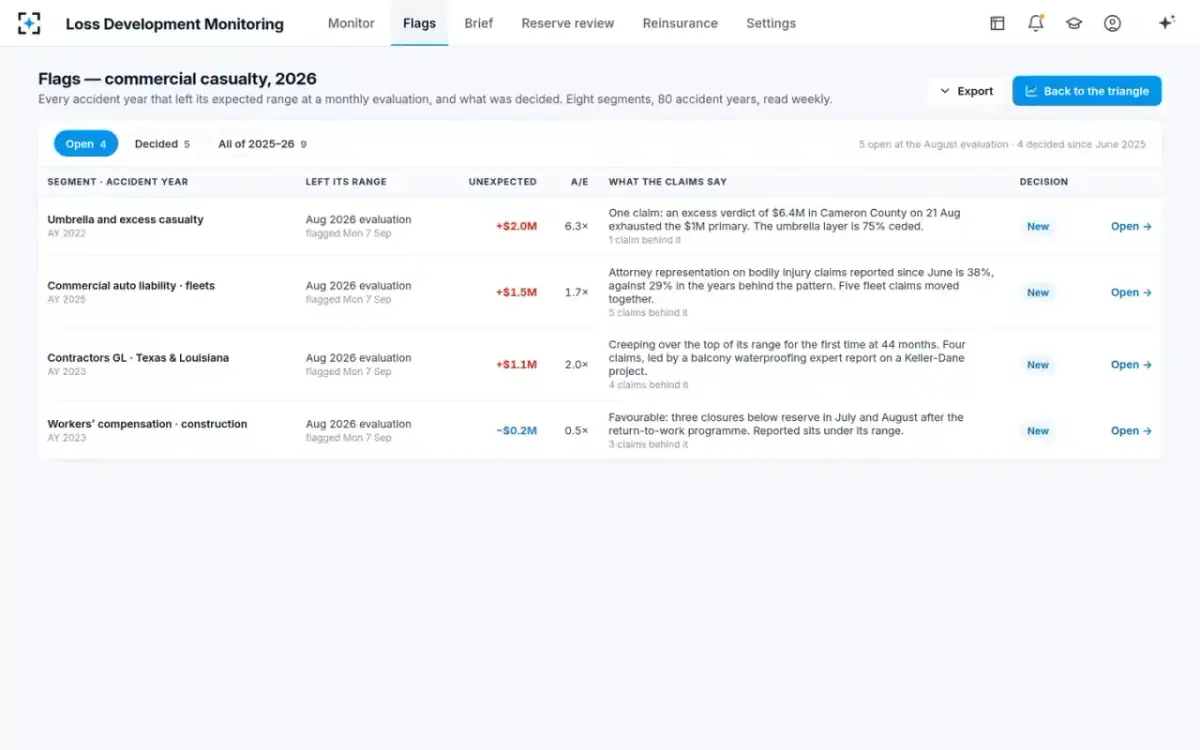
What the settings produce: every accident year outside its range, and what was decided
Loss Development Monitoring is built for a reserving team that already computes IBNR in its own tools and wants the weeks between reviews watched under its own rules. It needs a claim transaction feed, the last signed patterns and ultimates, readable notes and, for net figures, the treaty register. It does not compute the quarter's IBNR or select it, and it does not replace the reserving system that does. How its six agents work through a week is traced in AI in actuarial reserving, one run step by step.
Questions people ask
What is the difference between IBNR and IBNER?
Narrowly, IBNR is the reserve for claims that have occurred but not yet been reported; IBNER is further development expected on claims already reported. Actuaries often use IBNR in the broad sense to cover both, since methods applied to reported losses project both together.
How often should IBNR be updated?
IBNR is booked every quarter for the quarterly statements, but the CAS study text notes that only some very large companies run detailed analyses each quarter; many roll forward between complete analyses and compare actual with expected claims in between. A detailed analysis supports the annual actuarial opinion.
What is a reasonable dollar threshold for a reserve flag?
One that keeps small accident years quiet without hiding material moves; it depends on segment size. Loss Development Monitoring defaults to $250,000 of unexpected development, adjustable from $100,000 to $1 million, and lists moves below the floor without flagging them.
Should a monitor flag favourable development too?
Yes. A cell running below its range may mean claims closing under reserve or a change in reporting, and either affects the next selection. On the sample book, a workers' compensation accident year was flagged at $0.2 million below expected after three closures under reserve.
Can thresholds be different by segment?
The range is drawn from each cell's own history at each age, so it already differs by segment and age. A single dollar floor applies to the book in the sample settings; teams with very different segment sizes should test whether one floor suits all of them.
What data does IBNR monitoring software need?
Paid, case reserve and recovery transactions with accident dates, the last review's signed selected patterns and indicated ultimates, and segment definitions. To explain flags it needs adjuster notes, large-loss reports and counsel letters; to show figures net, the treaty layers by accident year.