Actual vs expected in actuarial reserving is the comparison of the losses that actually emerged for an accident year between two valuations with the losses the last review's selected pattern and ultimate said should emerge. For each accident year, expected emergence in the period equals the expected unreported losses at the start times the share of the remaining pattern due in the period; actual emergence is the change in reported (or paid) losses; the difference is the unexpected development, and actual divided by expected is the A/E ratio. Done for every segment and accident year, it shows where the last review's selections are holding and where they are not, which is why it is the first exhibit of most reserve updates. Botminds' Loss Development Monitoring runs this calculation every week for every cell, against the signed selected patterns, and shows its arithmetic on each one.
The formulas below are the Casualty Actuarial Society's; the worked figures come from the CAS study text, a CAS paper on actual-versus-expected reviews, and a sample casualty book in the solution with fictional companies and claims.
Actual vs expected, calculated on three cells: one quiet, one breaking, one broken
| Cell | Expected emergence | Actual emergence | Unexpected | A/E | Inside its range? |
|---|---|---|---|---|---|
| Accident year 2021, 36 to 48 months | +$5.4M | +$5.0M | −$0.4M | 0.9 | Yes: 63.3% reported, range 61.0%–65.8% |
| Accident year 2024, July 2026 (31 months) | about +$0.7M | about +$2.6M | +$1.9M | 3.6 | No: 50.6% reported, range 45.3%–50.2% |
| Accident year 2024, July and August 2026 | +$1.5M | +$6.4M | +$4.9M | 4.3 | No: second evaluation outside |
How do you calculate actual vs expected in reserving?
Take the selected ultimate and selected development pattern from the last review, compute the losses each accident year was expected to report (or pay) in the period, and subtract that from what it actually reported. The CAS study text gives the formula for expected reported claims in a calendar year, for each accident year: "[(ultimate claims selected at December 31, 2007 – actual reported claims at December 31, 2007) / (% unreported at December 31, 2007)] x (% reported at December 31, 2008 - % reported at December 31, 2007)" (Friedland, CAS, chapter 15).
In words: the losses still to be reported at the start, scaled up to the whole remaining pattern, times the part of the pattern due in the period. The text's own example for accident year 2007 during calendar year 2008 is {[($2,798 − $2,463) ÷ (1 − 0.880)] × (0.999 − 0.880)} = $332, in the exhibit's units. If the accident year had then reported $500 in 2008, the unexpected would be +$168 and the A/E 1.51; at $200 reported, −$132 and 0.60. The percentages unreported come from the selected pattern as one minus the reciprocal of the cumulative development factor.
The same arithmetic runs at any frequency, provided the pattern exists at that frequency. That is the practical difficulty, not the formula. Monthly actual-versus-expected needs a monthly selected pattern; the CAS text warns that interpolating annual patterns linearly is usually inappropriate for the youngest years, and quotes Bornhuetter and Ferguson's suggestion that, absent data, development of the newest accident year by quarter might be assumed skewed, "say 40% at three months, 70% at six months, 85% at nine months, 100% at 12 months" (Friedland, CAS).
What is expected emergence?
Expected emergence is the development the last review's selections imply for a period: the losses the accident year should report (or pay) between two evaluations if the selected ultimate and pattern are right. It is the Bornhuetter-Ferguson idea applied to a short interval. The expected unreported amount is fixed at the start of the period, so expected emergence does not depend on what the accident year happens to report during it; a hot month does not raise its own expectation.
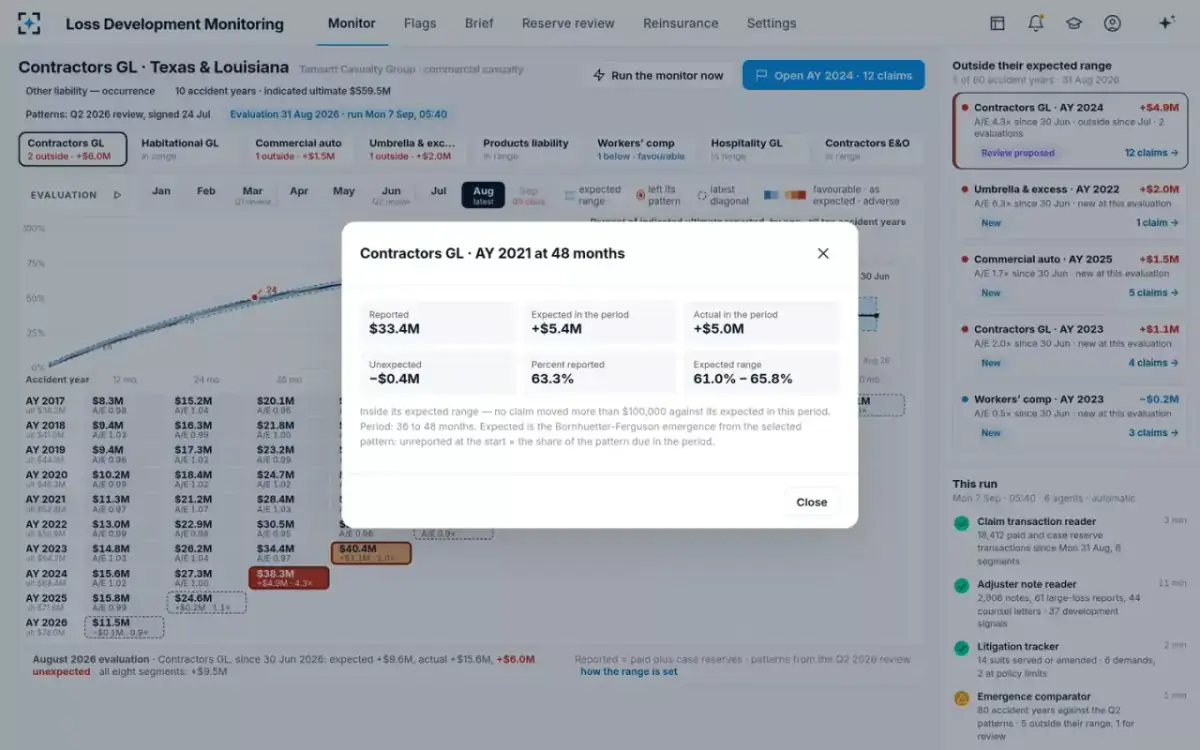
That is why Loss Development Monitoring uses it. On the sample book, the cell detail for accident year 2021 between 36 and 48 months reads: expected in the period +$5.4 million, actual +$5.0 million, unexpected −$0.4 million, 63.3% reported against an expected range of 61.0% to 65.8%, with the note "Expected is the Bornhuetter-Ferguson emergence from the selected pattern". Every number the actuary needs to reproduce it is on the screen.
One cell, opened: expected, actual, unexpected, percent reported and the range
Direct or indirect expected: why the same data gives two answers
There are two common ways to compute expected, and they disagree whenever the selected ultimate differs from a pure development projection. A 2013 CAS E-Forum paper by Jennifer Balester and Gerald Kirschner calls them "direct" emergence, which projects from the actual losses at the start with the development factors, and "indirect" or "percent of reserves" emergence, which works from the selected ultimate as the CAS study text does. The authors put it plainly: "Differences only arise when selected ultimate losses are different than the direct development ultimate loss value" (Balester & Kirschner, CAS E-Forum).
The same accident year, two expecteds: actual is below one and above the other
Direct emergence (from actual losses): Incurred at time 1: 1,400. Development factor to ultimate 1.750, so a direct projection of 2,450.
Indirect emergence (from the selected ultimate): Selected ultimate 2,000, below the direct projection. Incurred at time 1: 1,400, 57.1% of the pattern.
Direct emergence (from actual losses): 1,400 × (1.750 ÷ 1.167) = 2,100.
Indirect emergence (from the selected ultimate): 600 ÷ (1 − 0.571) × (0.857 − 0.571) + 1,400 = 1,800.
Direct emergence (from actual losses): 2,000.
Indirect emergence (from the selected ultimate): 2,000.
Direct emergence (from actual losses): −100: losses emerged more slowly than the factors implied.
Indirect emergence (from the selected ultimate): +200: losses emerged faster than the selected ultimate implied.
Direct emergence (from actual losses): Subsequent development may also be lower than the factors imply.
Indirect emergence (from the selected ultimate): The selected ultimate may be too low and should be increased.
The paper's reading of the indirect result is the one a monitor cares about: actual losses "have emerged more quickly than our selected ultimate loss pick would have led us to expect", which "might reasonably suggest that our selected ultimate loss pick was too low". Because a monitor's job is to test the last review's selections, the indirect, Bornhuetter-Ferguson form is the right expected for it; the direct form tests the factors rather than the ultimate. Where the selected ultimate equals the chain ladder projection, the two agree.
What is an A/E ratio in reserving, and why dollars matter more?
The A/E ratio is actual emergence divided by expected emergence for a cell over a period: 1.0 means the selection is holding exactly, above 1.0 means more emerged than expected. It is the quickest way to scan a triangle, and the most misleading one used alone, because a small expected inflates the ratio. Late accident-year ages expect little emergence, so a single claim can push A/E to 6 or more on a few hundred thousand dollars. The unexpected dollars, actual minus expected, say how much the movement matters to the reserve.
A/E ranks the sample book's flags differently from the dollars they move
The bars make the point. The highest A/E on the book, 6.3, is one umbrella verdict worth $2.0 million gross and 75% ceded. The lowest adverse A/E, 1.7, is commercial auto, where attorney representation on new bodily injury claims had risen to 38% against 29% in the pattern years, a change that would carry into every future accident year. A monitor should rank by dollars and read the reason before the ratio. That is also why the solution's flag rule combines a range test with a dollar threshold, $250,000 by default.
Why do paid and incurred actual vs expected differ?
Because they test different things. Incurred (paid plus case reserves) actual-versus-expected moves when case reserves change, and paid moves when claims settle. If a claim department strengthens case reserves, incurred runs hot while paid does not; if it settles faster, paid runs hot while incurred may not. Balester and Kirschner make the comparison a standing question of any update: "Are there any significant differences between the actual versus expected results for incurred versus paid claims emergence?" (Balester & Kirschner).
On the sample book the twelve claims behind the accident year 2024 break show the incurred side clearly. The flagged accident year reported $6.4 million in July and August, of which $2.1 million was paid and $4.3 million was case reserve change; the largest claim's case reserve went from $150,000 to $1.7 million with nothing paid on indemnity. Paid actual-versus-expected alone would have shown a modest move. Whether a case reserve change reflects new information or a change in reserving practice is a claim-side question, and the claim notes are where to answer it; the signals the notes carry, and how far they lead the reserve, are covered in the note that comes before the reserve.
A/E tells you where to look. The unexpected dollars tell you whether it matters. The claims tell you why. A monitor that stops at the first is a heat map, not a reserving tool.
What is a good threshold for an actual vs expected flag?
A good threshold has three parts: a range drawn from the cell's own history at that age, a dollar floor, and a persistence rule. The range keeps noise out: a 10% deviation at 12 months is normal for a liability line and alarming at 96 months. The floor keeps small accident years quiet. Persistence separates a bad month from a changed pattern. Loss Development Monitoring's defaults are a range covering 80% of the past ten years' variation at each age, a $250,000 floor on the unexpected, and a proposal for the reserve review after two consecutive monthly evaluations outside the range; all three are the reserving team's settings.
Those choices can be tested. In our replay of an actual-versus-expected monitor on the CAS Schedule P research data, accident years flagged once in the year after a review later developed adversely about twice as often as unflagged ones, and two consecutive flags lifted that to roughly four in five; a narrower range caught more adverse years at the cost of more false alarms. The method and the trade-offs are in replaying a reserve monitor on closed years, and each setting is explained in the eight settings that decide a flag.
How often should actual vs expected be run?
At every evaluation the data supports, and at least monthly between quarterly reviews for long-tail lines. The CAS study text notes that while some very large companies analyse quarterly, many actuaries use roll-forward analyses between complete analyses to compare actual with expected claims. Running it more often costs little once transactions are rolled up automatically; the cost is in reading the results, which is why a monitor should rank cells by unexpected dollars and attach the claims behind each flag rather than produce a heat map to be interpreted.
On the sample book the comparison runs every Monday on the month-end evaluations. The accident year 2024 break shows why monthly matters: inside its range at the June evaluation, outside it at July's, and still outside at August's, so the reserving actuary had the first warning eight weeks before the third quarter closed, and the two consecutive evaluations the persistence rule needs three weeks before it.
What does actual vs expected tell you about ultimate losses?
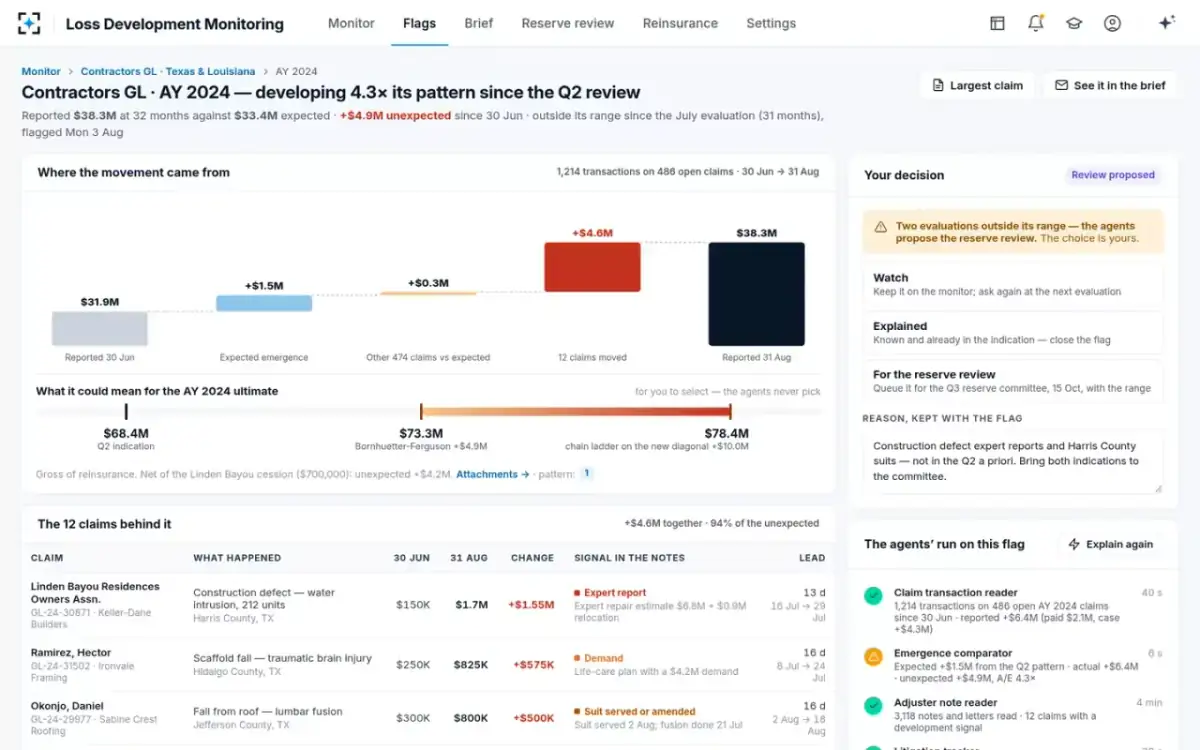
It tells you which way the ultimate may move and roughly by how much, but not which answer to choose. A Bornhuetter-Ferguson reading adds the unexpected to the old ultimate on the view that the future pattern is unchanged; a chain ladder reading develops the new, higher diagonal and assumes the acceleration continues. On the sample accident year, the two gave $73.3 million and $78.4 million against $68.4 million at the second-quarter review, a range of $4.9 million to $10.0 million of strengthening. The flag shows both and selects neither.
From AvE to the ultimate: the bridge, the two readings, and the decision left to the actuary
Regulators expect this granularity when the estimate does move. The NAIC's Actuarial Opinion Working Group asks the appointed actuary to discuss significant changes in total estimates and adds: "However, an explanation should also be included for any significant fluctuations within accident years or segments" (NAIC AOWG, 2026). An actual-versus-expected exhibit by cell, with the claims behind each move, is that explanation built as the year goes.
How Loss Development Monitoring runs actual vs expected
Each night the claim transaction reader rolls paid, case reserve and recovery transactions into cumulative reported losses by segment, accident year and month, reconciled to the general ledger at month-end. Each week the emergence comparator computes expected emergence for every cell from the last review's signed selected pattern and indicated ultimate, draws the expected range at each age from the past ten years' variation, and marks the evaluation where a curve leaves its range. When a flagged cell is opened, the unexpected is attributed to the claims that moved, and the adjuster note reader shows the signals behind them with their passages.
The selected patterns, ultimates and indications are read-only to every agent, and every flag shows expected, actual, the range and the A/E with the walk from the last review. The reserving actuary marks each flag watched, explained or for the reserve review. What the comparison cannot do is choose between the Bornhuetter-Ferguson and chain ladder readings, or know about a change the claim file has not yet recorded; those remain the actuary's, as they were before.
Questions people ask
What is the formula for expected emergence?
For each accident year: (selected ultimate − reported at the start) ÷ (% unreported at the start) × (% reported at the end − % reported at the start), with the percentages from the selected pattern. It is the CAS study text's formula and the Bornhuetter-Ferguson view of the period.
What does an A/E of 1.2 mean?
That 20% more emerged in the period than the last review's selections expected. Whether it matters depends on the dollars and on the cell's normal variation at that age: at a young age it may be noise, at a mature age it is rarely random.
Is actual vs expected done on paid or incurred losses?
Both, ideally. Incurred reacts to case reserve changes and paid to settlements, so comparing the two separates a change in claims practice from a change in claim costs; the CAS literature treats a difference between them as a question to investigate.
How is the expected range for a cell set?
Usually from the historical variation of development at the same age, for example the spread of past age-to-age factors or percentages reported. Loss Development Monitoring's default covers 80% of the past ten years' variation at each age, with 70% and 90% as alternatives.
What is the difference between actual vs expected and a roll-forward?
A roll-forward carries the last review's ultimates to a new date, adjusting reserves for payments and expected emergence; actual vs expected measures how far real emergence departed from that expectation. The roll-forward produces a number; the comparison tells you whether to trust it.