Actuarial reserving software is the system a reserving team uses to build loss triangles, run the chain ladder, Bornhuetter-Ferguson and other methods, select development factors and ultimates, and produce the exhibits for the reserve review and the actuarial opinion. It answers the quarter's question: what are the unpaid claims at this valuation date? It does not, on its own, answer the question between valuations: is any segment developing away from what we selected, and why? That second question is what a monitor such as Botminds' Loss Development Monitoring answers, by comparing actual with expected development for every segment and accident year each week and attributing any break to the claims and adjuster notes behind it. The two are complements; choosing well means knowing which question each tool is built for.
To make the difference concrete, this guide takes one accident year from a sample casualty book in the solution, with fictional companies and claims, and runs it through four approaches. The standards cited are the Actuarial Standards Board's; the methods are those the Casualty Actuarial Society teaches.
Four ways to catch a reserving break, compared on the questions a head of reserving asks
| Spreadsheet triangles | Reserving software | Stochastic model | Between-reviews monitor | |
|---|---|---|---|---|
| Question it answers | What are the indications this quarter? | What are the indications, selections and exhibits this quarter? | How uncertain is the estimate? | Is anything moving away from the selection, and why? |
| Cadence in practice | Quarterly or annual, after the data is triangulated | Quarterly or annual; many teams add roll-forwards between | Annual or at capital and opinion work | Weekly or monthly, on transactions as they post |
| Explains a movement | Only by hand, from claim files | Diagnostics show where; claim files say why | No; it widens or narrows a distribution | Attributes the unexpected to claims and cites the note passages |
| Who selects | The actuary | The actuary | The actuary chooses the model and percentile | The actuary; the monitor reads selections, never sets them |
| Strong at | Flexibility, transparency, low cost | Control, audit trail, method library, exhibits | Ranges, risk margins, capital | Speed of detection, the reason behind a move |
| Weak at | Key-person risk, version control, scale | Seeing development between valuations | Explaining; environmental change | Selecting; anything not yet in the claim file |
What does actuarial reserving software do?
Reserving software turns claim data into the actuary's analysis: it builds paid, incurred and count triangles by segment, computes age-to-age factors and averages, runs a library of methods, lets the actuary select factors, tails and ultimates with a documented rationale, and produces the exhibits the reserve review and the statutory opinion need. Its value is control: one set of data, versioned selections, an audit trail and exhibits that tie. That matches what ASOP No. 43 asks of the actuary, to consider multiple methods and to disclose when a material component rests on a single one: "If for any material component of the unpaid claim estimate the actuary does not use multiple methods or models, the actuary should disclose and discuss the rationale for this decision in the actuarial communication" (ASOP No. 43, section 3.6.1).
What it does between valuations depends on how it is fed. Many teams run a roll-forward: last review's ultimates carried forward, with actual emergence compared to expected at quarter-end or month-end. The CAS study text describes these roll-forwards and their main obstacle, monthly expected emergence when patterns are annual, in its chapter on monitoring (Friedland, CAS). In many teams the comparison is run when someone has time, at the level of the segment total, without reading the claims behind it.
Is Excel enough for loss reserving?
For a small book with a few segments and a careful actuary, a spreadsheet can produce sound indications; ASOP No. 43 is about the actuary's judgment, not the tool. The standard draws a line elsewhere, between purposes: "an unpaid claim estimate produced by a simple methodology may be appropriate for an immediate internal use. The same methodology may be inappropriate for external financial reporting purposes" (ASOP No. 43). Spreadsheets fail on scale and control rather than on mathematics: links that break, versions that multiply, selections without a reason beside them, and one person who knows how the workbook works.
For monitoring, the spreadsheet's real limit is labour. Comparing eighty accident years every month, reading the notes on every claim that moved and keeping a decision trail is possible by hand and rarely done. When it is skipped, the spreadsheet sees development at the next quarterly diagonal, the same as everything else.
What is stochastic loss reserving, and what does it add?
Stochastic loss reserving fits a statistical model to the triangle, such as the bootstrap chain ladder or a Bayesian model, and produces a distribution of outcomes instead of a point. It adds what point methods cannot: ranges, percentiles for risk margins and capital, and a formal sense of how unusual a new diagonal is. It does not add an explanation, and the most-cited test of such models on closed US data found that none could be declared best; Meyers and Shi concluded that environmental changes no single model can identify mean stochastic models cannot carry reserve risk management on their own (Meyers & Shi, CAS E-Forum).
A distribution can also be too generous to a real break. A 4.3-times emergence on one accident year of a ten-year triangle may sit inside a wide predictive interval for the segment total and raise no alarm, even though, at the cell level, it is far outside anything the past ten years produced at that age. Monitoring and stochastic modelling answer adjacent questions; the second does not substitute for the first. A replay of a cell-level monitor on the same CAS research data is in replaying a reserve monitor on closed years.
One accident year through all four: who would have seen the break, and when?
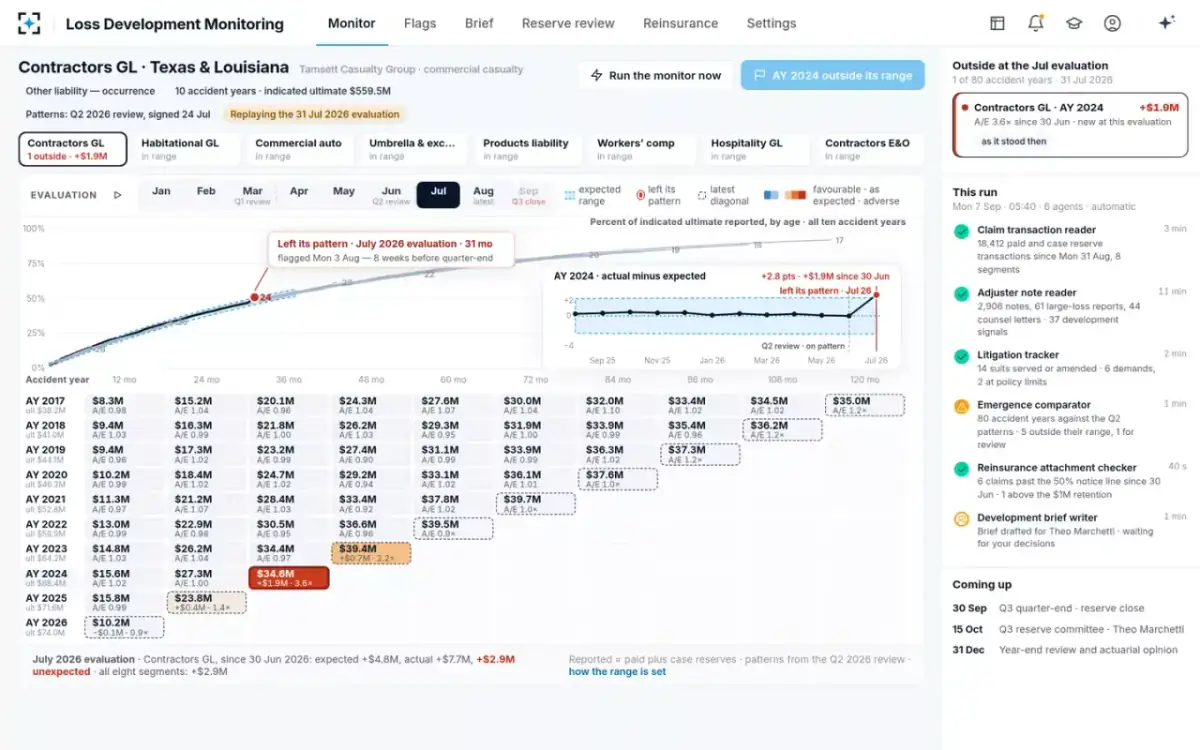
On the sample book, contractors general liability for accident year 2024 sat exactly on its pattern at the June evaluation that the second-quarter review saw. At the July evaluation, at 31 months, it reported 50.6% of its indicated ultimate against an expected range of 45.3% to 50.2%. By the end of August it had reported $6.4 million since 30 June against $1.5 million expected, $4.6 million of it from twelve claims. The question for any tool is when it would have shown the reserving actuary this, and with what.
When each approach shows the reserving actuary the sample accident year's break
- Quarter not comparedto 30 Sep
- By hand13 d
- Quarter not comparedto 30 Sep
- Run8 d
- Run at the annual cyclenot before the next run
- On patternto 3 Aug
- Flagged with its claims3 Aug onward
The figure's point is not that reserving software is slow; once the data arrives it runs the quarter in hours. It is that every quarterly tool shares the quarterly data clock, so a break in the first month of a quarter is invisible until the quarter closes. Only a tool that compares on the transactions as they post, at the cell level, sees it in the month it happens. And only a tool that reads the claim files can say, the same week, that three of the twelve claims were construction defect cases where a plaintiff's expert report preceded the reserve change.
The break as the monitor saw it: the July evaluation, replayed
What is the difference between reserving software and a reserve monitor?
Reserving software produces the selection; a monitor tests it between reviews. The software's output is the input the monitor watches against: the signed selected patterns and indicated ultimates from the last review. The monitor's output is the input the next review starts from: which cells broke, by how much, and which claims caused it. Neither replaces the other, and a team that buys a monitor expecting it to set reserves, or buys reserving software expecting it to watch the weeks between, will be disappointed.
Reserving software and Loss Development Monitoring: what each owns in the reserving cycle
Actuarial reserving software: Triangles at the valuation date, reconciled for the review.
Loss Development Monitoring: Every paid, case reserve and recovery transaction each night, reconciled to the general ledger at month-end.
Actuarial reserving software: Chain ladder, Bornhuetter-Ferguson, Cape Cod, frequency-severity and more, with selections.
Loss Development Monitoring: Expected emergence from the signed pattern; Bornhuetter-Ferguson and chain ladder indications shown side by side, never selected.
Actuarial reserving software: Each quarterly or annual review.
Loss Development Monitoring: A full run every week, every segment and accident year, each monthly evaluation.
Actuarial reserving software: Diagnostics by triangle; the reason comes from the claim department.
Loss Development Monitoring: Unexpected attributed to the claims that moved, with the note passages and how many days they led the reserve.
Actuarial reserving software: The actuary selects and documents.
Loss Development Monitoring: The actuary marks each flag watched, explained or for the reserve review, with the reason kept.
Can reserving software read claim notes?
Traditional reserving software works on structured data: transactions, counts, premiums and exposures. Claim notes, large-loss reports and defense counsel letters are text, and until recently reading them at scale was not practical. That is the gap Loss Development Monitoring fills. Its adjuster note reader marks development signals, such as an expert report, a letter of representation, a suit served or amended, a demand, a surgery or a verdict, each with its date, amount and the passage it came from; it never infers a signal the text does not state. On the sample book the twelve claims behind the break each had such a signal, a median of 15 days before the case reserve moved.
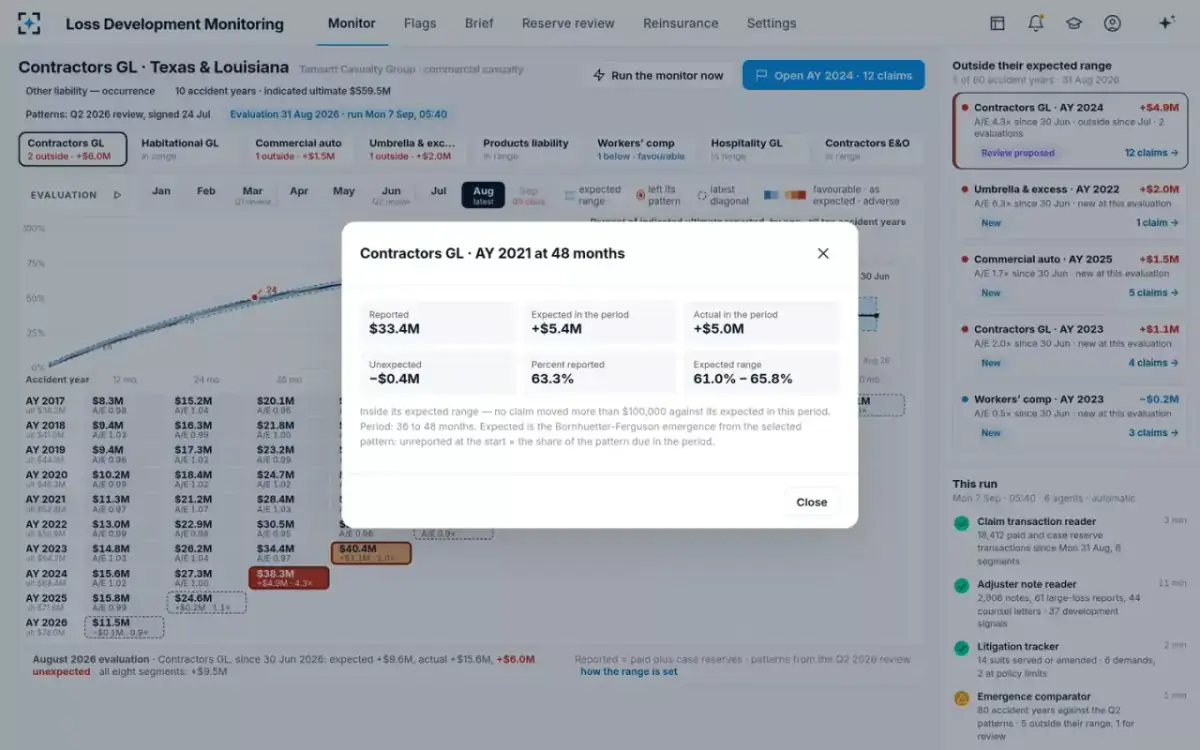
The difference shows when the reserving actuary goes to the committee. With software alone, the analysis says the accident year is up; the reason is a meeting with claims. With a monitor that reads the files, the reason is already there: three expert reports, three demands, three suits and three letters of representation, each linked to its passage. How the arithmetic behind the flag works, cell by cell, is in actual vs expected in actuarial reserving.
Any cell, with its arithmetic: the check a reserving team runs before trusting a monitor
Do reserving tools replace the actuary?
No, and the actuarial standards make that a matter of professional duty rather than preference. ASOP No. 56 says that when an actuary relies on a model "designed, developed, or modified by others, such as a vendor or colleague" and cannot fully understand its workings, the actuary should disclose the extent of that reliance and make a reasonable attempt to understand its purpose, general operation, major sensitivities and key strengths and limitations (ASOP No. 56, section 3.4). A tool whose output the actuary cannot reproduce makes that harder, which is why a monitor should show its arithmetic on every cell and every flag.
Reserving software tells you what the quarter says. A monitor tells you, in the month it happens, that the quarter is going to say something different, and why.
The CAS study text quotes a 1973 review by Hugh White that still frames the monitoring problem. Faced with reported losses 8% above expected for the current accident year, should the actuary cut the IBNR, hold it, or raise it? His answer: "Obviously, none of the three suggested “answers” is satisfactory without further extensive investigation, and yet, all are reasonable" (Friedland, CAS). No tool removes that judgment. The best a tool can do is deliver the further investigation with the flag.
How to choose actuarial reserving software, and when to add a monitor
Choose reserving software for the quarter and a monitor for the weeks between, and test both on your own history before you buy. The questions below separate tools that compute from tools that watch, and both from tools that claim to decide.
Questions to ask before buying actuarial reserving software or a reserve monitor
- Can I reproduce every number it shows?
Expected, actual, range and A/E for any cell, from the signed pattern and the transactions. If not, you cannot validate it under ASOP No. 56.
- Does it tie to the general ledger?
Reported losses by segment should reconcile at each month-end; otherwise it is watching different data from the one you book.
- Who selects?
Software should keep your selections and reasons; a monitor should read them, never change them.
- How often does it compare, and at what level?
Quarterly segment totals hide a hot accident year behind a cold one; monthly cells do not.
- Can it explain a move?
Does it show which claims moved, and the passage in the note or letter that came first?
- Are thresholds settings, with an audit trail?
Range width, dollar floor, evaluations before a review: versioned, with who changed them and when.
- Can it be backtested on my closed years?
Freeze an old review, replay the months after, and count flags that preceded adverse development and those that did not.
- What does it need from us?
Claim transactions with accident dates, the last signed patterns, readable notes, and treaty layers if you want net figures.
Where Loss Development Monitoring fits among reserving tools
Loss Development Monitoring sits on top of the reserving system you already run. It reads the claim system's transactions read-only, the adjuster notes, large-loss reports and counsel letters, the litigation register, the last review's signed selected patterns and indicated ultimates, and the treaty register. It writes nothing back to any of them. Its outputs are flags with their arithmetic and claims, a weekly development summary for the chief actuary, items queued for the next reserve committee, and the reinsurance view of each moving claim, gross, ceded and net.
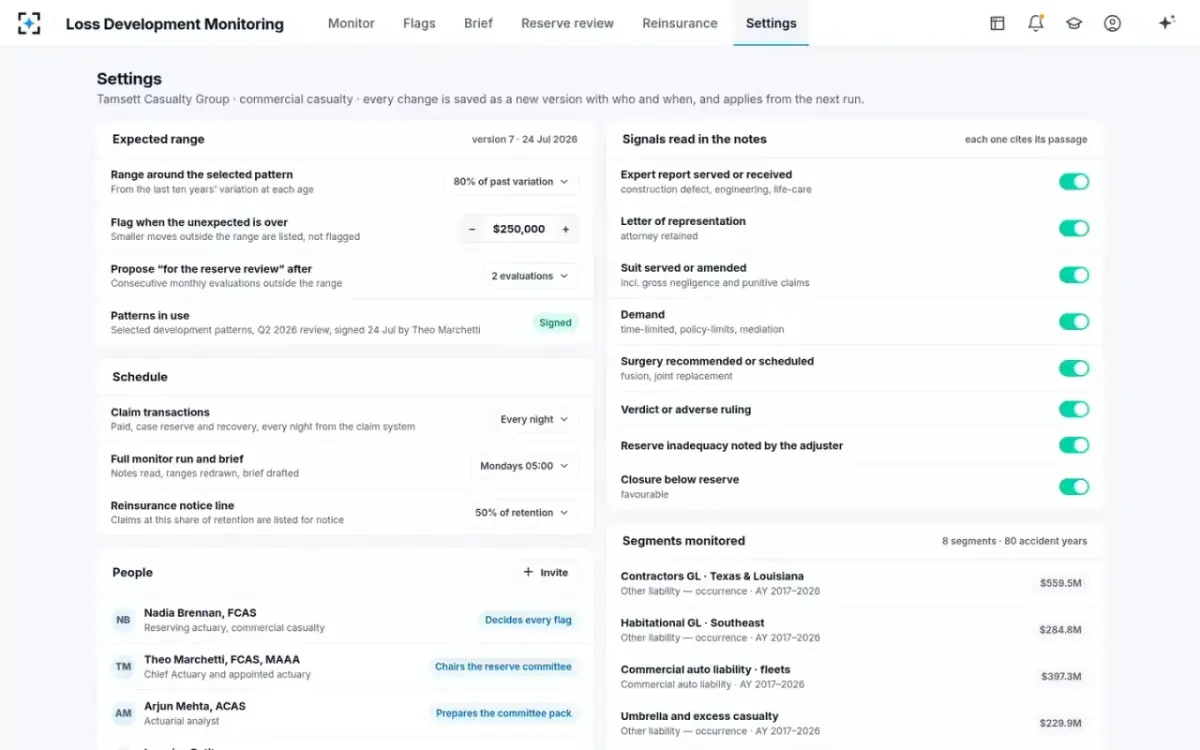
The rules that decide a flag, the range around the pattern, the dollar threshold, the number of evaluations before a review is proposed, the schedule and the signals read in the notes, are the reserving team's own settings, versioned with who changed them and when; the eight settings that decide a flag sets them out. It does not fit a team without a dependable claim transaction feed, and it adds less where claim notes are thin. And it does not do the quarter: selections, exhibits and the opinion stay in the reserving software and with the actuary. For how its agents work through a week, see AI in actuarial reserving, one run traced.
Settings the reserving team owns: range, threshold, review trigger, schedule and signals
Questions people ask
What is the best actuarial reserving software?
The one your team can validate, reconcile and explain. Look for full reproducibility of every number, a documented selection trail, reconciliation to the general ledger and exhibits that support the statutory opinion; then test it on your own closed years.
What does reserving software cost?
Prices depend on the vendor, the number of users and segments and whether it is hosted; no public benchmark exists. Compare total cost including data preparation and the actuary's time per quarter, which is usually the larger figure.
Can a reserve monitor replace reserving software?
No. A monitor compares development against selections that reserving software and the actuary produced; it does not build the quarterly analysis, select ultimates or produce exhibits. It is added alongside to watch the weeks between reviews.
Do actuaries still use Excel for reserving?
Many do, especially for smaller books or alongside a reserving system. ASOP No. 43 does not prescribe a tool; it notes that a simple methodology may suit internal use and not external financial reporting.
How often should reserves be monitored?
The CAS study text describes monthly and quarterly monitoring between full analyses. Monitoring monthly at the accident-year level catches breaks that quarterly segment totals hide, provided the thresholds keep false alarms manageable.
Does reserving software produce the actuarial opinion?
It produces the exhibits and analysis the opinion rests on; the statement of actuarial opinion is the appointed actuary's, signed under NAIC Model #745 and supported by an actuarial report.