IRIS ratios are the thirteen financial ratios the NAIC's Insurance Regulatory Information System calculates for every property and casualty insurer from its statutory annual statement, each compared with a "usual range" so that state insurance departments can see which insurers need attention first. They cover leverage (premium to surplus), profitability (a two-year operating ratio, investment yield, changes in surplus), liquidity (liabilities to liquid assets, agents' balances) and reserves (one- and two-year development and an estimated current deficiency). An unusual value is a reason to look, not a finding. The ratios matter beyond the regulator's desk because they are built from the same lines of the annual statement that rating agency questionnaires and exam request lists ask about; Botminds' Rating Agency & Exam Response keeps each of those figures once, with its page and line, so every answer about them agrees with what the regulator computes.
IRIS for property and casualty insurers, data year 2025
13
ratios calculated from each company’s statutory annual statement
2,647
property and casualty companies in the 2025 results
20 · 20 · 25%
the thresholds for the three reserve ratios, 11, 12 and 13
19 May
the date on the NAIC’s 2025 ratio results, issued in 2026
What are IRIS ratios?
They are a screening tool. The NAIC describes IRIS as "a collection of analytical solvency tools and databases designed to provide state insurance departments with an integrated approach to screening and analyzing the financial condition of insurers" (NAIC IRIS Ratios Manual, 2025 edition). The ratio application generates results automatically when an insurer's annual statement data arrive, compares each with its usual range, and marks values outside it. The reports go to state regulators and interested parties, and the manual is written to help "state insurance departments and the public" understand the ratios.
The NAIC is explicit about what IRIS is not. It is not intended to replace each department's own in-depth solvency monitoring, such as financial analyses or examinations, and its limitations section says the tool "cannot identify a misstatement of financial condition" or a statement not prepared in the proper format. IRIS reads what the insurer filed. If the filing is wrong, the ratio is wrong in the same direction.
What are the 13 NAIC IRIS ratios?
The thirteen property and casualty ratios fall into four groups. The table gives each in one line, its usual range as printed on the 2025 results, and the industry median for 2025 in two versions: across all companies, and excluding the default values (−99, 0 and 999) that the system assigns when a ratio cannot be computed meaningfully.
The 13 property and casualty IRIS ratios: usual range and 2025 median
| Ratio | What it measures | Usual range (2025 results) | Median 2025: all · excluding defaults |
|---|---|---|---|
| 1 · Gross premiums written to surplus | Leverage before reinsurance: direct and assumed premium per dollar of surplus. | Under 900% | 139 · 144 |
| 2 · Net premiums written to surplus | Leverage after reinsurance. | Under 300% | 29 · 75 |
| 3 · Change in net premiums written | Growth or shrinkage of net writings in the year. | −33% to 33% | 0 · 5 |
| 4 · Surplus aid to surplus | Surplus created by ceding commissions on reinsurance, relative to surplus. | Under 15% | 0 · 5 |
| 5 · Two-year overall operating ratio | Loss ratio plus expense ratio minus investment income ratio, over two years. | Under 100% | 78 · 88 |
| 6 · Investment yield | Net investment income over average cash and invested assets. | 3.0% to 6.5% | 3.4 · 3.4 |
| 7 · Gross change in surplus | The year’s change in policyholders’ surplus. | −10% to 50% | 5 · 6 |
| 8 · Change in adjusted surplus | The change in surplus after removing capital and surplus contributions. | −10% to 25% | 4 · 5 |
| 9 · Adjusted liabilities to liquid assets | Ability to meet obligations from liquid assets. | Under 105% | 57 · 59 |
| 10 · Gross agents’ balances to surplus | Premium due from agents, relative to surplus. | Under 40% | 2 · 8 |
| 11 · One-year reserve development to surplus | How last year’s loss and LAE reserves have developed, relative to last year’s surplus. | Under 20% | 0 · −1 |
| 12 · Two-year reserve development to surplus | The same, over two years, relative to surplus two years ago. | Under 20% | 0 · −2 |
| 13 · Estimated current reserve deficiency to surplus | Reserves required on recent development patterns, minus reserves held, relative to surplus. | Under 25% | 0 · −2 |
Two readings of the medians help. The "all companies" median is pulled toward zero for ratios where many companies have no activity, such as surplus aid or reserve development at a small or new company. The "excluding defaults" median is closer to a typical active company. For the reserve ratios, a negative median means the typical company's reserves developed favourably, consistent with the NAIC's report of a one-year industry redundancy of $20.0 billion in 2025 (NAIC 2025 property and casualty industry analysis).
What is a usual range for IRIS ratios, and what does falling outside it mean?
A usual range is the band of values the NAIC regards as normal for a ratio, set from the experience of insurers that became insolvent and reviewed each year. Falling outside it marks the value with an asterisk on the results. It does not, on its own, mean anything is wrong:
A ratio that falls outside the usual range is not necessarily considered adverse.
NAIC, IRIS Ratios Manual, 2025 edition
The manual gives the reason: in some years, financially stable insurers have several ratios outside the range, for example when an equity market move changes surplus, which is the divisor in many of the formulas. It also lists the caveats every analyst should know: no state can rely on the results as its only surveillance, licensing decisions should not rest on them without further analysis, and the criteria, "although based on the recent experience of insurers becoming insolvent, may not be valid for future experience in different economic periods."
How close the median company sits to each threshold, 2025
The bars make one point the table hides. On leverage and liquidity, the median company has plenty of room. On the two-year overall operating ratio, the median active company sits at 88 against a threshold of 100: a couple of bad catastrophe years or a reserve charge moves an ordinary insurer across the line. That is the ratio where an unusual value most often needs a sentence of explanation, and where the explanation should match what the company has told its rating agencies about the same years.
What is IRIS ratio 11, and how do the reserve ratios work?
Ratio 11 is one-year reserve development divided by the prior year's policyholders' surplus. The development is taken from Schedule P, Part 2: the current estimate of losses that were outstanding a year ago (payments since, plus reserves still held) minus the reserves held for them a year ago. In the manual's words, "A positive ratio result indicates a deficiency, while a negative result indicates a redundancy." The usual range is under 20%.
Ratio 12 does the same over two years, relative to surplus two years ago. The manual draws a pointed inference from the pair: if results consistently show adverse development, or ratio 12 is consistently worse than ratio 11, "the insurer may be intentionally understating its reserves and deficiencies are appearing as losses paid." It also notes that an on-site examination may be required to resolve serious questions about reserve adequacy. How the 2025 development figures read line by line, and how to watch them between filings, is set out in prior year reserve development in 2025.
Regulators also expect a better explanation than the label. The NAIC's Actuarial Opinion Working Group says in its 2026 guidance that strengthening or adverse development is not an acceptable explanation for unusual reserve development, and expects the appointed actuary to explain what at the company caused it (NAIC Actuarial Opinion (C) Working Group, 2026; quoted in what reserve strengthening is). The same expectation is sensible for any audience: the explanation an insurer gives a regulator for an unusual ratio 11 should be the one it gives a rating agency for the same development.
How do you calculate IRIS ratio 13?
Ratio 13 estimates whether current reserves are short, by applying the company's own recent development pattern to this year's premium. It averages two developed reserves-to-premium ratios (from the prior year and the second prior year), multiplies the average by the current year's earned premium to get the reserves the pattern implies, subtracts the reserves actually held, and divides by surplus. The worked example uses round, illustrative numbers.
IRIS ratio 13, step by step, on illustrative numbers ($ millions)
| Step | Calculation | Result |
|---|---|---|
| 1. Developed reserves to premium, second prior year (D) | (reserves two years ago 800 + two-year development 40) ÷ premium earned two years ago 1,000 | 84.0% |
| 2. Developed reserves to premium, prior year (H) | (reserves a year ago 850 + one-year development 25) ÷ premium earned a year ago 1,050 | 83.3% |
| 3. Reserves the pattern implies | ½ × (84.0% + 83.3%) × current premium earned 1,100 | 920.3 |
| 4. Estimated deficiency (K) | 920.3 − current loss and LAE reserves 900 | 20.3 |
| 5. Ratio 13 | 20.3 ÷ policyholders’ surplus 500 | 4.1%, inside the 25% threshold |
| For comparison: ratio 11 | one-year development 25 ÷ prior-year surplus 480 | 5.2%, inside the 20% threshold |
Ratio 13's weakness is premium growth. The manual warns that a major increase in earned premium can produce results that overstate the deficiency, because the pattern is applied to more premium than the reserves have had time to reflect. A fast-growing insurer outside the range on ratio 13 should expect to explain growth, not just reserves, and should say the same thing to every audience that asks.
How do regulators use IRIS results?
To decide where to spend scarce examiner and analyst time. The manual says IRIS helps by highlighting "those insurers that merit the highest priority in the allocation of the state insurance regulators’ resources." The NAIC's Financial Condition Examiners Handbook lists IRIS results among the inputs for scheduling examinations, alongside analysts' work, the company's auditors' and actuary's reports and changes in management, and it lists IRIS reports among the documents examiners gather when planning an exam (NAIC Financial Condition Examiners Handbook, 2026).
In practice the ratio itself is rarely the conversation; the explanation is. An analyst who sees an unusual ratio 11 will read Schedule P, the actuarial opinion and the actuarial report, and may ask the company. The risk-focused examination process shows where those questions resurface during a full exam.
Do rating agencies use IRIS ratios?
Rating agencies publish their own methods, and how each uses statutory data is for each agency to say; this guide does not describe them. What is certain is that the ratios are built from the same statutory annual statement lines that any analyst can read, and that rating agency questionnaires ask about the same quantities: premium leverage, operating results, reserve development, liquidity. An insurer that explains its reserve development one way in an IRIS context and another way in a rating questionnaire has created an inconsistency, whoever notices it first.
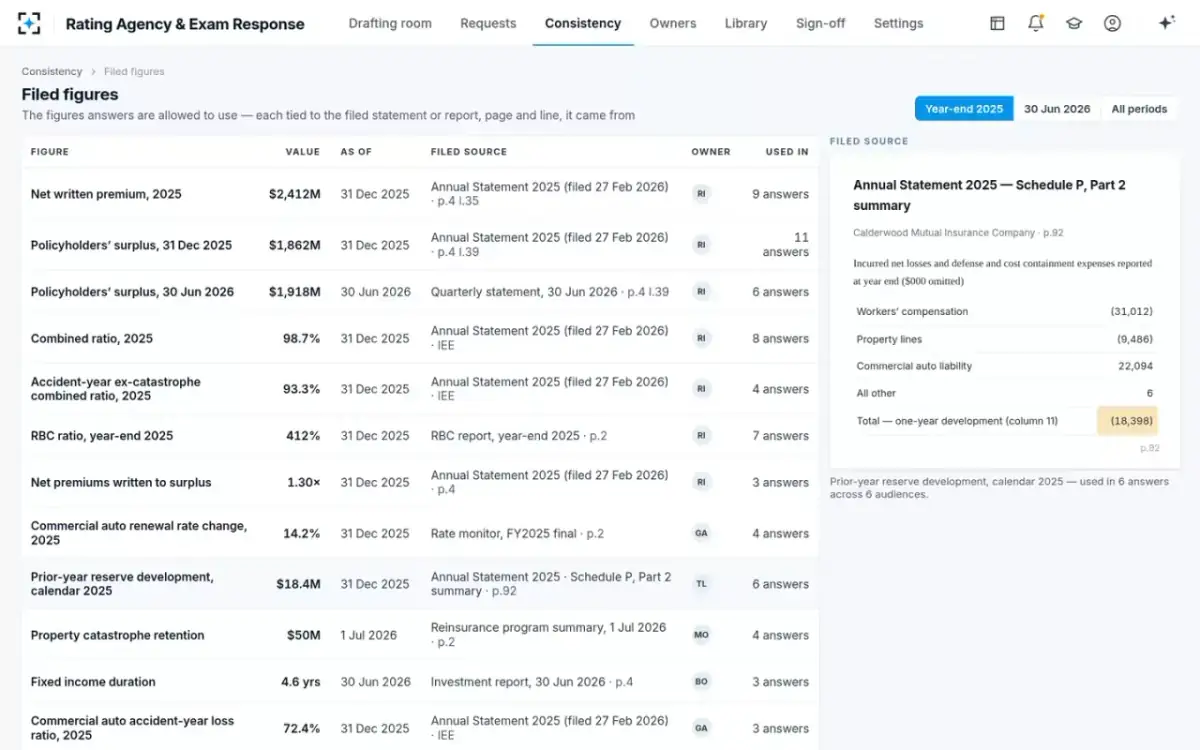
That is the practical reason to treat the figures behind the IRIS ratios as shared: one value for net premiums written, one for surplus, one for one-year development, each with its filed page and line, used in every answer. Four measures of a rating questionnaire draft turns that into a check.
The filed figures behind the ratios, each with its page and line
Where are IRIS results published?
The NAIC publishes the IRIS ratio results, with industry means and medians, and the IRIS Ratios Manual, which explains each formula and the line of the annual statement it reads. The manual's maintenance procedures say NAIC staff publish it on or about 1 November each year, and proposed changes go through the Financial Analysis Solvency Tools (E) Working Group with a public comment period. Because ranges and formulas can change, the version that applies is the one for the data year you are reading.
For an insurer, the best use of the publication is rehearsal: compute your own thirteen ratios from your draft annual statement before you file, note any that will be unusual, and write the explanation once. To keep that explanation and its figures consistent across regulators, rating agencies and the auditor, start from Rating Agency & Exam Response.
Questions people ask
How many IRIS ratios outside the usual range trigger a review?
The 2025 IRIS manual does not set a count that triggers action. It says results outside the range identify insurers that may need attention, that several unusual values can occur at stable insurers in some years, and that interpretation depends on analysts' and examiners' judgement. Expect questions about any unusual value, and especially about reserve ratios.
Are IRIS ratios public?
The NAIC says the ratio reports are made available to state insurance regulators and interested parties, and it publishes the IRIS manual and the industry means and medians. The underlying data are the insurer's own statutory annual statement, so an insurer can compute its ratios before it files.
Do life insurers have IRIS ratios?
Yes, a separate set of twelve life, accident and health ratios, with 721 companies in the 2025 results. They test changes in capital and surplus, income, investments and reserving consistency; the manual notes they do not test reserve adequacy, which it calls one of the primary purposes of an on-site examination.
What is the difference between IRIS ratios and risk-based capital?
IRIS ratios are screening tests with usual ranges that prompt a closer look. Risk-based capital is a capital formula whose results trigger regulatory action under state versions of the NAIC's Risk-Based Capital Model Act (#312). Both are calculated from statutory filings; the RBC ratio usually appears in rating agency questionnaires and should be the same figure everywhere it is quoted.
Why is my company's ratio 999?
The system assigns default values when a ratio cannot be computed meaningfully, for example 999 when surplus is zero or negative for a ratio that divides by it, or when prior-year premium was zero for a growth ratio. The NAIC's medians are shown both with and without these defaults.