The difference between the net expense ratio and the gross expense ratio is the fee waiver. The gross expense ratio is a fund's total annual operating expenses as a percentage of its assets before any fee waiver or expense reimbursement; the net expense ratio is the same total after it. In a US prospectus fee table, the net line may appear only when the waiver will run for at least one year from the date the registration statement becomes effective, and the fund must give the expected end date and say who has the power to end it early. A fee comparison should therefore rank funds on net, which is what investors pay now, and keep gross and the end date beside every net figure, because the net number has a shelf life. Botminds' Fee Benchmarking, which answers peer fee questions for fund product and board teams, reads both lines from each peer's own fee table and shows what the ranking becomes when the waivers end.
Net expense ratio vs gross expense ratio, line by line
Gross expense ratio: “Total Annual Fund Operating Expenses”
Net expense ratio: “Total Annual Fund Operating Expenses After Fee Waiver [and/or Expense Reimbursement]”, or similar wording
Gross expense ratio: What the fund costs to run: management fees, 12b-1 fees, other expenses and any acquired fund fees.
Net expense ratio: The same total, less the amount the adviser waives or reimburses.
Gross expense ratio: The most recent fiscal year, including amounts that would have been incurred without the waiver.
Net expense ratio: Gross minus the waiver line printed directly above it.
Gross expense ratio: Always.
Net expense ratio: Only if the waiver will cut expenses for at least one year from the registration statement’s effective date.
Gross expense ratio: A footnote if figures were restated for a material change.
Net expense ratio: The period of the arrangement, its expected termination date, and who can end it and when.
Gross expense ratio: It overstates today’s cost if a waiver is long-standing and routinely renewed.
Net expense ratio: It understates next year’s cost if the waiver ends before the next decision.
What is a gross expense ratio?
A gross expense ratio is the "Total Annual Fund Operating Expenses" line of a fund's fee table: everything the fund deducts from its assets in a year, expressed as a percentage of the value of an investment. Form N-1A builds it from four kinds of cost. Management fees include the advisory fee, any performance-based fee, and administrative fees paid to the adviser or its affiliates. Distribution and service (12b-1) fees follow. Other expenses are the remaining costs shown in the fund's statement of operations, such as custody, transfer agency, audit and legal fees, without extraordinary items. Where the fund invests in other funds, acquired fund fees and expenses are added (Form N-1A, Item 3, Instruction 3).
Two instructions decide what "gross" means in practice. The percentages are based on the most recent fiscal year, but "include in expenses amounts that would have been incurred absent expense reimbursement or fee waiver arrangements", which is what makes the figure gross. And if fees have changed materially, the fund restates the table at current fees and says so in a footnote; a fall in the ratio caused by economies of scale or breakpoints as assets grow is not such a change (Instruction 3(d)). How breakpoints work is covered in Botminds' guide to advisory fee breakpoints.
What the gross figure leaves out matters as much. The fee table's own narrative warns that investors may pay other fees, such as brokerage commissions to their own intermediaries, that the table does not show. And a fund's portfolio transaction costs are not in it at all: the portfolio turnover paragraph says these costs "are not reflected in annual fund operating expenses or in the example" (Form N-1A, Item 3). That single sentence is why a US expense ratio cannot sit unadjusted beside a European cost figure, as the UCITS ongoing charges guide explains.
What does the net expense ratio show, and for how long?
The net expense ratio shows what a fund charges while an adviser's waiver or reimbursement is in force. Form N-1A lets a fund add two captions below the total, one for the waiver and one for net expenses, only when a waiver or reimbursement will cut the fund's operating expenses for at least a year from the registration statement's effective date. A fund that adds them must then say how long the arrangement is expected to last, when it is expected to end, and who can end it and in what circumstances (Instruction 3(e); the fee waiver expiry guide follows what happens when that date approaches).
The cost example follows the same logic. A fund may reflect the waiver in its 1-, 3-, 5- and 10-year dollar costs, but only "in the period(s) for which the expense reimbursement or fee waiver arrangement is expected to continue" (Instruction 4(a)). So the fee table itself tells a careful reader when the net figure expires. The trouble is that a peer spreadsheet copies the number and drops the footnote.
Where the net line sits in a fee table, and the footnote that dates it
Annual Fund Operating Expenses%
Management Fees0.95
Distribution and/or Service (12b-1) FeesNone
Other Expenses0.00
Total Annual Fund Operating Expenses gross0.95
Fee Waiver1(0.15)
Total Annual Fund Operating Expenses After Fee Waiver net0.80
1 The adviser has agreed to waive 0.15% of its management fee until at least April 30, 2027. The agreement may be terminated before that date only by the Fund’s Board of Trustees.
Net expense ratio vs total expense ratio: three figures with similar names
"Total expense ratio" is not a defined caption in the US fee table, so it is used loosely, and that is how two analysts end up comparing different numbers. In the prospectus, the total annual fund operating expenses line is the gross figure, and the after-waiver line is the net. A third figure lives in the shareholder report and the financial statements: the ratio of expenses to average net assets in the financial highlights, which looks backward at what the fund actually paid, after any waivers, and leaves out acquired fund fees. Form N-1A even lets a fund say in a footnote that its fee table total does "not correlate to the ratio of expenses to average net assets given in response to Item 13" (Instruction 3(f)(v)).
Four US fee figures that all get called the expense ratio
| Figure | Where it is printed | Looks | Waivers | Acquired fund fees |
|---|---|---|---|---|
| Total annual fund operating expenses (gross) | Prospectus fee table, Item 3 | Forward, on last fiscal year’s costs at current fees | Before | Included as their own line |
| Total after fee waiver (net) | Prospectus fee table, below the gross line | Forward, while the waiver lasts | After, if it runs a year or more | Included |
| Ratio of expenses to average net assets | Financial highlights, Item 13 | Backward, the fiscal year just ended | After; some funds also print a ratio before | Excluded |
| Costs paid as a percentage of a $10,000 investment | Annual shareholder report | Backward, the reporting period | After | As in the financial highlights ratio |
For a peer comparison the rule is simple: pick one of the first two and use it for every fund. The backward-looking ratios are the right tool for checking what a fund actually charged, which is what the financial highlights ratios guide and the shareholder report cost example guide cover, but they describe last year and cannot rank funds on what they charge now.
Acquired fund fees and expenses: the line that breaks fund-of-funds comparisons
Acquired fund fees and expenses, the line known as AFFE, add the costs a fund bears indirectly through the other funds it holds, and they can make two similar funds look far apart. Any fund that invests in an acquired fund adds the line directly above the total, unless those costs are no more than one basis point of average net assets, in which case they can sit in other expenses. An acquired fund includes any investment company and any fund that would be one but for the private-fund exceptions in Sections 3(c)(1) and 3(c)(7) (Instruction 3(f)(i)).
How acquired fund fees and expenses are calculated
- F
- Each acquired fund’s total annual operating expense ratio, from its latest shareholder report
- D ÷ FY
- Days the fund held it, over days in the fiscal year
- AI
- Average invested balance, measured at least monthly
- Transaction Fees
- Sales loads, redemption fees and similar charges paid to buy or sell acquired funds
- Incentive Allocations
- Capital allocated to the acquired fund’s adviser out of the fund’s gains or income
Two consequences follow for a fee comparison. A fund of funds or a multi-asset fund carries an AFFE line that a single-strategy peer does not, so a raw ranking punishes the structure rather than the manager. And because the financial highlights ratio leaves AFFE out, a comparison built from shareholder reports will disagree with one built from fee tables for exactly those funds. Whatever the choice, it should be a written rule applied to every peer, with the excluded amount shown.
Which one should a fee comparison use?
A fee comparison should rank on the net expense ratio and treat gross as required context, not an alternative. Net is what an investor in each fund pays today, and it is what a competitor's sales team will quote. Gross is what the fund will cost if the adviser stops subsidising it. The useful question for a pricing committee or a board is how far apart the two are and for how long.
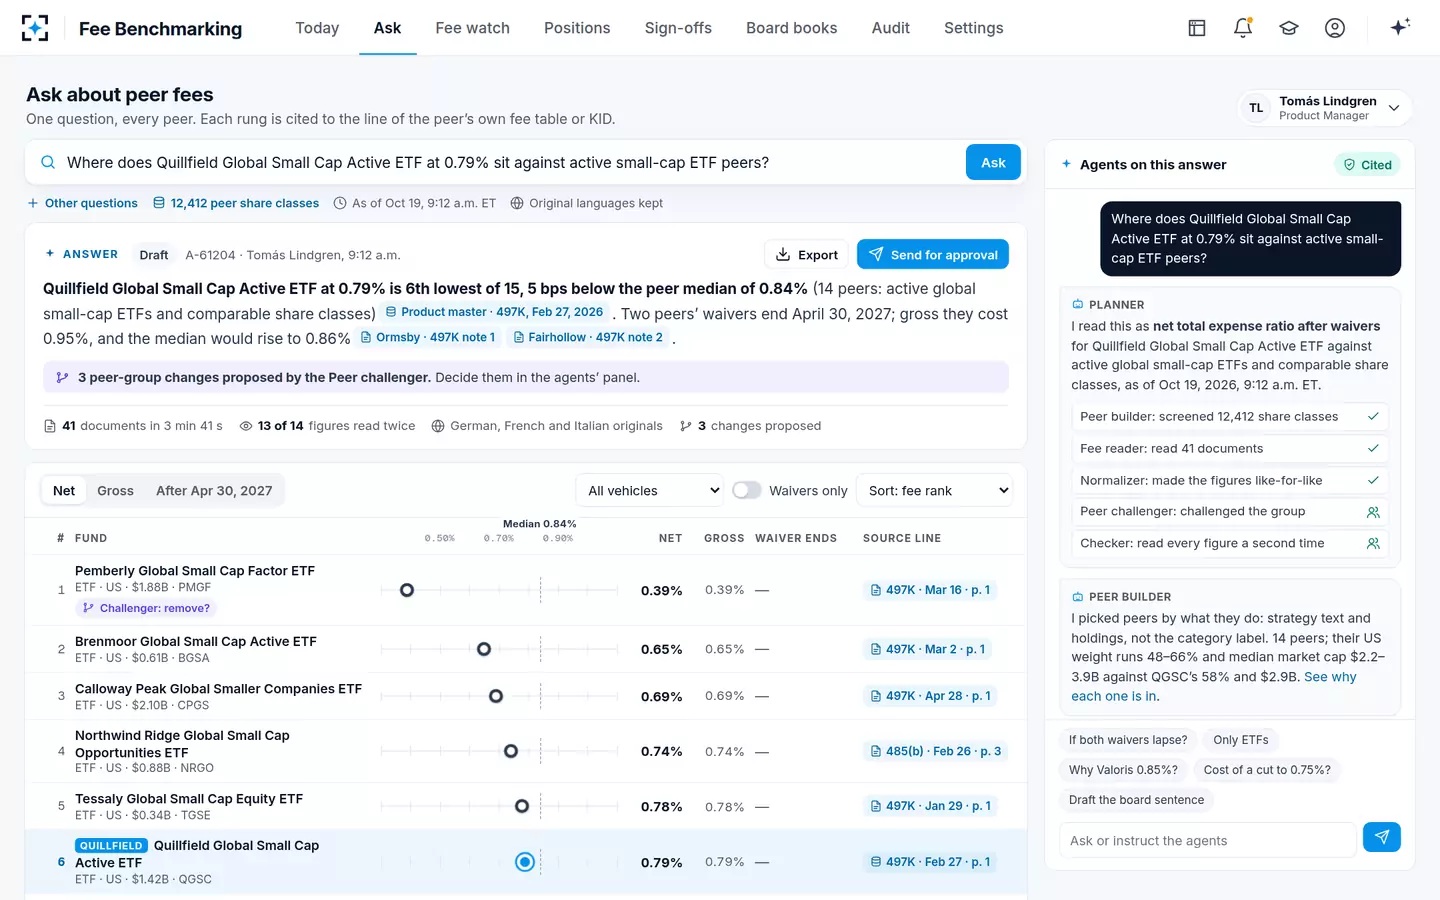
The error to avoid is mixing them: one fund's gross against another's net, which happens whenever figures are copied from different places at different times. A second, quieter error is keeping a net figure after its waiver has ended. In Botminds' Fee Benchmarking, the question is read as the net total expense ratio after fee waivers unless the asker says otherwise, every rung of the peer ladder shows gross beside net with the waiver's end date, and a written rule flags any waiver that ends within 12 months of the next board date. When waivers matter, the whole ladder can be redrawn as it will look the day after they end, which is the subject of the guide to expiring fund fee waivers.
When the net figure misleads: a worked example
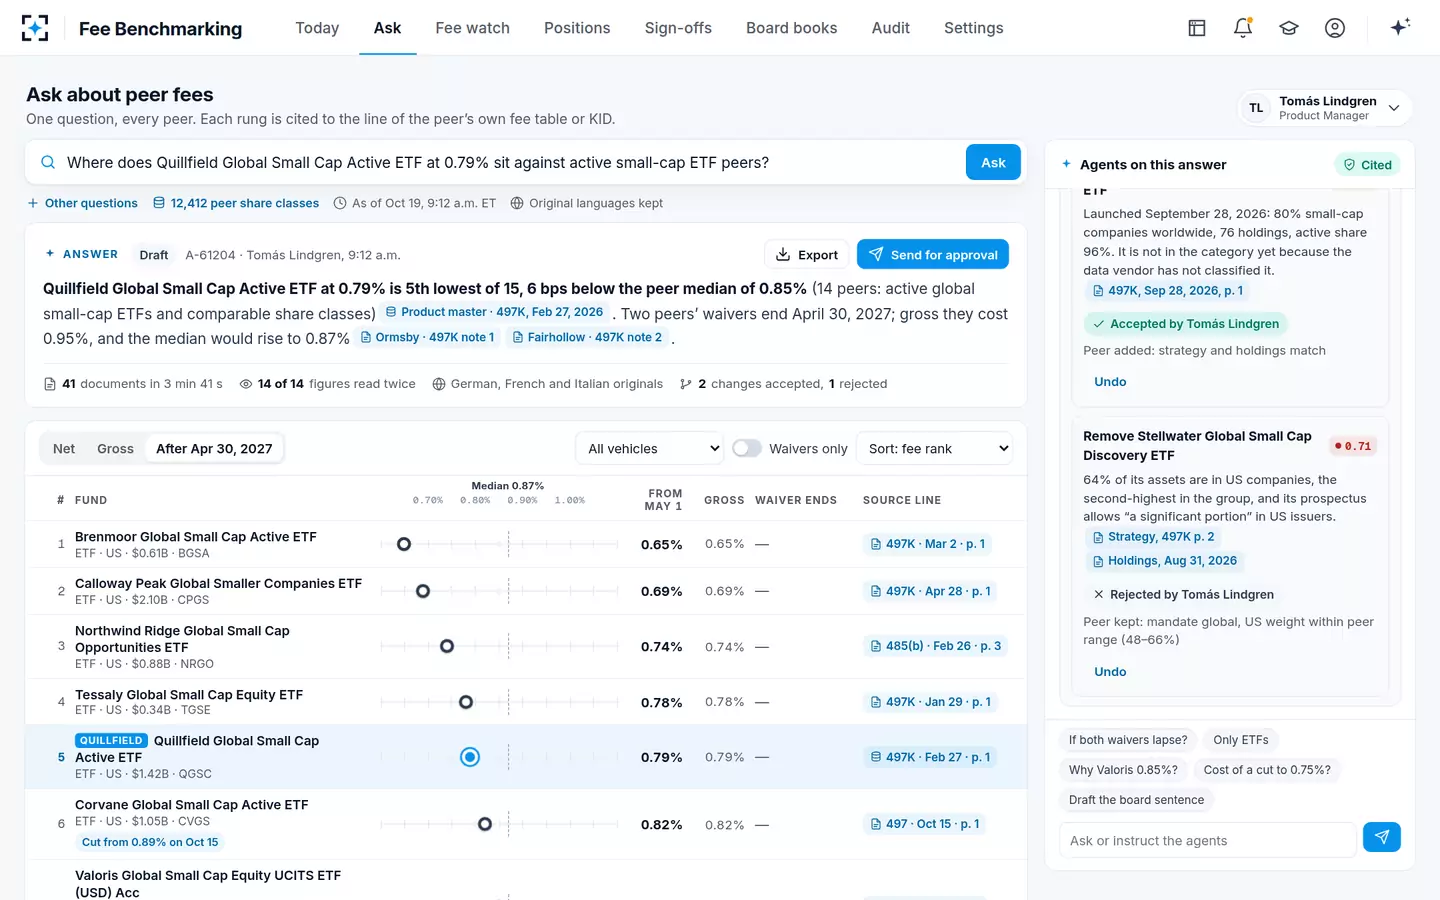
Take a sample from the solution, on fictional funds: Quillfield Global Small Cap Active ETF at 0.79%, compared with 14 active global small-cap peers. Two of them, Ormsby Lane at 0.80% and Fairhollow at 0.85%, are 0.95% gross, and both waivers end on 30 April 2027, before the board's next annual review. On net figures the fund is 5th lowest of 15, 6 basis points below a peer median of 0.85%. Switch both peers to gross and the median rises to 0.87%: the fund is still 5th lowest, but now 8 basis points below.
Two peers, net and gross: what the median does when their waivers end
Here the direction is benign: the fund looks better once the waivers lapse. The reverse case is the dangerous one. A fund priced just below a cluster of waived peers can find itself above the median the month after a board has been told it is cheap, and nobody will have changed a fee.
The same ladder redrawn for the day after two waivers end
Do ETF fee tables work the same way?
Yes, with two differences worth knowing. An ETF's fee table excludes the fees authorised participants pay to create and redeem shares: Form N-1A tells an exchange-traded fund to "exclude any fees charged for the purchase and redemption of the Fund’s creation units" (Instruction 1(e)). And many ETFs charge a single unitary fee from which the adviser pays most operating costs, so the management fee line carries almost the whole total and other expenses are close to zero, as in the sample table above.
That changes how waivers read. Under a unitary fee a waiver has only one line to reduce, the management fee, so the gross figure is the price the sponsor has set and the net is the price it is charging for now. In an ETF peer group, the gap between the two is a signal of where a competitor's fee may go when the waiver ends. ETF management fees comparison puts a value on each basis point of that gap.
Fee waivers are on the examiners' list
Getting net and gross right is also a supervisory matter. In its examination priorities for fiscal 2027, published on 23 October 2026, the SEC's Division of Examinations said its registered fund examinations will focus first on fund fees and expenses, naming related waivers and reimbursements explicitly (SEC, FY2027 Examination Priorities). Boards have been here before: in a 2015 case, the SEC found that an adviser had not given independent directors certain information about an expense limitation agreement that capped a fund's expenses, along with other gaps in its 15(c) responses (SEC press release 2015-124).
Five checks before a net expense ratio goes into a fee comparison
- Same measure for every fund
Net after waivers for all, gross for all, or both columns. Never one fund’s net beside another’s gross.
- The waiver’s end date, from the footnote
Copy the expected termination date and who can end the waiver, not just the percentage.
- A flag if it ends before the next decision
A waiver that lapses before the next board or pricing review is a different fee by the time anyone acts.
- Acquired fund fees treated one way
Included for every peer or excluded for every peer, with the amount shown either way.
- The newest filing
A 497 supplement can cut a fee or end a waiver mid-year; the fee table in last spring’s prospectus may already be out of date.
Gross beside net on every rung of the peer ladder
Questions people ask
Which expense ratio do I actually pay?
While a waiver is in force, you pay the net expense ratio; it is deducted from the fund's assets, so it shows up in returns rather than on a bill. When the waiver ends, the fund's costs move toward the gross figure unless the adviser renews it. The fee table footnote gives the expected end date and who can terminate the arrangement.
Why is the gross expense ratio higher than the net?
Because the adviser is waiving part of its fee or reimbursing some of the fund's expenses. Gross is calculated as if the arrangement did not exist, and net subtracts it. If the two are equal, there is no waiver that runs a year or more.
Does the net expense ratio include acquired fund fees and expenses?
In the prospectus fee table, yes: AFFE is a line above the total, and the net figure is that total minus the waiver. The ratio in the financial highlights leaves AFFE out, which is why the two can differ for a fund of funds and why the form allows a footnote saying they do not correlate.
What happens when a fund fee waiver expires?
The fund's expenses rise toward gross unless the adviser and the board renew it, and the next prospectus or a supplement shows the new figures. For anyone comparing fees, the peer ranking can change without any fee having been cut or raised. The guide to expiring waivers follows one through the board calendar.
Is a lower net expense ratio always better?
Lower is better for the same exposure, but only on a like-for-like basis. A low net figure held up by a waiver that ends in four months, or a passive fund in an active peer group, can look cheap and mislead. Compare the same measure, the same class and the same strategy before reading anything into a few basis points.
What is a good expense ratio for a fund?
No US regulator publishes an asset-weighted average to measure against, so the useful benchmark is a peer group built on the same measure. For context in Europe, ESMA reported ongoing costs of 1.3% for a one-year investment in retail equity UCITS in 2024 (ESMA, March 2026), a figure built on a European cost definition rather than the US fee table.