A mutual fund expense analyzer answers an investor's question: what will this fund, or these three funds, cost me over the years I hold them? FINRA's Fund Analyzer is the best-known public example, and the fee table's own cost example in every US prospectus is a smaller one. The people who set a fund's fee need a different answer: where the fee sits against funds that pursue the same strategy, why those funds were chosen, and on what evidence, so a pricing committee can decide and a board can rely on it. That is a peer fee study, the kind of fund fee analysis US boards review before renewing an advisory contract and UK managers carry out in their annual assessment of value. Botminds' Fee Benchmarking builds that study from each peer's own filings, with every figure cited to its page and a person signing the result. The two tools are layers, not rivals, and buying the wrong one for the job is common.
Three layers of fee analysis, and who relies on each
1Expense calculator
“What will these funds cost me over the years I hold them?”
- Inputs
- Up to a few funds, an amount, a holding period, an assumed return
- Output
- Dollar costs and projected values
- Relied on by
- An investor or an adviser choosing between funds
2Fee comparison
“Which funds in this category are cheaper than mine?”
- Inputs
- A category label and a database of expense ratios
- Output
- A sorted list and a percentile
- Relied on by
- A product manager scanning the market
3Cited peer fee study
“Where does our fee sit against funds that do the same thing, why, and on what evidence?”
- Inputs
- Written peer rules, each peer’s own fee table or KID, waiver terms, share-class rules
- Output
- A ranked peer set with every figure sourced, the exclusions explained and a named approver
- Relied on by
- A pricing committee, a fund board, a UK value assessment, a supervisor
What does a mutual fund expense analyzer do?
A mutual fund expense analyzer projects how fees and expenses reduce an investment over time, so an investor can compare a handful of funds or share classes. FINRA describes its Fund Analyzer as a tool that demonstrates "the impact of fees and potential discounts on mutual funds, ETFs, exchange-traded notes and money market funds". You "select up to three funds to compare, the amount of money you plan to invest and how long you expect to hold the fund", and the tool models contributions, withdrawals, wrap fees, breakpoint discounts and waivers. It also offers a display of how a fund's annual operating expenses compare with its product and share-class peers (FINRA, Compare Funds With FINRA’s Fund Analyzer, 5 September 2024).
FINRA is careful about what that projection is: the results "are based on the rate of return you select and aren't a depiction of actual investment returns". For an investor choosing between two share classes of the same fund, or between a load and a no-load fund, that is exactly the right tool. It answers a cost question for a known set of funds the user picked.
The prospectus fee table is a calculator too
Every US fund prospectus already contains a small expense calculator. The example beneath the fee table states that it "is intended to help you compare the cost of investing in the Fund with the cost of investing in other mutual funds", assumes $10,000 invested, a 5% annual return and unchanged operating expenses, and shows the dollar cost over 1, 3, 5 and 10 years (Form N-1A, Item 3). A waiver can be reflected only for the years it is expected to last. Comparing two prospectus examples side by side is the simplest fee comparison there is.
Like an analyzer, the example compares funds the reader has already chosen, on the fees each fund itself reports. Neither tool asks whether those funds are the right comparison, whether one figure is net of a waiver ending in four months, or whether a European peer's cost figure counts something the US table leaves out. Those are the questions a fee-setter has to answer.
What does a fund board need that a calculator does not give?
A board needs a justified comparison, not a cost projection. When a US board relies on comparisons with other advisory contracts in approving a fee, the fund must explain which comparisons the board used and what they told it (SEC, 2004 disclosure release), and the materials the directors considered must be kept for six years (Rule 31a-2(a)(6)). The Supreme Court's reading of Section 36(b) in Jones v. Harris Associates lets courts weigh comparisons with other funds' fees but cautions against leaning on them heavily, since those fees may not be arm's-length either (559 U.S. 335, 2010). How a 15(c) book uses that evidence is mapped in the Gartenberg factors evidence map, from Botminds' 15(c) Board Reporting.
Outside the US the bar is similar. The FCA's 2023 review of value assessments said a fee justified only by pointing at peer funds falls short of its rules (the assessment of value guide quotes it), and criticised firms that compared their funds' charges with competitors' without first adjusting for differences in service (FCA, August 2023). ESMA asks that a manager's pricing process rest on "reliable and documented data" so a supervisor can reproduce its calculations (ESMA supervisory briefing, June 2020). A calculator's output satisfies none of those tests, because it never had to.
Mutual fund fee comparison calculator vs peer fee study
Expense analyzer or calculator: What will these funds cost an investor over a holding period?
Cited peer fee study: Where does our fee sit against funds that do the same thing, and is it justified?
Expense analyzer or calculator: The user, one to three at a time.
Cited peer fee study: Written peer rules applied to the whole market, with every exclusion explained.
Expense analyzer or calculator: The figures the database holds for each fund.
Cited peer fee study: One stated measure for all peers, such as net after waivers with gross beside it.
Expense analyzer or calculator: Left to the user.
Cited peer fee study: Share classes mapped, waivers dated, European cost figures adjusted to the US basis or the reverse.
Expense analyzer or calculator: A projection; not a depiction of actual returns.
Cited peer fee study: Each figure linked to its filing, date, page and line.
Expense analyzer or calculator: None needed.
Cited peer fee study: A named approver, a dated version, and materials kept at least six years in the US.
Where a sort by expense ratio goes wrong
The middle layer, a database sorted by category and expense ratio, is where most fee questions are answered today, and where most of the quiet errors live. A category label can put a quasi-index fund in an active peer group: in Botminds' Fee Benchmarking's fictional sample, a fund labelled active had an active share of 18% across 2,940 holdings and sat at 0.39%, pulling the median down. A category also lags launches; the same sample's newest competitor, launched three weeks earlier at 0.95%, was not yet classified at all.
Service differences are the other trap. The FCA described a firm that compared its funds, whose ongoing charges figure excluded a platform charge, with competitors whose figure included one, and another that inflated a rival's platform charge to match its own before comparing (FCA, 2023). A sorted list cannot catch that, because the difference is in the documents, not the numbers. The same is true of a European peer's cost figure, which includes transaction costs a US expense ratio omits, a gap covered in the UCITS ongoing charges guide.
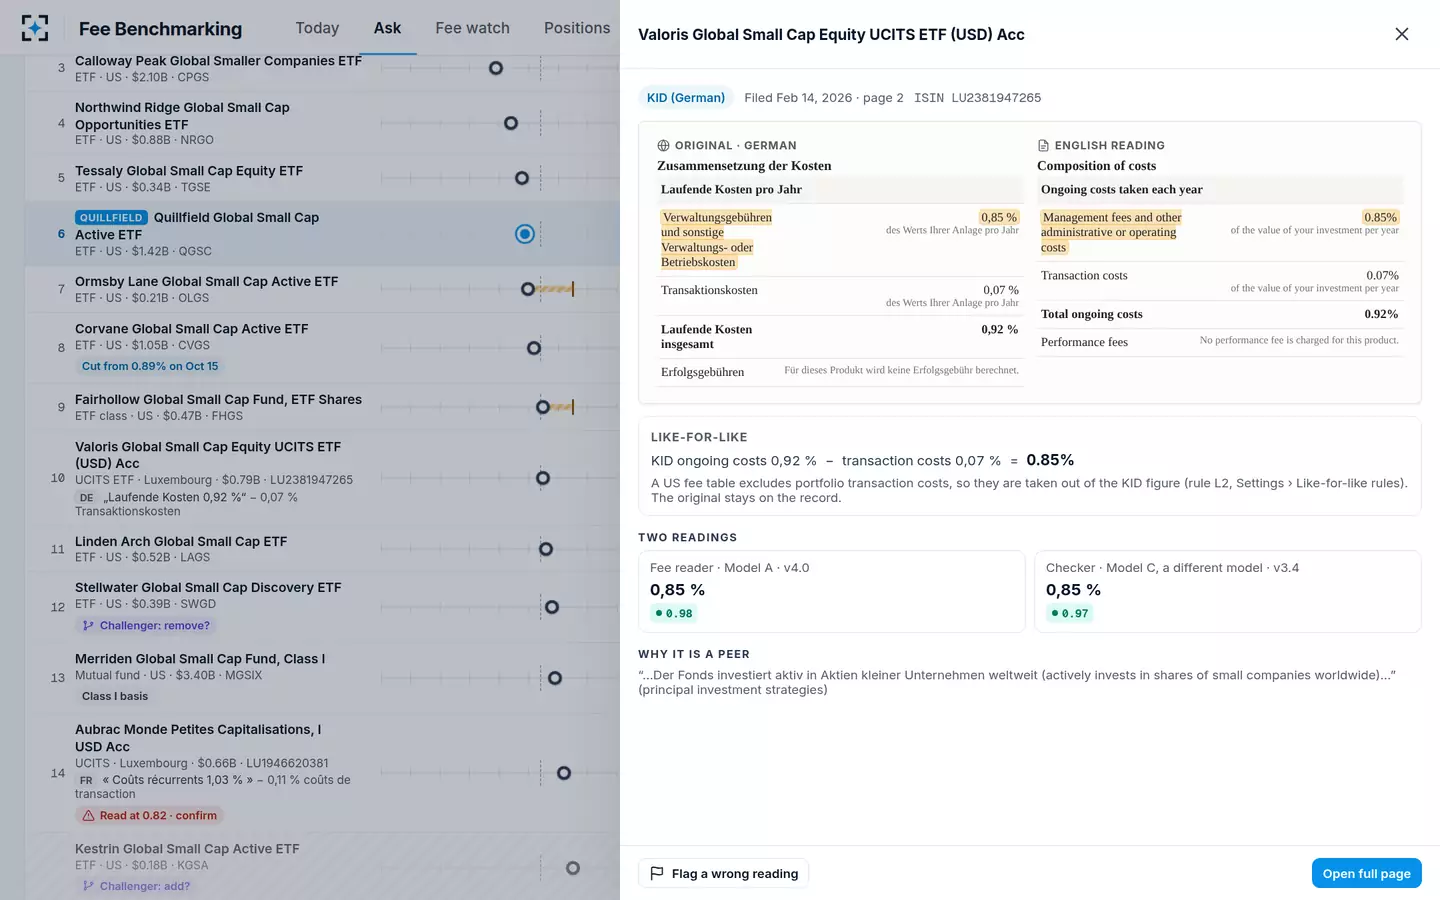
A peer fee study cites the page, not just the number
What to look for in a fee study or fee benchmarking tool
Look for evidence you can open, rules you can change, and a split between who builds the answer and who approves it. The checklist below turns that into things a provider can show on a fund of yours, not on a demonstration fund.
Eight questions for any fee study or fee benchmarking tool
- How is each peer chosen, and can I see the exclusions?
A category label alone is a shortcut. Ask for the rules and for every fund left out with its reason.
- Which measure, stated once for every peer?
Net after waivers or gross, with acquired fund fees treated the same way throughout.
- Does every figure open its source page?
Filing, date, page and line. If a director asks where 0.85% came from, the answer should be one click.
- How are waivers and their end dates handled?
A net fee ending before the next board meeting should be flagged, not averaged in silently.
- Are share classes mapped by rule?
No-load, no-12b-1 classes against each other; institutional against institutional.
- Can it read European KIDs in their own language?
And show how their cost figures are made comparable with US fee tables.
- Who checks the builder?
A second reading of every figure, and someone or something arguing with the peer set.
- What is kept, and for how long?
The peer set as approved, its versions and the sources, for at least the six years Rule 31a-2 requires.
Where Botminds' Fee Benchmarking fits, and where it does not
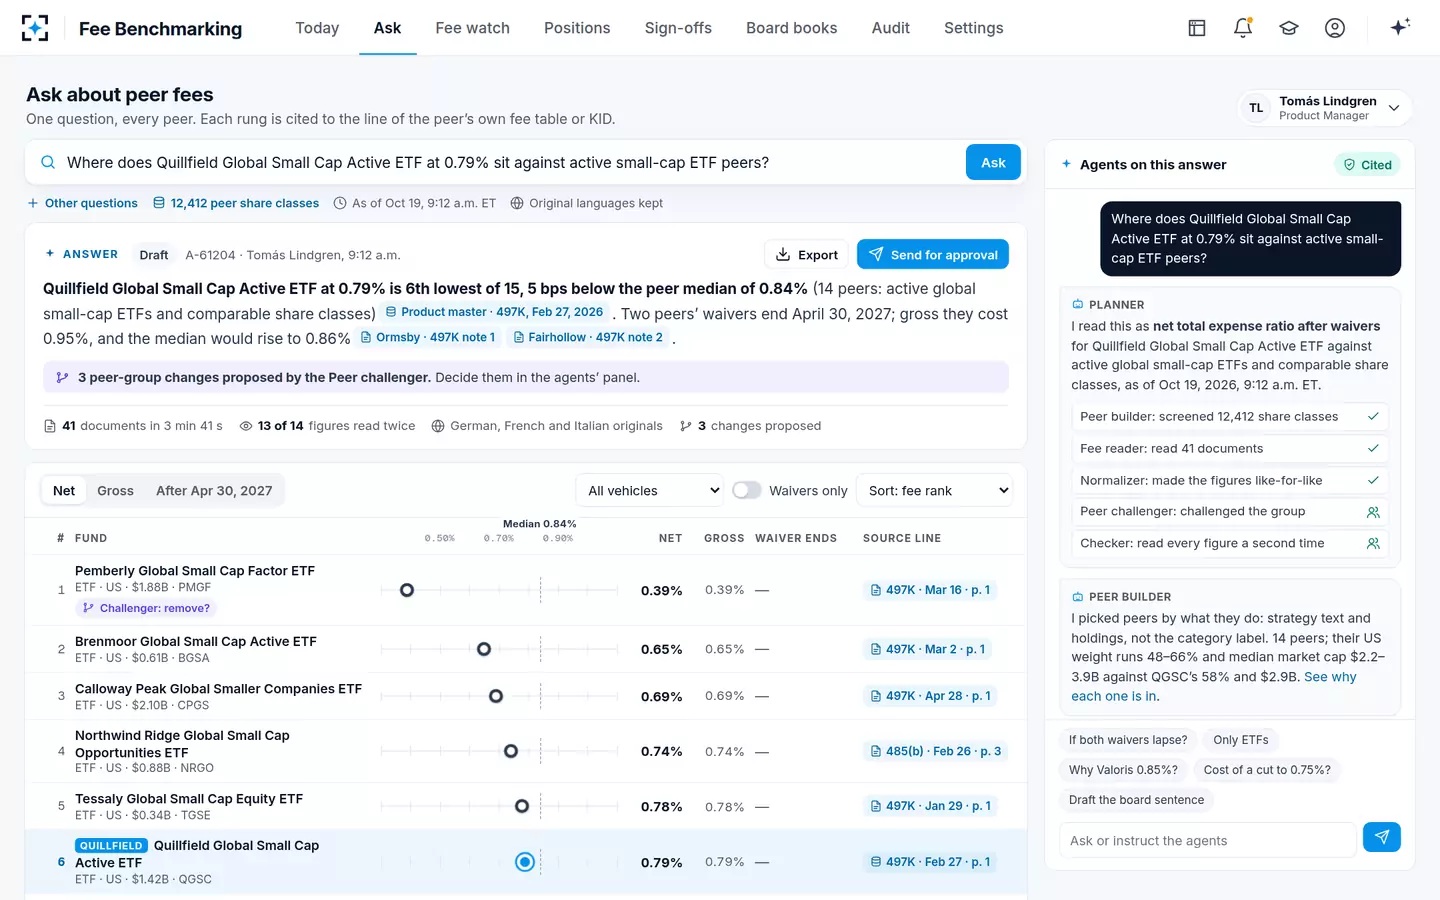
Botminds' Fee Benchmarking sits in the third layer. A product manager asks a fee question in plain words; agents build the peer group from each candidate's strategy text and holdings, read every peer's fee table, supplement or KID in its original language, make the figures like-for-like under written rules, and read each figure a second time on a different model. A Peer challenger argues with the peer set, a person decides each change with a reason, and a Pricing Committee member approves the answer as a dated fee position. A watch agent reads new filings overnight and re-runs the positions a fee cut or a waiver change touches.
It is not an investor calculator, and it does not replace FINRA's tool or the prospectus example for that purpose. It does not bring its own fund categories: it uses your data vendor's categories, assets and flows as one input and builds the peer set from documents. And it is the adviser's own tool. A board that wants a peer report from an independent provider can keep one; the solution's role is then to check that report's figures against the filings and to answer the pricing questions that come up between board cycles. A 30-day pilot on last year's board materials is the fastest way to see whether it fits.
One question, every peer cited: the answer a pricing committee signs
How often should a peer fee study be refreshed?
At least once a year for the formal review, and whenever the market moves enough to change the answer. US boards review advisory contracts annually, UK managers must assess value at least annually, and ESMA expects EU managers to review costs and fees at least as often as they assess fund performance, which is at least annually. Those are floors. A pricing committee meets more often, and the evidence it relies on goes stale on its own schedule.
Three events should trigger a refresh between cycles. A peer files a supplement that cuts its fee: in the sample, a competitor's 497 supplement on 15 October took its fee from 0.89% to 0.82% and made a fee position approved in July out of date. A peer's waiver approaches its end date, which can lift the median without any fee changing. And a new fund launches into the strategy at a lower price, which a vendor category may not show for weeks. A study bought once a year cannot catch any of the three; a tool that reads new filings every night can, and should tell the owner which approved positions each change touches.
What does a peer fee study cost?
Providers of fee studies and benchmarking tools don't publish their prices, so the comparison that matters is with the work the study replaces, priced in your own hours. Botminds' own estimate for one peer-fee answer on a 14-peer group by hand is about five and a half working days: screening and reading strategies, copying fee tables, reading European KIDs, sorting waivers and share classes, checking the weak figures, and drafting the approval. The same estimate puts the work at under a day with the agents, most of it the approval itself.
Where the days of one hand-built peer fee answer go
By hand · about 5.5 working days
- Screening and reading strategies · 1 d · 18%
- Copying fee tables · 1.5 d · 27%
- Reading European KIDs · 1 d · 18%
- Waivers and share classes · 0.5 d · 9%
- Checking figures · 0.5 d · 9%
- Approval and the board paragraph · 1 d · 19%
Put your own rates on those days. For a reference point, the Bureau of Labor Statistics gives median pay for financial analysts of $49.79 an hour in 2025 (BLS Occupational Outlook Handbook), and the people who sign pricing positions cost more. The larger cost is usually not the hours but the cadence: a study bought once a year is out of date the first time a competitor files a fee cut, and a pricing committee meets more often than a board renews a contract.
Questions people ask
What is the FINRA Fund Analyzer used for?
It helps investors compare the costs of mutual funds, ETFs, exchange-traded notes and money market funds, including the effect of breakpoint discounts, waivers and wrap or flat fees over a chosen holding period. FINRA notes that its projections depend on the rate of return the user selects and are not actual returns.
How do I compare mutual fund fees?
Compare the same share class type on the same measure: total annual fund operating expenses after any waiver, from each fund's prospectus fee table, with the waiver's end date noted. Then read the cost example below each fee table, which assumes $10,000, a 5% annual return and unchanged expenses, so funds can be compared on one basis.
Can a fee analyzer replace a 15(c) peer report?
No. An analyzer projects costs for funds the user picks; a 15(c) peer comparison has to explain which funds were chosen and why, rest on figures a board can trace, and be kept for six years. A calculator can still help a director sense-check what a fee means in dollars for a typical account.
What is a mutual fund fee comparison calculator?
It is a tool that takes two or more funds, an amount and a holding period, and shows the dollar cost of each fund's fees and their effect on value. The prospectus fee table example is a fixed version of one: the same $10,000 and 5% return for every fund, over 1, 3, 5 and 10 years.
Should a fund board rely on its adviser's own fee study?
It can rely on it if it can test it: the peer rules, the exclusions and the source of each figure should be open to the directors and their counsel. Many boards also commission an independent report. Either way, what protects the board is evidence it can open, not who produced the spreadsheet.