The fastest way for a fund complex to choose a fund fee comparison tool is to make it redo work the team has already done. Take last year's board fee materials, pick three peer positions the directors relied on, and ask the tool to rebuild each one from the filings: the peer set, every fee figure with its source page, the waivers and their end dates, the share classes. Fix the pass marks before the pilot starts, so the result is a decision rather than an impression. A public calculator such as FINRA's Fund Analyzer, a fee database with a category screen and a cited peer study all claim to compare expense ratios; only the last is built to pass these tests. Botminds' Fee Benchmarking, which answers peer fee questions for fund product and board teams with every peer fee cited to its own fee table, is designed to be judged this way, in 30 days, on your own funds.
Five pass-or-fail tests for an expense ratio comparison tool, set before the pilot
- Every figure opens its page
Each peer fee links to the filing, date, page and line it came from; a sample of 20 is checked by hand with no misses.
- Every figure was read twice
An independent second reading of each figure, with disagreements and low-confidence readings sent to a person.
- The peer set explains itself
Written rules, every candidate in or out with a reason, and a challenge that found or confirmed the hard calls.
- Waivers, classes and KIDs are like-for-like
Net and gross with end dates; classes mapped by rule; European cost figures moved to one basis with the original kept.
- It stays current and it is kept
A new filing re-runs the positions it touches; approved versions are frozen and retained at least six years.
What must an expense ratio comparison tool prove before a board relies on it?
It must prove that its figures are true, its peers are defensible and its output can be kept and explained years later. A US fund whose board leaned on fee comparisons to approve an advisory contract must say which comparisons it used and how they helped (SEC, 2004 disclosure release), and the materials the board considered must be kept for six years (Rule 31a-2(a)(6)). The FCA has said that comparisons made "without first adjusting for differences in service levels" undermine a value assessment (FCA, August 2023). ESMA expects a pricing process based on data from which a supervisor can "reproduce ex post the calculations" fund by fund (ESMA, June 2020).
A tool built to help an investor choose between funds is not built for any of that. FINRA describes its Fund Analyzer as helping investors see the effect of fees on up to three chosen funds, with projections "based on the rate of return you select" (FINRA, September 2024). That is the right job for that tool. The pilot below tests the other job: comparisons a pricing committee and a board will sign and keep.
Why test on last year's board fee materials?
Because you already know the answers, and you know which ones were hard. Last year's materials contain peer positions the directors relied on, the analysts who built them, and in most complexes a list of questions directors asked. A tool that rebuilds three of those positions shows its method on cases with a known result; a tool shown only on a vendor's sample fund shows its interface. Retention rules mean the materials are on file: the six-year rule covers documents the directors considered in approving or renewing the contract.
Choose the three positions to stretch the tool. One should be a plain domestic fund with no waivers, as a control. One should have a peer with a waiver ending within the year, or a recent fee cut filed in a supplement. One should include European peers whose cost figures come from KIDs in another language. If last year's materials were built by an outside provider, the pilot also tests that provider's figures, which is useful in its own right.
Thirty days, four weeks, one decision
- Week 1: rules, data and the three positionsDays 1–7
- Week 2: rebuild the three positionsDays 8–14
- Week 3: check by hand and challengeDays 15–21
- Week 4: live questions and the watchDays 22–28
- Decide29–30
Week 1: write the rules and fix the pass marks
Write down the peer rules and like-for-like rules your team actually uses, even if they have lived only in an analyst's head: the strategy test, the share-class basis, the treatment of waivers, acquired fund fees and European transaction costs, minimum size, and how fresh a fee table must be. Then fix the pass marks: how many figures will be checked by hand, what counts as a miss, and what difference from last year's position must be explained. Load the product master and last year's peer groups, and give the tool access to the filings and KID feeds it will read.
Test 1: does every figure open its page?
Pick 20 peer figures at random across the three positions and open each source the tool cites. The figure must match the line on the page, in the original language for a KID, and the date must be the latest filing as of the position date. Then check that each figure was read twice, independently, and that the low-confidence readings went to a person rather than into the table. In Botminds' Fee Benchmarking's fictional sample, 13 of 14 peer figures were confirmed by a second reading on a different model, and the fourteenth, a French KID read from a scan at 0.82 confidence, went to the product manager to confirm against the page.
Test 2: does the peer set survive a challenge?
Compare the rebuilt peer set with last year's and explain every difference. A new fund is fine if it launched after last year's materials or was missed; a removed fund needs a reason. Ask the tool, or a second analyst, to argue with the set: look for quasi-index funds in an active group, missing launches, mandate drift and share-class mismatches. In the sample, a challenge on a different model proposed removing a fund labelled active with an active share of 18%, adding a launch the data vendor had not classified, and removing a fund with 64% in US companies; the product manager accepted two and rejected one, each with a reason. Why the peer group needs a challenger sets out that design.
A rebuilt peer set, with its rules, its challenge and its exclusions
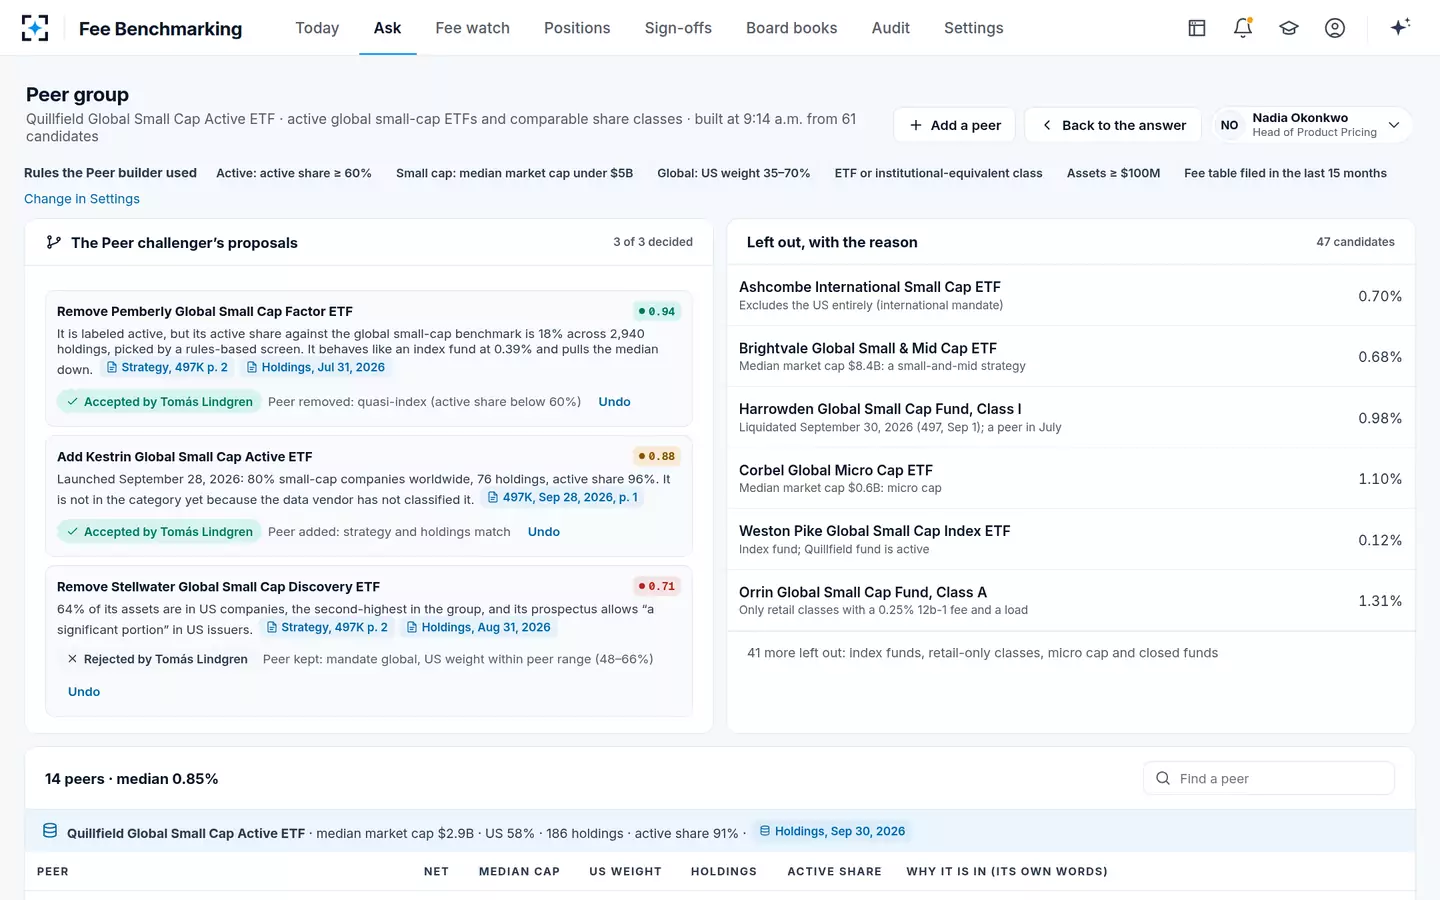
Test 3: are waivers, share classes and European costs like-for-like?
Check three adjustments on the rebuilt positions. Waivers: every net figure shows its gross and its end date from the fee table footnote, as Form N-1A requires the fund to disclose (Item 3, Instruction 3(e)), and waivers ending before the next board date are flagged. Share classes: the same class rule applied to every peer, so a retail class with a 12b-1 fee and a load is not compared with an institutional one. European costs: KID ongoing costs moved to the US basis by taking out their transaction-cost line, or the reverse, with the original figure kept beside the adjusted one.
The failure to look for is silent mixing. A tool that ranks one fund's net against another's gross, or a German KID's ongoing costs against a US expense ratio, will produce a tidy table that is wrong. The two guides on net and gross expense ratios and UCITS ongoing charges list the specific traps.
Test 4: does it stay current, and is it kept?
In week 4, use the tool live. Answer two real pricing questions as they come up, and let it read new filings for a week. When a peer files a supplement that cuts a fee or ends a waiver, the positions it touches should be re-checked and their owners told, and an approved position should never change silently: a new version is drafted and approved, and the old one stays frozen. In the sample, the watch agent read 37 peer changes in one weekend and 312 new filings and KIDs overnight, and flagged a competitor's fee cut from 0.89% to 0.82% the day after it was filed.
New filings read overnight, matched to the positions they change
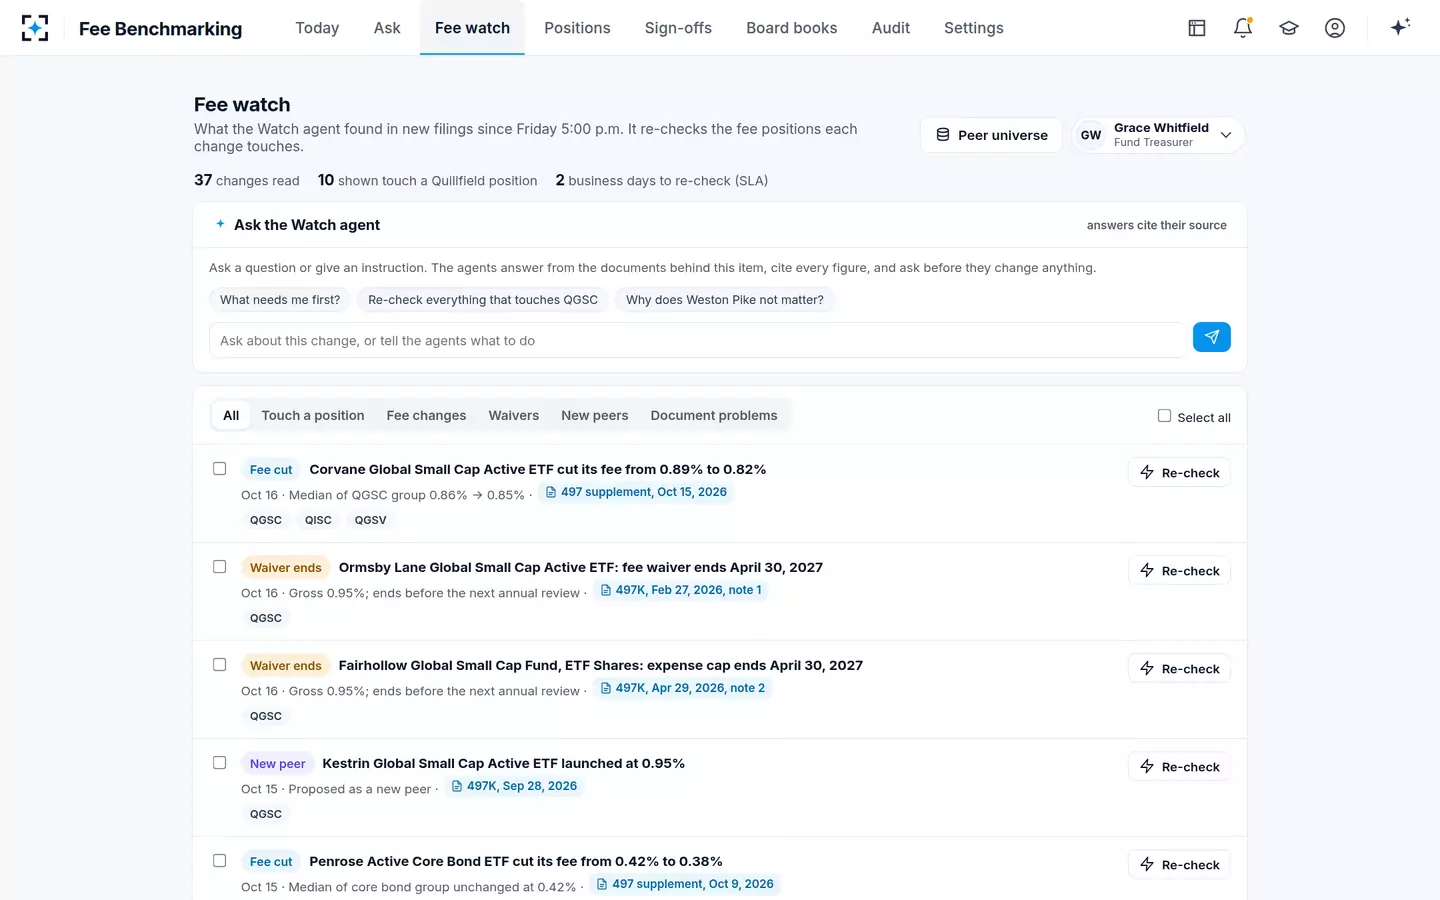
How to score it: comparison calculator, fee database or cited study
Score each candidate against the pass marks you fixed in week 1, and include your current method as a candidate. The table shows how the three common kinds of tool tend to fare on the five tests; your pilot replaces the tendencies with results.
Three kinds of expense ratio comparison tool against the five tests
| Test | Comparison calculator | Fee database with category screen | Cited peer study |
|---|---|---|---|
| Every figure opens its page | No: figures come from a data feed | Rarely: figures come from the database | Yes, by design: filing, date, page, line |
| Every figure read twice | No | Depends on the vendor’s own checks, not visible | Yes: second reading, low confidence to a person |
| Peer set explains itself | No peer set: the user picks funds | A category; exclusions not shown | Written rules, reasons, a challenge |
| Like-for-like adjustments | Left to the user | Partly: often one measure, classes by label | Written rules, originals kept |
| Current and kept | Not designed for retention | Current data; past versions vary | Re-run on new filings; versions frozen |
From pilot results to a decision
Agent
RebuildThe tool rebuilds three of last year’s positions and answers live questions in week 4.
Never: be scored on a vendor’s sample fund instead of yours
A person decides
Pricing or board reporting analystOpens 20 sources, compares peer sets with last year’s, explains every difference.
A person decides
Head of product pricing and fund treasurerScore each test against the pass marks fixed in week 1, then decide: adopt, extend the pilot, or stop.
What a good pilot result looks like
A good result is specific enough to sign. All 20 hand-checked figures match their pages, or the misses are explained and fixed. Every difference between a rebuilt peer set and last year's has a reason a director would accept: a launch added, a closure removed, a quasi-index fund taken out. The waiver and class rules were applied the same way to every peer, with no silent mixing of net and gross or of KID and fee-table bases. In the live week, each real change in a peer's filings reached the positions it touched within the service level you set; in the sample's configuration that is two business days to re-check.
Watch for three ways a pilot misleads. A vendor that pre-loads your three positions before the pilot starts is showing you its preparation, not its method. A pilot that measures only speed rewards the tool that skips the second reading and the challenge. And a pilot that never uses the tool live misses the part of the job that makes a fee study go stale: the filings that arrive the week after it is approved.
What you bring, and what it costs you
You bring last year's materials and people's time; the tool brings the reading. For Botminds' Fee Benchmarking that means your product master of funds, classes, fees and assets; last year's peer groups and positions; your written peer and like-for-like rules; and access to the public filings and the KID feed it will read, with your data vendor's categories, assets and flows as an input. On your side, plan for an analyst for most of weeks 2 and 3, and an hour or two each from the head of pricing and the fund treasurer at the start and the end.
The cost of skipping the test is easier to see. A board that relies on a fee chart with bad comparisons is exposed to the same criticism the SEC made in 2015, when it found an adviser had given directors a fee chart whose comparisons did not fit and whose figures were wrong (SEC press release 2015-124). A pilot that rebuilds last year's positions will also tell you whether last year's chart had any.
What the approver sees at the end of a rebuilt position
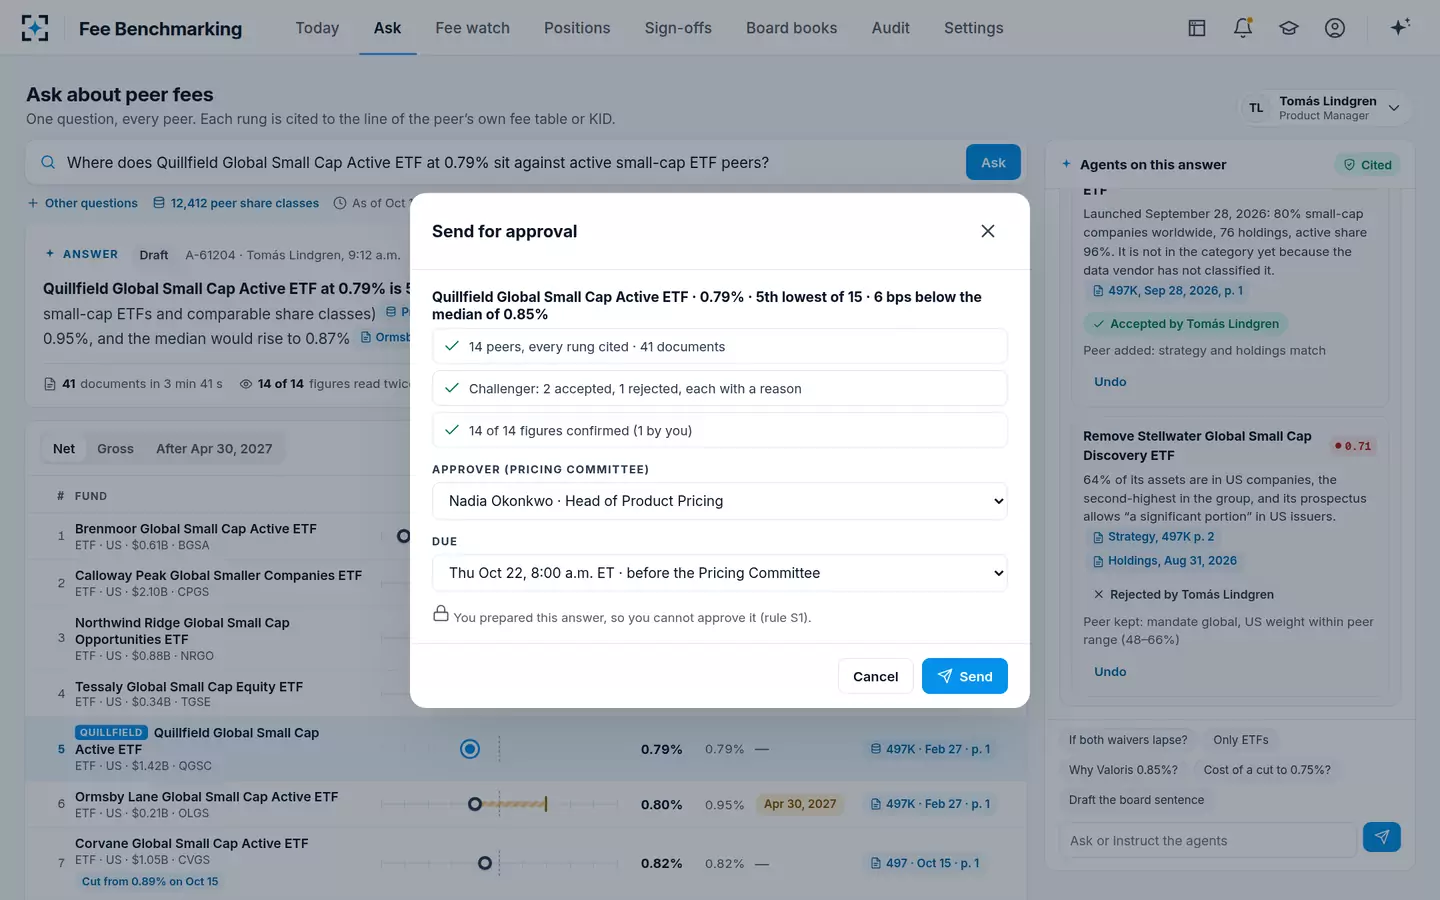
Questions people ask
How should a board compare the expense ratios of peer funds?
Use each fund's prospectus fee table, the total annual fund operating expenses line, net of any waiver with its end date noted, for the same type of share class. Then compare the cost examples below the fee tables, which assume $10,000 invested and a 5% annual return for every fund.
What is an expense ratio comparison calculator?
A tool that turns two or more expense ratios into dollar costs over a holding period, so an investor can see what the difference costs. It answers what chosen funds will cost, not whether a fund's fee is right against its market, which needs a peer set someone has chosen and can defend.
How long should a fee benchmarking pilot run?
Thirty days is enough for three rebuilt positions, a hand check, a challenge and a week of live use. Shorter pilots tend to skip the live week, which is where a tool's handling of new filings, fee cuts and expiring waivers shows.
Can we pilot on a fund we are about to launch?
Yes, as an extra question in week 4, but not instead of last year's positions. A launch has no known answer to compare with; last year's board materials do, which is what makes them the fair test.
What if the pilot finds errors in last year's peer report?
Treat it as a finding, not an embarrassment. Note each difference, its source and its effect on the median, and take it to whoever owns the board materials. Correcting next year's materials is better than learning about it from an examiner or a plaintiff.
What should an expense ratio comparison chart show?
The fund and each peer on one measure, the median, net and gross where waivers exist with their end dates, and a source for every figure. In Botminds' Fee Benchmarking that chart is the peer ladder, and one switch shows it as it will look after the waivers end.