The ongoing charges figure, or OCF, is the single percentage a UCITS fund uses to show its annual running costs: every charge deducted from the fund's assets over a year, divided by its average net assets, leaving out performance fees, entry and exit charges and portfolio transaction costs. It is close to a US fund's total annual operating expenses, which also leave out transaction costs, but not identical. And since 1 January 2023, EU UCITS sold to retail investors disclose costs in a PRIIPs key information document instead, whose ongoing costs do include transaction costs. So a peer table that mixes a German KID, a UK OCF and a US fee table is comparing three measures unless someone adjusts them. Botminds' Fee Benchmarking, which answers peer fee questions for fund product and board teams, reads each document's own cost lines in the original language and applies a written rule before any fund is ranked.
Three fee measures, line by line: what each one counts
US expense ratio: In, as Management Fees
UCITS OCF: In
KID ongoing costs: In, within ongoing costs
US expense ratio: In, as 12b-1 fees
UCITS OCF: In: “any costs of distribution”
KID ongoing costs: In, including payments passed to distributors
US expense ratio: In, as Other Expenses
UCITS OCF: In
KID ongoing costs: In
US expense ratio: Out: “not reflected in annual fund operating expenses”
UCITS OCF: Out: brokerage, taxes and implicit dealing costs excluded
KID ongoing costs: In, on a line of their own
US expense ratio: In: Management Fees include performance-based fees
UCITS OCF: Out, disclosed separately
KID ongoing costs: Out of ongoing costs, shown as an incidental cost
US expense ratio: Out of the total, shown as shareholder fees
UCITS OCF: Out
KID ongoing costs: Out, shown as one-off costs at their maximum
US expense ratio: Last fiscal year, restated for material fee changes
UCITS OCF: Ex post, at least once a year
KID ongoing costs: The actual level for the previous year
What is the ongoing charges figure for a UCITS fund?
The ongoing charges figure is defined by a European methodology, not by each fund. CESR, ESMA's predecessor, set it out in 2010 so that investors could "compare UCITS more easily", with "a presumption that all costs borne by the fund must be taken into account unless they are explicitly excluded" (CESR/10-674). Included are all payments to the management company, directors, depositary, custodians and any investment adviser, payments for outsourced services such as fund accounting and transfer agency, registration and regulatory fees, audit fees, legal and professional fees, and "any costs of distribution".
Six things are excluded: entry and exit charges paid by the investor, performance-related fees, interest on borrowing, portfolio transaction costs "whether those costs are explicit (e.g. brokerage charges, taxes and linked charges) or implicit (e.g. costs of dealing in fixed-interest securities, market impact costs)", payments for holding derivatives such as margin calls, and soft commissions. A fund of funds adds its underlying funds' ongoing charges. The figure is calculated at least once a year on an ex-post basis, separately for each share class, and expressed to two decimal places.
Ongoing charges figure vs total expense ratio: is the OCF the same as the TER?
Close, but not the same. "Total expense ratio" is an older and looser term, used in factsheets and fund documents in many markets, and it has no single method; the OCF has one. In the United States the comparable figure is the fee table's "Total Annual Fund Operating Expenses", and the comparison with the OCF turns on two lines. Both leave out portfolio transaction costs: Form N-1A keeps trading costs out of the operating-expense total and the cost example alike (Form N-1A, Item 3). But performance fees go opposite ways. A US fund folds any performance-based advisory fee into its management fee line, while the OCF excludes performance fees and shows them separately.
For most long-only funds without a performance fee, an OCF and a US gross expense ratio can therefore sit in the same column, provided the share classes match and any US waiver is handled the same way, as explained in net expense ratio vs gross expense ratio. For a fund with a performance fee, add it back or take it out on both sides, and say which.
What a PRIIPs KID's ongoing costs add: transaction costs
A PRIIPs KID breaks costs into one-off costs, ongoing costs and incidental costs, and its ongoing costs include transaction costs. ESMA describes the KID's ongoing costs as including "management fees, transaction costs and other ongoing costs", with transaction costs "disclosed as a stand-alone category" (ESMA, November 2025). EU UCITS moved onto the KID when the new PRIIPs rules applied from 1 January 2023 (European Commission, June 2022). ESMA also notes that the KID's ongoing costs correspond to the actual level for the previous year, which is why the regulator now leans on them in its own cost statistics (ESMA, March 2026).
The size of the transaction-cost line depends on the strategy. ESMA found passive funds and ETFs associated with lower transaction costs, "probably because of the lower portfolio turnover", and funds investing in areas such as emerging markets or Asia with higher ones (ESMA, 2025). An adjustment that is a few basis points for a European large-cap tracker can be the whole gap between an active small-cap UCITS and its US peer. How the KID's cost figures are produced and checked is covered in PRIIPs KID cost disclosure, from Botminds' PRIIPs KID Production.
The UK keeps the OCF as its headline cost
The UK went the other way. UK UCITS still publish a key investor information document with an OCF, and the FCA's consumer composite investments regime, which replaces both the PRIIPs and UCITS disclosure rules for UK products, keeps it as the headline. The FCA's final rules make the OCF the first cost a consumer sees, as both a percentage and a pounds-and-pence amount, and state that "Transaction costs are not included in the OCF"; explicit transaction costs get a separate numerical disclosure (FCA PS25/20, December 2025). The regime began on 6 April 2026 and goes fully live on 8 June 2027.
So a peer table for a global strategy can hold three bases at once: a US fee table total, a UK OCF, both without transaction costs, and an EU KID figure with them. The arithmetic to align them is easy. Knowing that it is needed, and finding the right line in a 3-page KID in German, French or Italian, is the work.
Making a cross-border peer table like-for-like: a worked example
Take a sample from Botminds' Fee Benchmarking, on fictional funds: a US active global small-cap ETF at 0.79%, compared with 14 peers that include two Luxembourg UCITS. Valoris Global Small Cap Equity UCITS ETF files its KID in German. Its cost table reads "Laufende Kosten 0,92 %", of which "Transaktionskosten 0,07 %". The US fee table leaves portfolio transaction costs out, so the solution's written rule takes them out of the KID figure: 0.92% less 0.07% is a like-for-like 0.85%. Two readings on different models agree, at 0.98 and 0.97 confidence.
Aubrac Monde Petites Capitalisations, the second, files in French: "coûts récurrents" of 1.03%, of which 0.11% are transaction costs, so 0.92% like-for-like. Its page was a scan, read at 0.82 confidence, below the 0.90 the rules require, so it went to the product manager, who confirmed it against the scan. Had both KID figures gone into the table as printed, two peers would have looked 7 and 11 basis points dearer than they are, and a median built partly on them would have moved.
A German KID's cost table beside the English, made like-for-like
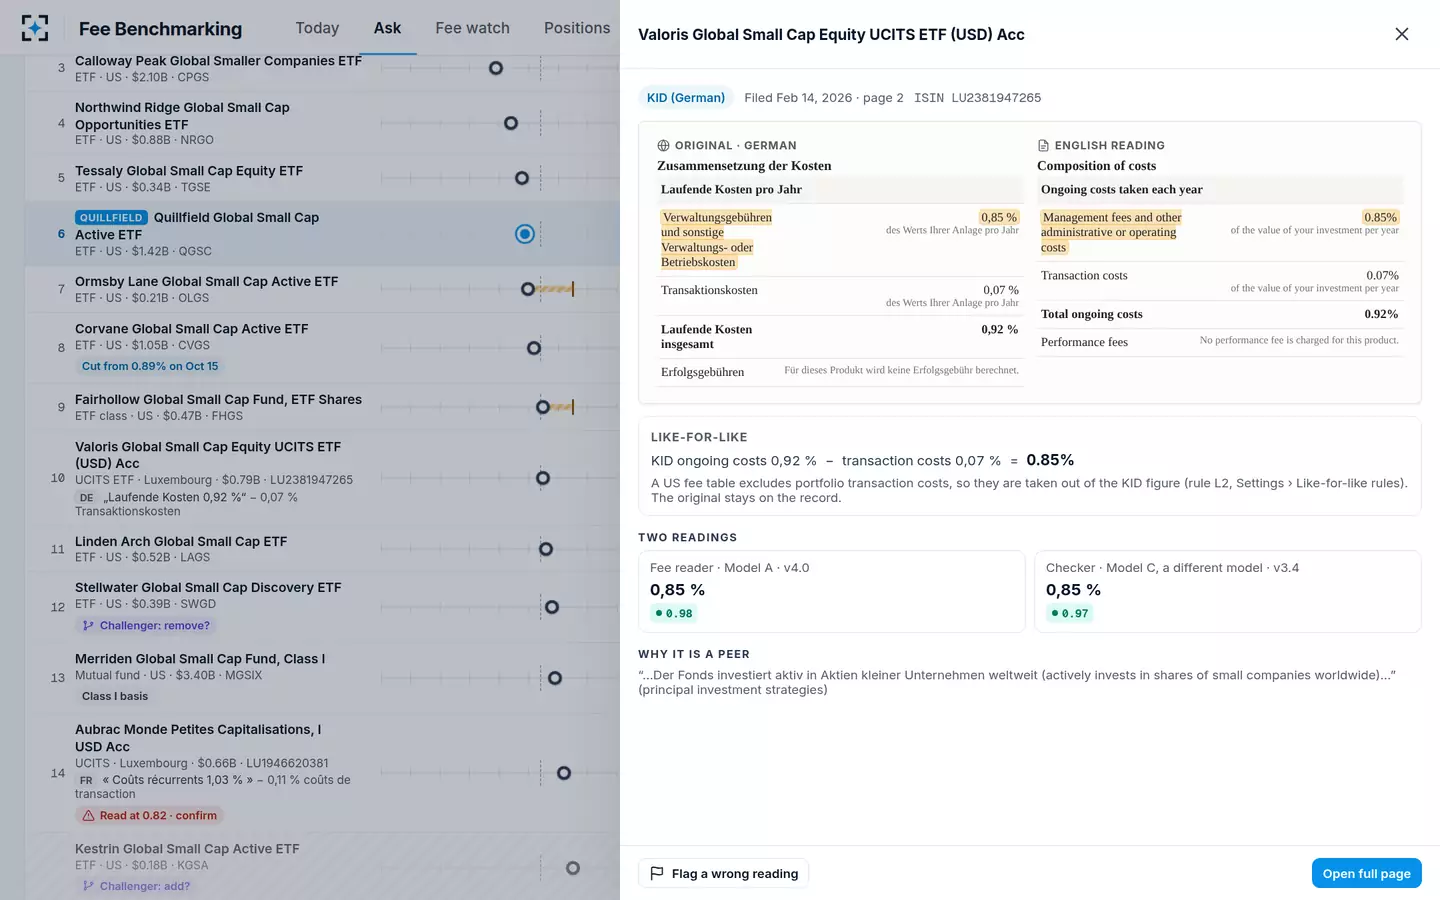
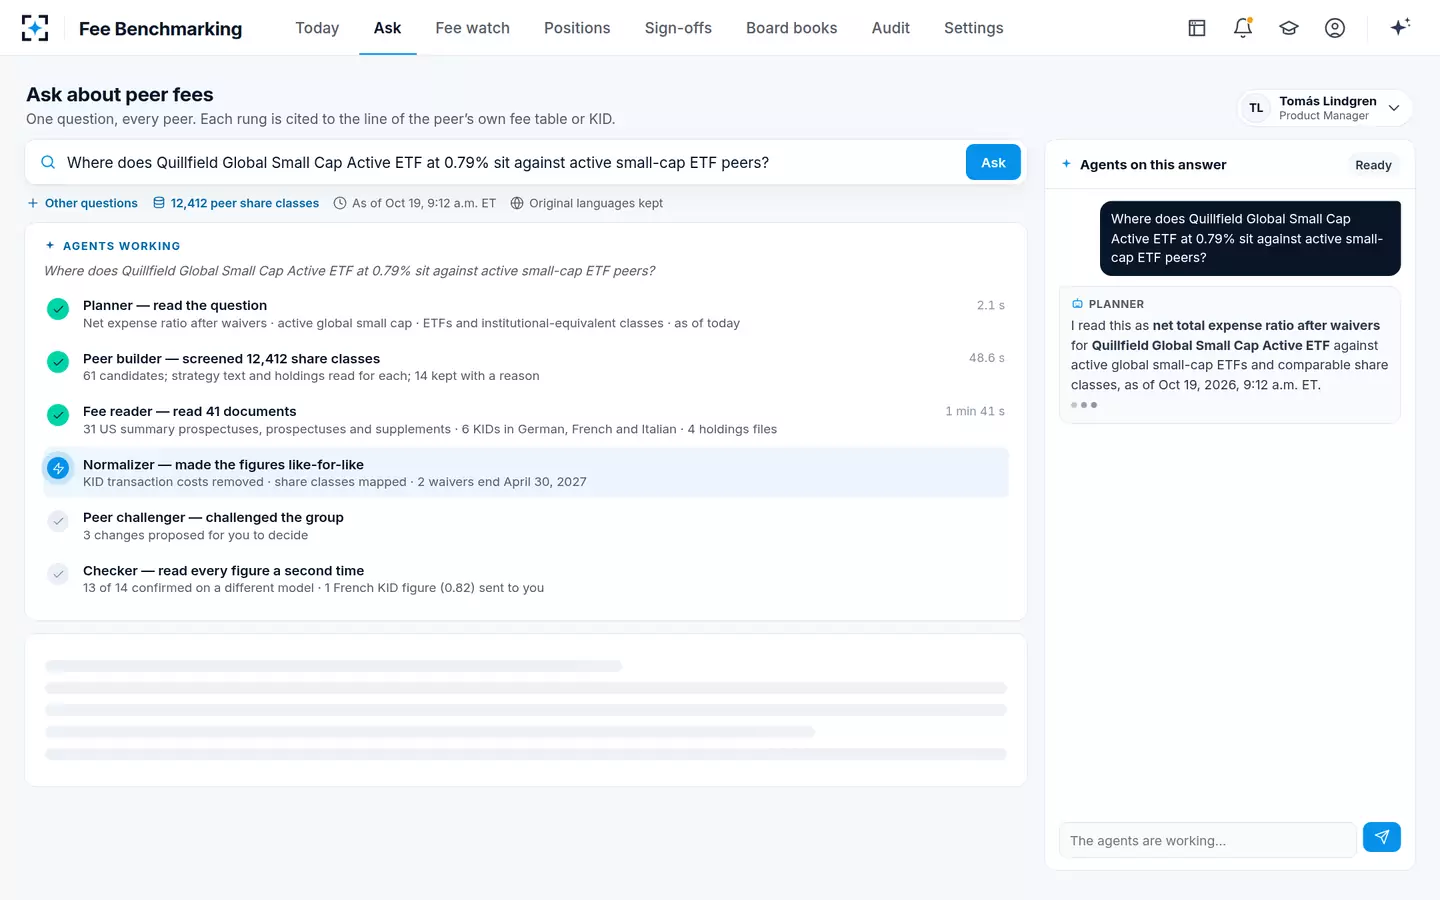
US fee tables and European KIDs read in one pass, then made like-for-like
Rules to write down before a cross-border fee comparison
- Pick the base and name it
US basis (no transaction costs) or KID basis (with them). Every column says which.
- Move transaction costs, never estimate them
Take the KID’s own transaction-cost line out, or add a disclosed figure in. Do not guess a US fund’s trading costs from turnover.
- Treat performance fees the same way on both sides
In a US management fee, out of a UCITS OCF, an incidental cost in a KID.
- Match share classes by rule
Institutional or clean classes against each other; a class with a distribution payment against its own kind.
- Keep the original figure and language
The adjusted number is a derivation. The printed line, its page and its date stay beside it.
- Send unclear readings to a person
A scanned KID page read with low confidence is confirmed by someone, not averaged in.
Which basis should a global peer table use?
Use the basis of the decision the table supports, and show the other beside it. A US board reviewing an advisory contract reads US fee tables, so a global peer set for a US fund belongs on the US basis, with KID figures reduced by their transaction-cost lines. An EU management company testing its own UCITS against similar funds for its pricing process will often prefer the KID basis, because that is what its investors see, and should mark any US peer as excluding transaction costs, since a US fee table gives a portfolio turnover rate rather than a transaction-cost percentage. A UK assessment of value compares ongoing charges figures, so it sits closer to the US basis than to the KID.
What a table must never do is leave the basis implicit. Every column header should name the measure, every adjusted figure should keep the printed one beside it, and the rule that moved it should be written down where a reviewer can find it. In the sample, the rule is one line in the solution's settings, changed only with Pricing Committee approval: KID costs count management fees and other administrative or operating costs only, with transaction costs and performance fees excluded.
Share classes and distribution payments can outweigh the fee itself
In Europe the share class can matter more than the manager. ESMA found that distribution costs "account for 48% of total costs for UCITS", and that where a distributor and the fund's manufacturer have an inducement agreement, those payments "account for up to 45% of the ongoing costs" (ESMA, 6 November 2025). A retail class that carries such payments and an institutional or clean class of the same fund can differ by more than any two managers' fees.
The FCA has seen the same problem from the other side. In its 2023 review of value assessments it described a firm comparing funds whose ongoing charges figure excluded a platform charge with competitors' funds whose figure included one, without adjusting (FCA, August 2023). The fix is the same written class rule on both sides of the table: in the sample, UCITS are compared on their institutional accumulating class in the base currency, and US mutual funds on their class with no load and no 12b-1 fee.
What ESMA's cost data show about European fees
ESMA's eighth costs and performance report, published on 3 March 2026, found UCITS ongoing costs still falling, "mostly due to new investment funds entering the market, as they usually charge lower fees" (ESMA, 3 March 2026). Between 2020 and 2024, ongoing costs for a one-year investment fell by 8% for retail equity funds and by almost 15% for retail bond funds, ETFs excluded. For share classes present in every year since 2020, the fall was far smaller: 2.6% for equity and 9% for bond funds (ESMA, March 2026).
European fund costs fell mostly where new funds arrived
Two lessons follow for a peer table. A median built from the whole market is pulled down by recent launches, so an older fund can drift above it without changing its fee. And because, in ESMA's words, "the dispersion of ongoing costs remains steady" while the averages fall, the gap between cheap and expensive active funds is not closing on its own. Which costs a European supervisor treats as undue, and how it tests them against similar funds, is covered in undue costs in UCITS.
The scale of European fund costs, in ESMA's figures
1.3%
ongoing costs of a one-year investment in retail equity UCITS, 2024
ESMA, March 2026
48%
of total costs of investing in UCITS are distribution costs
ESMA, November 2025
45%
of ongoing costs, at most, go to distributors under inducement agreements
ESMA, November 2025
~5 bp
lower average ongoing costs for share classes new in 2024 than for those present five years
ESMA, March 2026
Questions people ask
Does the ongoing charges figure include transaction costs?
No. CESR's methodology excludes portfolio transaction costs, explicit and implicit, from the OCF, and the FCA's rules for UK consumer composite investments confirm that transaction costs are not included in it. A PRIIPs KID is different: its ongoing costs include transaction costs on a line of their own.
Is a KID's ongoing cost the same as an expense ratio?
Not as printed. A US expense ratio leaves portfolio transaction costs out and includes any performance-based advisory fee; a KID's ongoing costs include transaction costs and show performance fees separately as an incidental cost. Subtract the KID's transaction-cost line, and align performance fees, before comparing.
Where do I find a UCITS fund's ongoing charges?
In the EU, in the cost tables of the fund's PRIIPs KID, which UCITS have used for retail investors since 1 January 2023. In the UK, in the key investor information document, and under the new consumer composite investments regime in the product summary, where the OCF is the headline cost. Factsheets usually repeat the figure.
What is a good ongoing charges figure for an equity fund?
It depends on the strategy, which is why a peer group matters. ESMA reported ongoing costs of 1.3% for a one-year investment in retail equity UCITS in 2024, with averages across equity strategies ranging between 0.5% and 2%. A passive large-cap fund and an active small-cap fund should not be judged against the same number.
Why can a fund's KID cost rise when its fees did not change?
Because the KID's ongoing costs reflect the previous year's actual costs, including transaction costs, which move with trading. A year of heavy turnover raises the transaction-cost line without any change to the management fee. That is one more reason to compare management and operating costs separately from transaction costs.