PRIIPs KID cost disclosure is set by Article 8(3)(f) of Regulation (EU) No 1286/2014 and Annexes VI and VII of Delegated Regulation (EU) 2017/653: a "Costs over time" table with total costs and the annual cost impact for €10,000 at one year and at the recommended holding period, and a "Composition of costs" table that splits them into entry, exit, management, transaction and incidental costs, in euros rounded to the nearest euro and percentages to one decimal place. The figures are calculated once and printed many times, in every language a share class is sold in, and the errors that reach investors usually enter after the calculation: a transposed digit in a post-edit, a stale sentence from translation memory, a thousands separator in the wrong locale. The way to know whether your checks catch them is to plant known errors in a sample of rendered KIDs and count. Botminds' PRIIPs KID Production reads every number in every version back against the data, which is the design a seeded test measures.
The examples come from a fictional sample range, Quillfield Global Funds SICAV, as it runs through the solution. The test design is ours and can be run on any KID process, with or without the solution.
Four outcomes of a seeded test on PRIIPs KID costs, and the one that costs money
Planted, and caught
Recall counts these
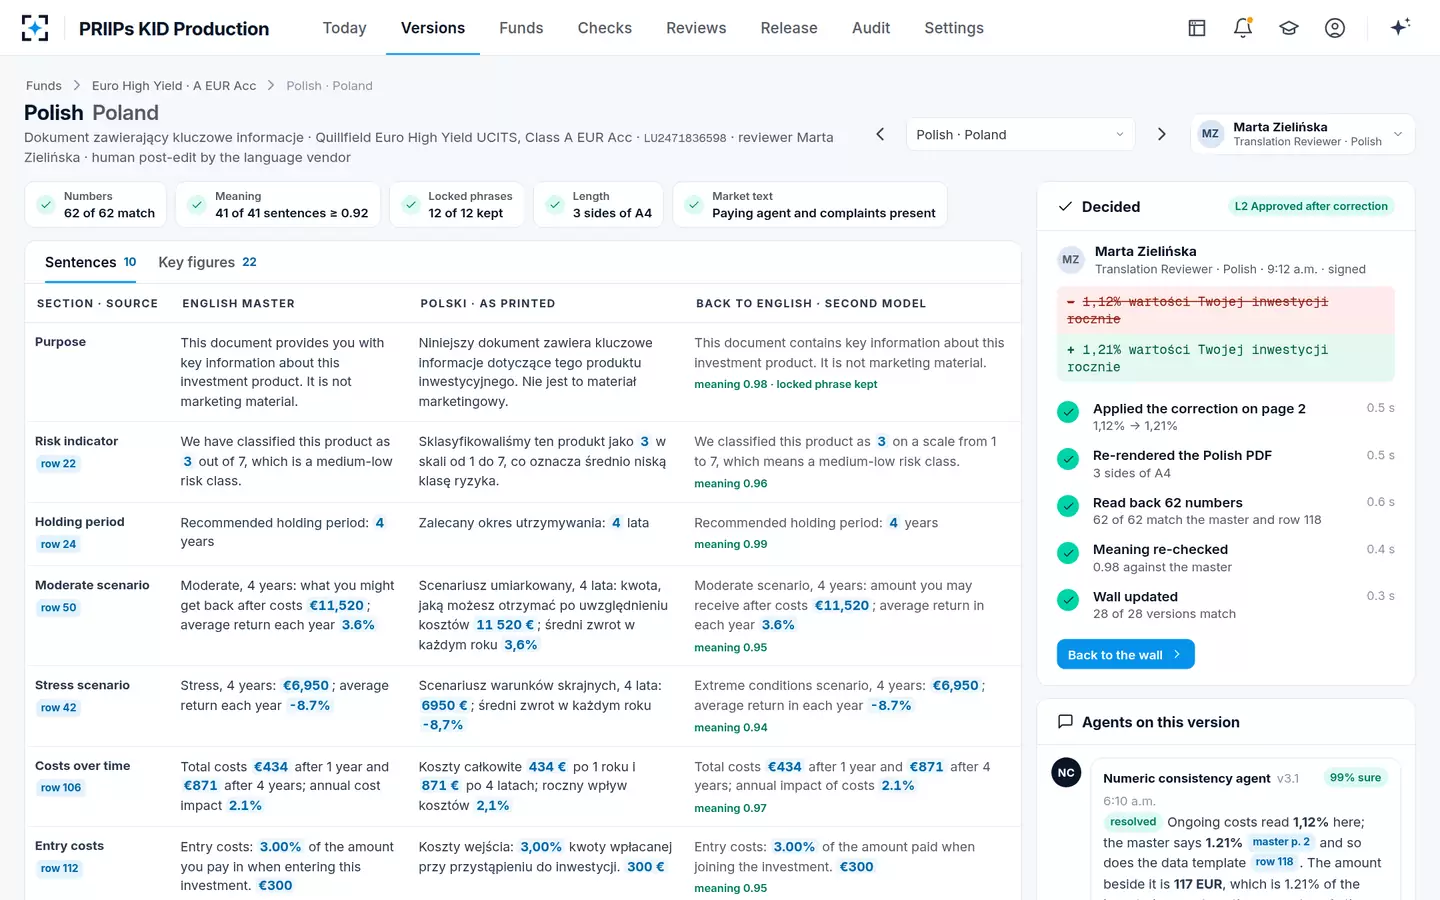
A planted 1,12% for 1.21% in the Polish ongoing-costs line is flagged, with the data row and the amount beside it (117 EUR) that still matches 1.21%.
Planted, and missed
The cell that reaches investors
A transaction cost sentence carried over from last February's KID passes because the reviewer checked only the totals, which were new.
Not planted, but flagged
Costs reviewer time
Two Romanian number-format flags below the confidence threshold go to the Romanian reviewer; where the format was right, each is a false alarm that cost a few minutes.
Not planted, and passed
Most of the pages
The other 61 numbers in the Polish version match the master and the data file in Polish format.
Recall = planted errors caught ÷ errors planted. False-alarm rate = clean figures flagged ÷ clean figures checked.
What must PRIIPs KID cost disclosure show?
The cost section shows the costs of the product in two tables and one warning. The Regulation requires "the costs associated with an investment in the PRIIP, comprising both direct and indirect costs to be borne by the retail investor, including one-off and recurring costs, presented by means of summary indicators of these costs and, to ensure comparability, total aggregate costs expressed in monetary and percentage terms" (Art. 8(3)(f)). Annex VII of the Delegated Regulation turns that into a "Costs over time" table and a "Composition of costs" table, under a prescribed warning that the person advising on or selling the product may charge other costs, unless the manufacturer knows they will not.
The arithmetic is prescribed too. Figures are for €10,000 invested, or €1,000 a year for regular-payment products (Annex VI, point 90); one-year figures assume a 0% net performance, longer ones the moderate scenario (point 71); the annual cost impact is the reduction in yield, the difference between the return with and without costs (point 70); and "The cost figures in monetary amounts shall be rounded to the nearest euro. The cost indicators in percentage terms shall be expressed to one decimal place" (point 78). How these KID costs line up against a UCITS ongoing charges figure or a US expense ratio is worked through in the ongoing charges figure guide.
The sample KID's cost section: every figure a seeded test should cover
| Figure | Sample value | Rule | Typical error |
|---|---|---|---|
| Total costs, exit after 1 year | €434 | Annex VI, points 61, 90 | Not equal to the sum of the composition lines |
| Annual cost impact, 1 year | 4.3% | Annex VI, points 70–71(a) | Computed on the moderate scenario instead of 0% |
| Total costs, exit after 4 years | €871 | Annex VI, points 61, 90 | Last cycle's figure after a fee change |
| Annual cost impact, 4 years | 2.1% each year | Annex VI, points 70–71(b) | Inconsistent with the moderate scenario printed above |
| Entry costs | 3.00%, €300 | Annex VI, point 3 | Actual instead of maximum distribution fee, or the reverse |
| Management fees and other costs | 1.21%, €117 | Annex VI, point 67 | Old fee before the board resolution took effect |
| Transaction costs | 0.18%, €17 | Annex VI, points 7–23c | Below the explicit-cost floor, or a stale sentence |
| Performance fee | None | Annex VI, point 24 | Missing statement that there is none |
Where KID cost figures go wrong: maximums, stale lines and number formats
Some errors are built into the inputs. A KID shows the maximum entry and exit costs, and the maximum distribution fee where the actual one is not known to the manufacturer (Annex VI, points 3(a) and 5(g)). ESMA, comparing those with what manufacturers actually charged, found that "PRIIPs KIDs maximum one-off fees do not reflect actual fees" (ESMA, total costs of investing in UCITS and AIFs, November 2025), and its 2026 market report put the actual amounts, where the manufacturer charges them, between 38% and 96% lower than the maximum levels in the KIDs (ESMA, Costs and Performance report, 2025 edition). That is a disclosure design issue, not an error, but it means a reviewer cannot use "does this look like what investors pay?" as a test.
Most errors are made after the calculation. In the sample range's reissue, reading all 4,212 rendered versions back against the data found 47 mismatches, and none was in the calculation itself.
47 mismatches in one reissue, by cause: none came from the calculation
A seeded-error test for KID costs: how to plant errors and count them
A seeded test measures a review by giving it known errors. Take a copy of a recent reissue, rendered as investors would see it. Choose a sample of versions across languages and share classes, and in them plant a fixed number of cost errors of known types, recorded in a key that the reviewers do not see. Run your normal checks, human or automated, without telling anyone which pages were changed. Then compare what was flagged with the key.
Three design choices make the result meaningful. Plant errors where they occur, in rendered pages and in every language, not in the data file, because the data was already checked. Plant across all the cost lines, not only the headline totals, since the composition lines are where stale sentences hide. And plant at a realistic density: a handful per hundred versions, so reviewers cannot find them by noticing that something is unusual.
Ten cost errors worth planting in rendered KIDs
| Error to plant | Example | How it arises in practice |
|---|---|---|
| Transposed digits | 1,12% for 1.21% in the ongoing-costs line | Manual post-edit by a linguist |
| Stale composition line | Last year's transaction cost with this year's totals | Translation memory offers the old sentence |
| Wrong decimal separator | 1.21 % in a French version | Locale not applied after editing |
| Thousands separator | 11.520 € shown as 11,520 € in German | Template copied from an English version |
| Rounding | 4.34% instead of 4.3%; €433.70 instead of €434 | Point 78 not applied in a re-render |
| Totals that do not add up | Composition lines summing to €439 against €434 | One line updated, the total not |
| Wrong performance assumption | One-year cost impact on the moderate scenario | Point 71(a) applies 0% to one-year figures |
| Missing warning | No sentence that the seller may charge other costs | Section rebuilt from an old layout |
| Amount and percentage disagree | 1.21% beside €112 | Two fields from two data versions |
| Missing "none" | Performance fee line blank | Optional line dropped instead of stated |
Why spot checks miss KID errors: the arithmetic of sampling
A spot check tells you whether errors exist, not which pages have them. Take the sample reissue: 47 wrong versions out of 4,212. A reviewer who reads 200 versions picked at random will find, on average, about two of them, and has about a one-in-ten chance of finding none at all. Even when the sample does find two, the other 45 are still out there, somewhere in the 4,012 versions nobody opened.
What a random sample of 200 versions finds when 47 of 4,212 are wrong
2.2
wrong versions found on average
10%
chance the sample finds none at all
45
wrong versions still unread when it finds two
0.9%
chance of finding none with a sample of 400
That is why the problem with most KID reviews is not the reviewers. A review that samples has a recall, for individual errors, roughly equal to the share of pages it reads, however careful each reading is. The only way to raise it to near one is to read every number on every page, which is a job for a machine with a person deciding what it finds.
Why recall is the measure that matters for KID costs
A missed error is a published breach; a false alarm is a few minutes of a reviewer's time. The asymmetry is in the law. An investor who relied on an inaccurate KID can claim damages, a regulator can order a KID withdrawn and republished and impose maximum fines of at least €5 million or 3% of turnover on a company (Arts. 11 and 24), and a reissue to correct one share class means every language version again. A cost check should therefore be judged first on recall, and tuned for false alarms second.
False alarms still matter, because a review that cries wolf is ignored. The sample range's procedure sets a numeric tolerance of zero after the market's number format is applied, so any difference is a flag, and hands any flag the agent is less than 90% sure of to a person rather than clearing or raising it automatically. The seeded test is how to see whether those settings are right for your documents.
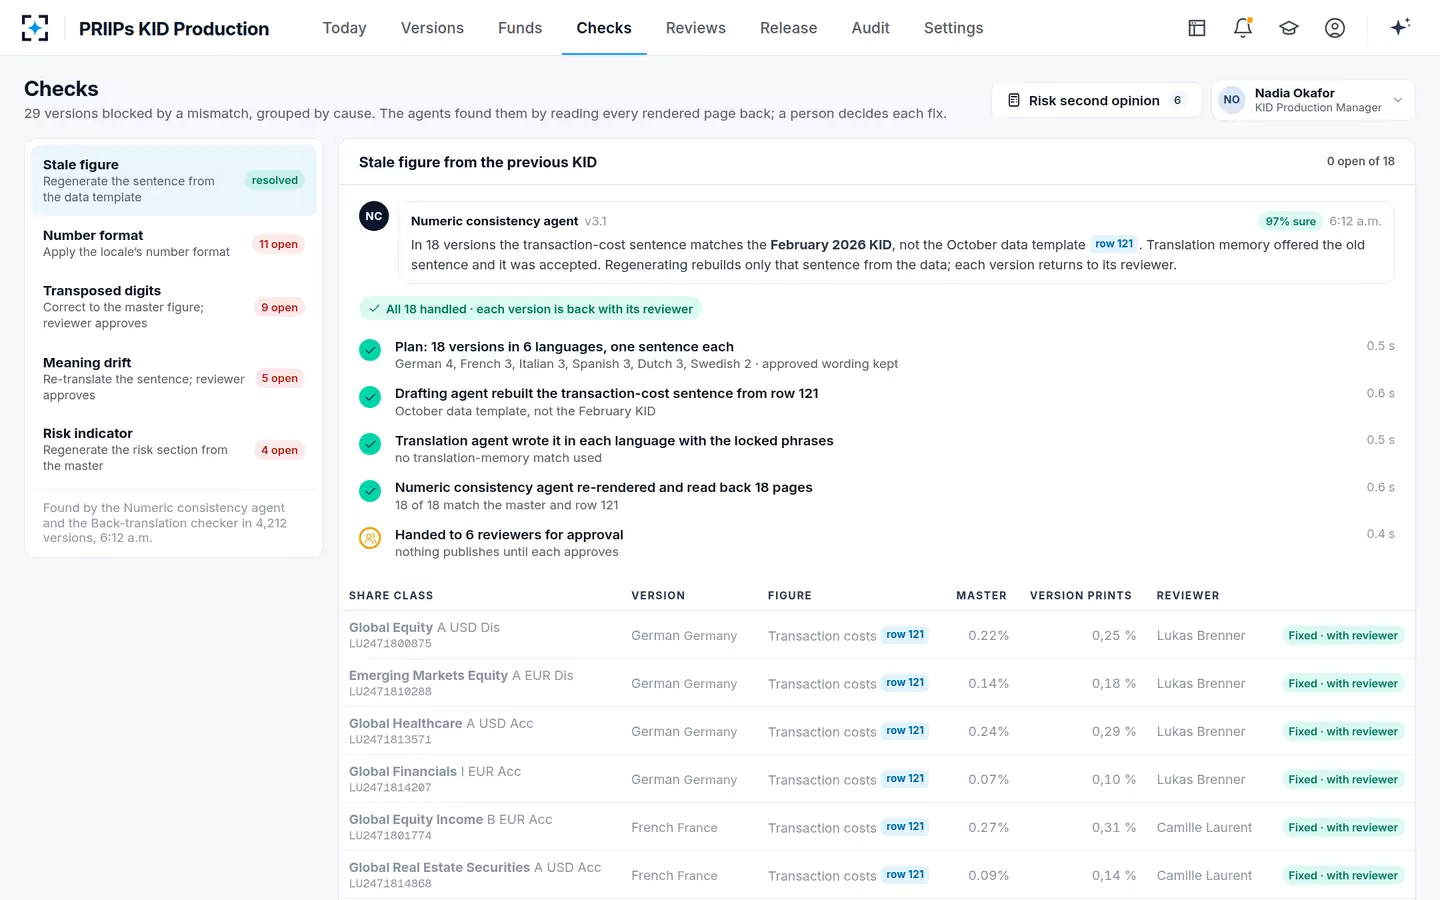
PRIIPs KID Production groups mismatches by cause, so one decision fixes eighteen versions
A cost-disclosure test plan you can run in a week
Running a seeded test on your own KID costs
- Take the last reissue as rendered
The PDFs or HTML investors saw, in every language, not the data file.
- Sample across languages and share classes
At least one version per language, weighted to the languages with vendor post-edits.
- Plant a fixed number of errors from the list
All ten types, a few per hundred versions, recorded in a sealed key.
- Run the review exactly as it runs today
Same people, same time allowed, same tools; nobody told which pages changed.
- Count recall by error type
Caught ÷ planted for each type: stale lines and separators are usually the weakest.
- Count the false alarms
Clean figures flagged, and the reviewer time they took.
- Repeat after any change to the process
A new vendor, template or tool changes recall; measure it again.
How PRIIPs KID Production checks every cost figure in every version
The solution's checks are built for recall. The Numeric consistency agent reads every rendered version, extracts every number, normalises the market's number format and proves each figure against the master and its data row; it runs the release check and cannot clear its own flags. When a reviewer approves a correction, it re-renders the page and reads every number again: in the sample, 62 of 62 on the Polish version, before the share class could be signed. The cost line is also checked for internal consistency, the amount beside each percentage, which is how the agent could tell that the Polish percentage, not the amount, was wrong.
After the correction, every number re-read before the share class can be signed
The design target is that no version is released with a figure that disagrees with its master or the data, and a seeded test on your own reissue is how to measure it; a pilot on your own share classes sets out the rest of the pass marks. Meaning errors in translation need a different test, covered in the guide to measuring AI translation of fund documents, and the calculation behind the transaction cost line in the transaction cost methodology. The whole cycle is on the PRIIPs KID Production page.
Questions people ask
What costs and charges does a PRIIPs KID show?
One-off costs on entry and exit, ongoing costs split into management fees and other administrative or operating costs and portfolio transaction costs, and incidental costs such as performance fees and carried interest. They appear line by line in the "Composition of costs" table and as totals and an annual cost impact in the "Costs over time" table.
How is the annual cost impact calculated?
As a reduction in yield: the annual internal rate of return of the investment without costs minus the return with all costs deducted (Annex VI, point 70). One-year figures assume a 0% net return; longer periods assume the fund performs as its moderate scenario, and where that scenario shows a total loss the ESAs say to use 0%.
Why is the one-year cost figure higher than the longer one?
Because one-off costs are spread over the holding period. In the sample KID, a 3% entry charge makes the first year's annual cost impact 4.3%, while over four years the same charge is shared out and the impact falls to 2.1% a year.
Are the costs in a KID actual or maximum figures?
Both. Ongoing costs are based on the actual costs of the last year, or an estimate for a new or materially changed product, while entry and exit costs, and distribution fees the manufacturer does not know, are shown at their maximum. ESMA has found the actual one-off fees charged by manufacturers to be well below the KID maximums.
Do KID costs include what the distributor charges?
Only the distribution costs the manufacturer knows, or their maximum where it does not. The cost section must start with a warning that the person advising on or selling the product may charge other costs and will inform the investor of them.
How do you test the accuracy of KIDs?
Plant known errors in a copy of the rendered KIDs, run the normal review without telling anyone where they are, and count how many it catches by type. The share caught is the review's recall; for a review that reads only a sample of pages, it can be no better than the share of pages read.