The PRIIPs performance scenarios calculation for an investment fund with enough history is set out in Annex IV of Delegated Regulation (EU) 2017/653, as amended by Delegated Regulation (EU) 2021/2268 and applied since 1 January 2023: take the fund's returns after costs over the last ten years, or over the recommended holding period plus five years if that is longer, cut them into every overlapping window as long as the holding period, and show the worst, the median and the best as the unfavourable, moderate and favourable scenarios, with a stress scenario from a stressed volatility beneath them. The scenarios are recalculated at least monthly, the moderate one also drives the cost figures, and a move of more than five percentage points in it forces a KID review. A deal reached on 18 December 2025 would replace the approach with "forward-looking" scenarios, but it is not yet law. Botminds' PRIIPs KID Production recomputes each share class's scenarios as a second opinion and checks that every language version prints them as calculated.
The worked example is a fictional share class, Quillfield Euro High Yield UCITS, Class A EUR Acc, as it runs through the solution, with a recommended holding period of four years. The rules are quoted from the consolidated Delegated Regulation on EUR-Lex.
Two methods for the same fund: what changed in the PRIIPs performance scenarios calculation in 2023
2018 to 2022: Unfavourable, moderate and favourable scenarios at the 10th, 50th and 90th percentiles of a modelled distribution, plus a stress scenario.
Since 1 January 2023: The worst, median and best real windows of the fund's own past returns after costs, plus a stress scenario.
2018 to 2022: Five years of returns, projected forward with the observed drift.
Since 1 January 2023: Ten years, or the holding period plus five years where that is longer; benchmark or proxy data to fill gaps.
2018 to 2022: Recent strong returns amplified into the future; unfavourable scenarios could show a gain.
Since 1 January 2023: A longer window that includes falls as well as rises, so scenarios move less with the market.
2018 to 2022: Warnings about uncertainty.
Since 1 January 2023: A prominent warning above the table, the period each scenario occurred in, and a monthly record of previous calculations.
2018 to 2022: Replaced.
Since 1 January 2023: In force; the 2025 deal on the retail investment strategy would change it again once adopted.
How are PRIIPs performance scenarios calculated for a fund today?
For a fund with enough history, the scenarios are real past periods, ranked. Annex IV's first case applies where the fund's history of yearly values is longer than ten years and five years longer than its recommended holding period. "Where the recommended holding period is five years or less, the unfavourable, moderate and favourable scenarios shall be calculated over the last 10 years from when the calculation is made" (Annex IV, point 6); for longer holding periods the window is the holding period plus five years.
Inside that window, point 7 identifies every overlapping sub-interval as long as the holding period, starting or ending in each month, computes the fund's performance over each one net of all costs with income reinvested, and ranks them. The moderate scenario is the median; the favourable is the best. The unfavourable is the worst, but ranked against a wider set: it also includes the shorter periods, of at least one year, that end on the calculation date, rescaled to the length of the holding period. On a four-year holding period and a ten-year window, our arithmetic gives 73 four-year windows ending in successive months, and 37 shorter ones ending today, competing for the unfavourable scenario.
That extra set is deliberate. It means a fund in the middle of a fall shows the fall in its unfavourable scenario at once, rather than waiting for the fall to fill a whole holding period. Where the fund's own history is too short, point 12 supplements it with a benchmark that meets the criteria in point 16, and where none exists, with regulated benchmarks for each asset class making up more than 25% of the fund (point 13).
A worked example on a four-year fund: the four scenarios and their returns
Each scenario is shown in money and as an average yearly return. The KID shows what an investor "might get back after costs" from €10,000 at the end of one year and at the end of the recommended holding period, and converts each value to a yearly rate with the formula in point 44: (scenario value ÷ initial investment)^(1/T) − 1. Values are rounded to the nearest €10.
The sample fund's four PRIIPs performance scenarios, at one year and at four
Stress
Exit after 1 year€6,720 · −32.8%
Exit after 4 years€6,950 · −8.7% a year
How it is foundStressed volatility at the 99th percentile for one year, 95th for four (Annex IV, points 18–19); never better than the unfavourable
Unfavourable
Exit after 1 year€8,640 · −13.6%
Exit after 4 years€9,410 · −1.5% a year
How it is foundThe worst four-year window, ranked together with the shorter windows that end today (point 7(e))
Moderate
Exit after 1 year€10,310 · 3.1%
Exit after 4 years€11,520 · 3.6% a year
How it is foundThe median four-year window in the last ten years (point 7(d))
Favourable
Exit after 1 year€11,980 · 19.8%
Exit after 4 years€12,840 · 6.4% a year
How it is foundThe best four-year window in the last ten years (point 7(d))
Two features of the example are worth reading twice. The one-year range is far wider than the four-year range, from −32.8% to +19.8% against −8.7% to +6.4% a year, because short windows are noisier; a reader comparing the two columns learns more about holding period risk than from any sentence in the document. And the moderate scenario, 3.6% a year, is the number the cost tables borrow: the "Costs over time" figures for holding periods beyond one year assume the fund performs as the moderate scenario does (Annex VI, point 71(b)).
Why was the 2017 method replaced? The ESAs' backtest
It was replaced because it did not do what its percentiles claimed. The original method projected five years of returns forward, so scenarios rose after good years and fell after bad ones. The ESAs found that it could "lead to over-optimistic favourable and unfavourable scenarios", that "unfavourable scenarios can frequently show a potential return above 100%, suggesting that the capital is guaranteed", and that "Due to procyclicality and lag effects, unfavourable scenarios are at their highest level when markets are at their lowest level" (ESAs, final report on the draft amending standards, JC 2020 66).
How often actual five-year returns fell outside the scenarios: under the old method, about twice as often as it predicted
The amending act states the objective in one line: scenarios "should not provide an overly positive outlook for potential future returns", and the method should rest on "a longer period of observed returns, capturing both periods of positive and negative growth, thus providing more stable performance scenarios over time and minimising pro-cyclical outcomes" (Delegated Regulation 2021/2268, recital 2). The backtest shows why the longer window matters: under the proposed approach the misses fell to roughly the 10% the scenarios imply.
PRIIPs stress scenario calculation, with an example
The stress scenario is the only one built from a formula rather than a ranked window. Point 18 measures the fund's volatility over rolling sub-intervals of a fixed length, takes the 99th percentile of those volatilities for a one-year holding period and the 95th for longer ones, and uses that stressed volatility in the same Cornish-Fisher expansion that drives the risk indicator, at the extreme 1% or 5% point of the distribution (point 19). One rule overrides the arithmetic: "The stress scenario value shown shall not be better than the value of the unfavourable scenario" (point 20).
The rolling window used to measure stressed volatility
| Price frequency | One-year holding period | Longer holding periods | Percentile of volatility used |
|---|---|---|---|
| Daily | 21 observations | 63 observations | 99th for one year, 95th otherwise |
| Weekly | 8 observations | 16 observations | 99th for one year, 95th otherwise |
| Monthly | 6 observations | 12 observations | 99th for one year, 95th otherwise |
In the sample, the stress scenario for the four-year exit is €6,950, an average of −8.7% a year, below the unfavourable €9,410 as point 20 requires. A daily-priced fund measures its volatility over every 63-day stretch of the ten-year history, so a single violent quarter, such as March 2020 in most equity funds, can set the stress scenario for years after it.
Benchmarks and proxies: scenarios for a share class too young to have ten years
A young fund borrows history, and the borrowing must be justified. Where a benchmark is used, it must be appropriate under a list of criteria in point 16, from risk-return profile and asset allocation to geographical and sector exposure, duration, credit rating and volatility, and "PRIIP manufacturers shall be able to demonstrate the consistency of the benchmarks with the objectives of the PRIIP and shall document their decision, including a clear justification of the benchmark used" (point 17). Since 2023, Article 15(2)(d) also makes the benchmark's continued consistency with the product's objectives one of the tests at every KID review.
The choice shows up in the document. Element E of the prescribed narratives says, for each of the three ranked scenarios, between which years "This type of scenario occurred for an investment", naming the benchmark where one was used (Annex V). An investor can therefore see whether the moderate scenario comes from the fund or from an index.
Scenarios and costs run on one engine: three consequences
The scenarios are not a stand-alone section; three other parts of the KID depend on them. First, the "Costs over time" table uses the moderate scenario's performance for every holding period beyond one year, and if the moderate scenario shows a total loss, the ESAs direct that a 0% net performance be assumed instead (PRIIPs KID Q&A, JC 2023 22). Second, Article 15(2)(c) requires a review whenever the moderate scenario's mean return, as an annual percentage, "has changed by more than five percentage points". Third, open-ended funds must publish their "previous performance scenario calculations" every month and say in the KID where to find them (Art. 8(3)).
The practical result is that the scenarios are a monthly calculation with a published audit trail, and a KID team needs to compare each month's figures with the ones printed in the live KID, not only produce new ones.
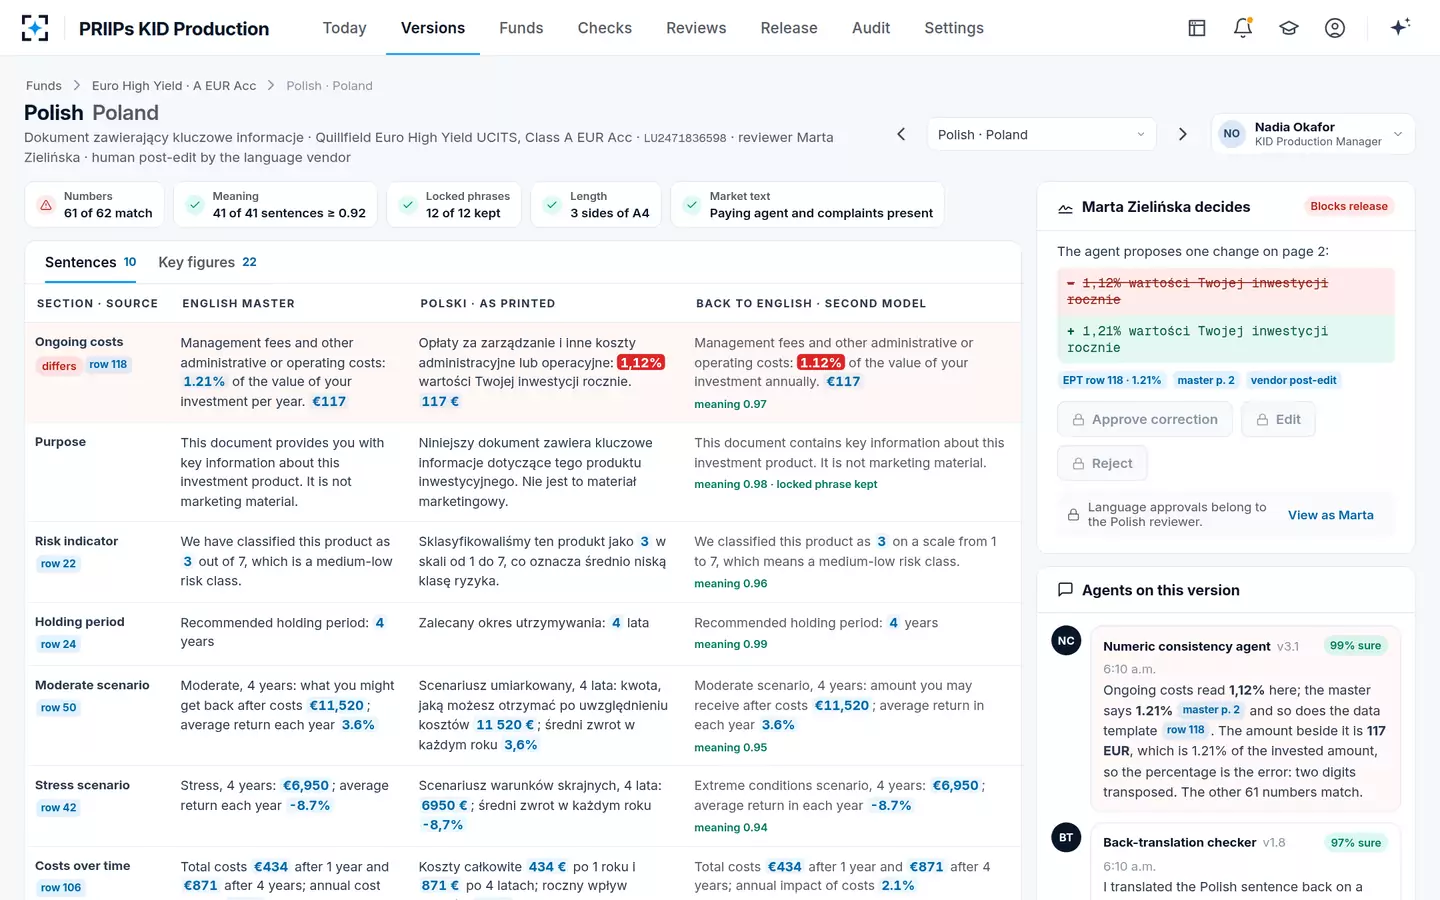
PRIIPs KID Production checks the scenarios as printed in Polish against the master
The UK dropped performance scenarios in 2022
The UK took the opposite route. When it amended its retained version of the PRIIPs rules, the FCA removed the requirement to show performance scenarios, from the end of 2022, and replaced it with a narrative description of what drives performance. Its reason was blunt: "On balance, for most products, we assess that performance scenarios result in misleading information being displayed" (FCA PS22/2). The FCA's new product summary for consumer composite investments shows ten years of past performance instead, as the CCI product summary guide explains.
The EU evidence is mixed. The ESAs' consumer testing, run before the 2023 changes, found that participants "generally made good investment decisions irrespective of the version of the performance scenario table" shown to them (JC 2020 66). ESMA's 2026 market report found, for structured retail products, "limited differentiation between moderate and favourable scenarios": on the median product, a five-year €10,000 investment was shown returning about €13,194 in the moderate scenario and €13,765 in the favourable one (ESMA, Costs and Performance of EU Retail Investment Products, 2025 report).
What would the 2025 deal on the retail investment strategy change?
It would move the KID to forward-looking scenarios, but the text is not yet adopted. The European Parliament summarised the provisional agreement of 18 December 2025 in one sentence on scenarios: "The KID would provide meaningful, forward-looking performance scenarios based on realistic data and plausible assumptions" (European Parliament, 18 December 2025). The Council describes the PRIIPs amendments as "targeted changes to adapt the PRIIPs Key Information Documents (KIDs) to the digital environment and to the evolving needs of retail investors" (Council, 2 October 2026).
Where the PRIIPs amendments stand on 28 October 2026
- Commission proposalMay 2023
- Provisional agreement18 Dec 2025
- Council COREPER5 Jun 2026
- Parliament ECON23 Jun 2026
- Plenary vote, indicative11 Nov 2026
- Council adoption, expectedQ4 2026
- Official Journal, expectedby Jan 2027
- Standards, application dateto follow
Until the amending regulation is published in the Official Journal and its own technical standards are written, Annex IV as amended in 2021 is the method every EU KID must follow. A team preparing for the change should keep its scenario engine able to run the current method, report the difference against any proposed method, and change only when the law does.
Running the current method in PRIIPs KID Production, and being ready for the next
The safe operating model is a monthly calculation, a comparison with the live KID and a person who decides. PRIIPs KID Production's Risk and scenario agent recomputes each share class's scenarios and costs over time from NAV history as a second opinion and runs the Article 15(2) tests; the sample range sets the moderate scenario check at five points, the regulatory trigger. Any disagreement with the calculation provider goes to product governance with the working, and the agent never overrides the provider's figure. Its Numeric consistency agent then proves that every language version prints the scenarios the calculation produced.
The same NAV history feeds the summary risk indicator calculation, so the two checks share their data. PRIIPs KID Production shows both inside a full reissue.
Questions people ask
What is the moderate scenario in a PRIIPs KID?
For a fund with enough history, it is the median result among all the windows of past returns as long as the recommended holding period over the last ten years, after costs. It also sets the performance assumed in the cost tables beyond the first year, and a move of more than five percentage points in it forces a KID review.
Why can an unfavourable scenario still show a gain?
Because it is the worst real window in the period, and if the fund rose over every window of that length in the last ten years, the worst one still rose. The 2023 method reduces the effect by also ranking shorter recent periods, and by using a longer window that includes falls; under the 2017 method the ESAs found unfavourable scenarios frequently showing gains.
How often must performance scenarios be recalculated?
At least monthly (Annex IV, point 11). Open-ended funds must also publish their previous scenario calculations monthly and say in the KID where they are, and the KID must be reviewed if the moderate scenario's mean return moves by more than five percentage points.
Can a manufacturer show more cautious scenarios than the method gives?
For products whose scenarios come from a simulated distribution, such as structured products, point 24 of Annex IV allows lower percentiles where the standard ones could give inappropriate expectations. For funds using the ranked windows, there is no such discretion: the method decides the figures.
Is the EU retail investment strategy in force in 2026?
No. On 28 October 2026 the PRIIPs amendments had been agreed politically and approved by the Council's COREPER and the Parliament's ECON committee, but not voted in plenary, adopted by the Council or published in the Official Journal. The current KID rules apply until the new ones are published and their application date arrives.
Are PRIIPs performance scenarios a forecast?
No. The prescribed narrative says that what an investor gets depends on future market performance, which is uncertain and cannot be accurately predicted, and since 2023 the warning must appear prominently above the table. The 2021 amendments added these warnings precisely so that scenarios would not be read as best-estimate forecasts.