Summary risk indicator calculation follows Annex II of Delegated Regulation (EU) 2017/653, as amended in 2021: the manufacturer computes a market risk class from 1 to 7, using the fund's VaR-equivalent volatility, assesses a credit risk class from 1 to 6, and reads the summary risk indicator (SRI) off a table that combines the two. For a typical UCITS the market risk class comes from five years of daily price returns, a Cornish-Fisher value-at-risk at 97.5% over the recommended holding period, and a volatility band: 0.5% up to 5% is class 2, 5% up to 12% class 3, 12% up to 20% class 4. The calculation is simple to state and easy to get subtly wrong, with gaps in the price history, monthly data or a credit exposure missed, and a class change reissues every language version of the share class. Botminds' PRIIPs KID Production recomputes the indicator for every share class from NAV history as a second opinion, and a person decides every disagreement.
The worked examples use a fictional sample range, Quillfield Global Funds SICAV, as it runs through the solution, alongside the European Supervisory Authorities' own published example. The method is quoted from the consolidated Delegated Regulation on EUR-Lex.
How the summary risk indicator is read: market risk class across, credit risk class down
Euro High Yield, Class A EUR Acc: VEV 7.9%, MR3, SRI 3
Emerging Markets Local Debt, Class A EUR Acc: VEV 12.3% recomputed, MR4, SRI 4
How is the summary risk indicator calculated? Market risk, credit risk, one table
The SRI is a lookup, not a formula. Article 3 of the Delegated Regulation requires "the level of risk of the PRIIP in the form of a risk class by using a summary risk indicator having a numerical scale from 1 to 7" (Art. 3(2)(a)), and Annex II builds it in three parts: a market risk measure (MRM), a credit risk measure (CRM) and their aggregation. Point 52 then assigns the SRI "according to the combination of the CRM and the MRM classes". For most funds, credit risk does not move the score, so the work is in the market risk class.
"Market risk is measured by the annualised volatility corresponding to the value-at-risk (VaR) at a confidence level of 97,5 % over the recommended holding period, unless stated otherwise."
Delegated Regulation (EU) 2017/653, Annex II, point 1
The phrase "the annualised volatility corresponding to the value-at-risk" is the key to the whole method. A fund's VaR is computed first, as the return it would fall to at the 97.5% confidence level over the holding period. That VaR is then converted back into the volatility a normal distribution would need to produce it, the VaR-equivalent volatility (VEV), and the VEV is what sits in the class bands. Skew and fat tails therefore raise the class even when the plain standard deviation would not.
Which PRIIP category is the fund? The category decides the method
Annex II divides products into four categories, and only one of them uses the calculation most fund teams know. Category 1 covers products where investors could lose more than they invested, most derivatives, and products priced less often than monthly; it is class 7, or class 6 for the infrequently priced. Category 2 covers products with non-leveraged, or constant-multiple, exposure to their underlying prices, which is where almost every UCITS sits. Category 3 covers non-linear products such as structured funds, simulated with at least 10,000 bootstrapped paths. Category 4 covers products whose value depends partly on factors not observed in markets, such as with-profits insurance.
Category 2 has a data condition. It applies "where at least 2 years of historical daily prices, or 4 years of historical weekly prices, or 5 years of monthly prices are available for the PRIIP", or for an appropriate benchmark or proxy that meets the same test (Annex II, point 5). A new share class can lean on an older one: the ESAs answer that "it is expected to be appropriate to use the price history of an existing share class", adjusted for differences such as costs (PRIIPs KID Q&A, JC 2023 22). Where daily prices cover less than five years, a benchmark or proxy may fill the gap so that five years are used.
From NAV history to VaR: the Cornish-Fisher step, line by line
The VaR comes from the moments of five years of returns. Point 9 requires "the moments of the observed distribution of returns of the PRIIP's or its benchmark or proxy's price during the past 5 years", at the highest frequency available: daily where the fund prices daily. Each return is the natural logarithm of one closing price over the previous one (point 11). From those returns come the mean, volatility, skew and excess kurtosis, and point 12 feeds them into the Cornish-Fisher expansion.
The market risk calculation for a Category 2 fund, in four steps
Returns
rᵢ = ln(Pᵢ ÷ Pᵢ₋₁)
Daily log returns over the past five years: about 1,300 observations for a daily-priced fund.
NAV history from fund accounting
Moments
σ, μ₁ = M₃ ÷ σ³, μ₂ = M₄ ÷ σ⁴ − 3
Volatility, skew and excess kurtosis of those returns (point 12).
Calculation provider
VaR in return space
σ√N × (−1.96 + 0.474 μ₁ ÷ √N − 0.0687 μ₂ ÷ N + 0.146 μ₁² ÷ N) − 0.5 σ² N
N is the number of trading periods in the recommended holding period.
Calculation provider
VaR-equivalent volatility
VEV = (√(3.842 − 2 × VaR) − 1.96) ÷ √T
T is the recommended holding period in years (point 13); the VEV sets the market risk class.
Checked by product governance
The ESAs' flow diagram includes a worked example, and it shows a property of the method that surprises people. Using five years of daily Euro Stoxx 50 prices to May 2017, 1,280 observations with an annualised volatility of 19.59%, the VEV comes out at 19.69% for a one-year holding period, 19.63% for five years and 19.60% for fifty (JC 2017 49). For a Category 2 fund, the holding period barely moves the class. What moves it is the price history: its volatility, its skew and its fat tails.
What is VaR-equivalent volatility, and where are the class lines?
VaR-equivalent volatility is the annual volatility of a normal distribution that would produce the fund's VaR over the holding period, and seven bands turn it into the market risk class. The 2021 amendments rewrote the table with explicit inequalities, so a VEV of exactly 12% now falls unambiguously into class 4.
The market risk classes in Annex II, as amended
| Market risk class | VaR-equivalent volatility | Typical of |
|---|---|---|
| 1 | below 0.5% | Money market and very short bond funds |
| 2 | 0.5% up to 5.0% | Short-dated and high-grade bond funds |
| 3 | 5.0% up to 12% | Most bond funds, cautious multi-asset funds |
| 4 | 12% up to 20% | Diversified equity in calm years, riskier bond funds |
| 5 | 20% up to 30% | Equity funds over volatile five-year windows |
| 6 | 30% up to 80% | Concentrated, sector or single-country equity |
| 7 | 80% and above | Leveraged products; Category 1 products by default |
A worked example: two sample funds either side of the 12% line
The 12% line between classes 3 and 4 is where most bond-fund arguments happen. In the sample range, the calculation provider supplied a VEV of 11.8% for Emerging Markets Local Debt, Class A EUR Acc: class 3. The solution's recomputation, from 1,304 daily returns between October 2021 and October 2026, found a VaR in return space of −0.512 over the four-year holding period. Put through point 13, that is (√(3.842 + 1.024) − 1.96) ÷ √4 = (2.206 − 1.96) ÷ 2 = 12.3%: class 4.
The difference had a cause. The provider had used weekly returns for January 2022, when nine daily NAVs were missing because of a local holiday calendar; the fund accounting system held the daily prices. Point 9 says that "Where prices are available on a daily basis, the frequency shall be daily", and with daily returns the fund crossed the line. Accepting class 4 would reissue 41 language versions across the fund's two share classes, so the decision went to product governance with the working, not to whichever number arrived last.
Six sample share classes, supplied and recomputed: only one crosses a class line
When does credit risk change the summary risk indicator?
Credit risk changes the score only from credit risk class 3 down, and for most UCITS it is assessed on what the fund holds, not on the fund. Point 34 states that a UCITS or AIF "itself shall be taken to entail no credit risk, whereas the underlying investments or exposures of the UCITS or AIF shall be assessed where necessary" (Annex II). Point 35 requires each underlying exposure of 10% or more of the fund's assets to be assessed separately, and point 36 removes exchange-traded and cleared derivatives, fully collateralised exposures and small uncollateralised ones from the count.
The table then decides how much it matters. With a credit risk class of 1 or 2, the SRI equals the market risk class. Class 3 lifts market risk classes 1 and 2 to an SRI of 3; classes 4 and 5 put the SRI at 5 unless market risk is higher; class 6 puts it at 6. The case to watch is a concentrated bond fund: a local-currency debt fund with more than 10% in one sovereign has an exposure that must be assessed on its own, from the rating policy the manufacturer has fixed in advance (points 37 to 43). The credit assessment is a data dependency of the SRI that market-risk tooling does not see.
Monthly prices, flexible funds and the upward override
Three adjustments can move the class without any change in the data. A fund priced only monthly has its market risk class "increased by one additional class" (Annex II, point 15). A flexible multi-asset fund must use the highest of its own VEV, the VEV of its reference asset allocation and the VEV consistent with its risk limit, and only the last two where its investment policy changed during the period (point 14). And since 2023 the manufacturer may raise the score: where it "considers that the summary risk indicator number assigned following the aggregation of market and credit risk in accordance with point 52 does not adequately reflect the risks of the PRIIP, that PRIIP manufacturer may decide to increase that number", and must document the decision (point 52a).
The override works one way only. The ESAs introduced it, they explained, "to allow the SRI to be increased and performance scenarios to be lowered if deemed necessary", and they added that such discretion "should only be used in specified cases rather than providing general discretion to PRIIP manufacturers to adjust the KID template" (ESAs, advice on the PRIIPs Regulation, JC 2022 20). There is no route to a lower class than the calculation gives.
How often is the SRI recalculated? The four-month majority rule
The SRI is monitored continuously but changes only when a new class holds. Point 53 requires the manufacturer to monitor the market data and, if the market risk class changes, to attribute "the MRM class which the PRIIP has matched for the majority of the reference points over the preceding four months". Credit risk is re-attributed as soon as the criteria change (point 54), and any decision on investment policy triggers a fresh determination (point 55). Article 15(2)(b) of the Delegated Regulation then makes a change of class one of the things every KID review must test.
The rule exists to stop a fund on a class boundary from flickering between two scores every month. It also means a team needs the history of its own monthly recalculations, not only the latest figure: a fund that sat at 12.3% for three of the last four months has changed class even if this month's figure is 11.9%.
The SRI second opinion in PRIIPs KID Production: supplied, recomputed, and a person decides
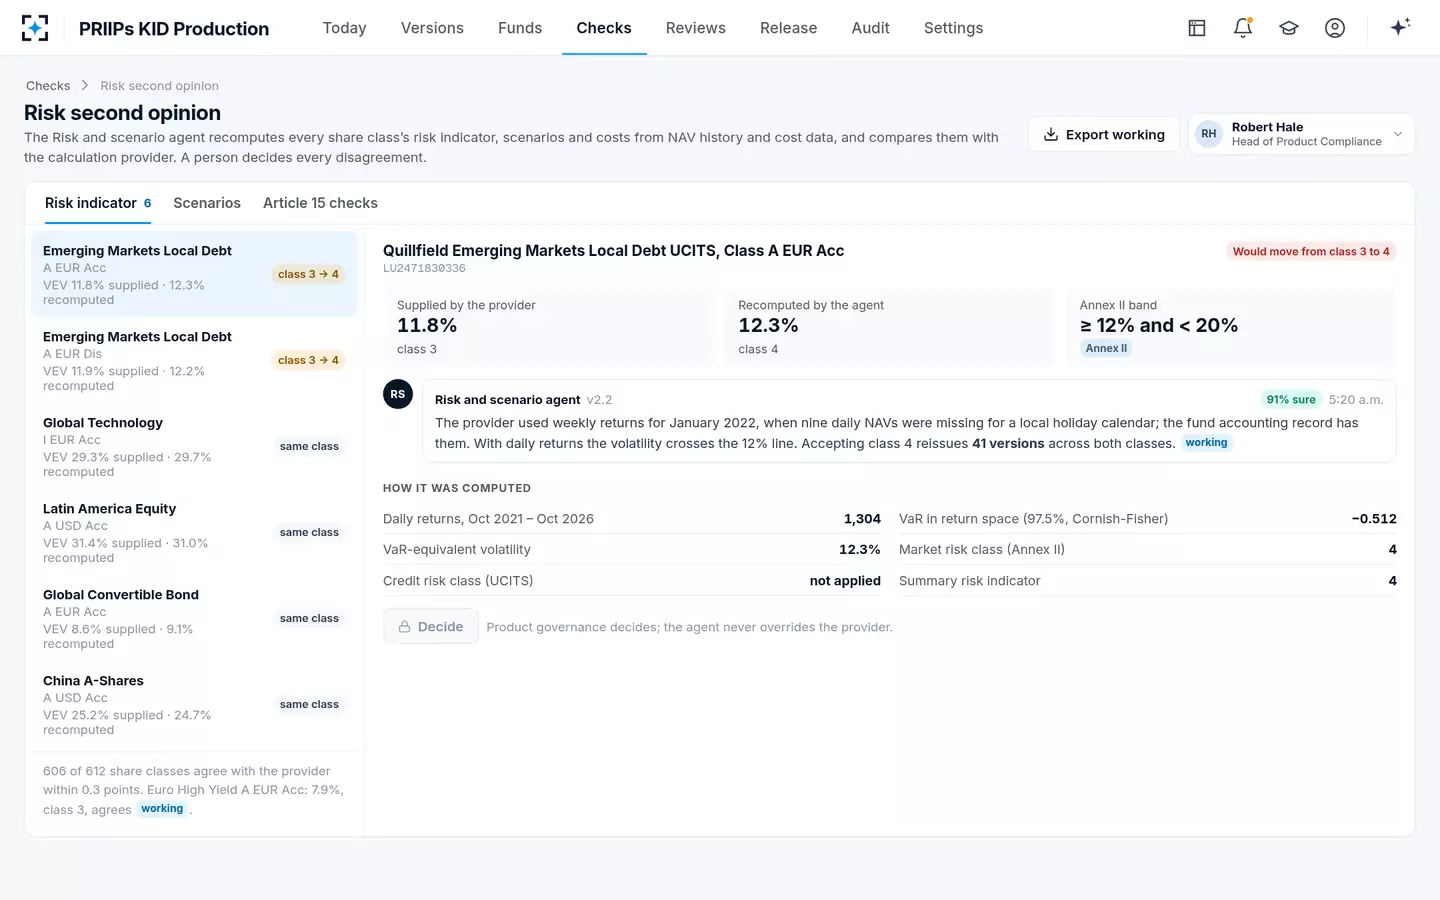
Recomputing the SRI as a second opinion in PRIIPs KID Production
A second calculation is only useful if it can disagree for a reason. The checks below are the ones that catch the causes seen most often: the wrong frequency, a gap filled badly, a share class mapped to the wrong history, a credit exposure missed and a month-on-month change applied without the four-month rule.
Before you sign a summary risk indicator
- Recompute from daily NAVs where they exist
Point 9 requires the highest available frequency; weekly substitutes for missing days change the VEV.
- Check the history behind a new share class
Another class of the same fund may be used, adjusted for its costs; a benchmark only where it is appropriate and documented.
- List every exposure of 10% or more
Each must be credit-assessed separately; a sovereign concentration can lift the score.
- Apply the monthly-data and flexible-fund rules
One extra class for monthly prices; the highest of three VEVs for flexible funds.
- Keep four months of recalculations
A class changes only when the new class holds for most reference points over four months.
- Document any upward override and its reason
Point 52a allows an increase, never a decrease, and the decision must be documented.
The same NAV history feeds the scenarios, so a recomputation of one is half a recomputation of the other; how the four performance scenarios are calculated follows the same data. In the UK the score is built differently, on a scale of 1 to 10 from ten years of volatility, as the CCI product summary guide explains. PRIIPs KID Production shows the second opinion in the context of a full reissue.
Questions people ask
What does a summary risk indicator of 5 out of 7 mean?
It is the medium-high risk class in the prescribed wording of Annex III. For most funds with no significant credit risk, it means a VaR-equivalent volatility of at least 20% and below 30% over the last five years. The narrative beside it must say that the indicator compares the product's risk with other products and how likely it is to lose money.
How many years of data does the SRI calculation need?
Five years where they exist, at daily frequency if the fund prices daily. The minimum for the Category 2 method is two years of daily prices, four of weekly or five of monthly, and an appropriate benchmark or proxy may supplement a shorter history up to five years.
Can a manufacturer lower the summary risk indicator?
No. Since 2023 point 52a of Annex II lets a manufacturer increase the SRI if the calculated number understates the product's risks, with the decision documented. There is no corresponding power to reduce it.
Does a longer recommended holding period lower the risk class?
Barely, for a Category 2 fund. In the ESAs' published example on five years of Euro Stoxx 50 prices, the VEV moves only from 19.69% at one year to 19.60% at fifty, because the formula annualises the VaR. The holding period matters much more for structured products and for the performance scenarios.
How is the UK risk and return score different from the SRI?
The UK product summary uses a 1–10 risk and return score based on the standard deviation of ten years of returns, with its own bands, rather than a VaR over five years on a 1–7 scale. The same fund can therefore show 3 of 7 in its EU KID and 4 of 10 in its UK summary, as one sample share class does.
Do UCITS have to assess credit risk for the SRI?
Not for the fund itself, which Annex II treats as having no credit risk, but for its underlying investments where necessary: every exposure of 10% or more is assessed separately, using external ratings under a policy fixed in advance. Exchange-traded and cleared derivatives and fully collateralised exposures are treated as carrying none.