Before any ETF fee cuts, a sponsor's management fees comparison asks where a fund's fee sits against ETFs that do the same thing, and it is worth doing on the total annual operating expenses, not the management fee line, because what the line contains differs from fund to fund. It becomes a pricing decision only when each basis point has a price. One basis point is 0.01% of assets a year, so its value is the fund's average assets times 0.0001: $142,000 a year on a $1.42 billion ETF, and $1 million on a $10 billion one. With that number in hand, a pricing committee can weigh a cut that moves the fund two places up a peer ranking against what it gives up, and against what the comparison itself costs to produce. Botminds' Fee Benchmarking, which answers peer fee questions for fund product and board teams, shows the cited peer ladder and the fee scenarios together, with the scenarios restricted to the people who set the fee.
The fee line is not the whole fee: what sits inside the total
Sample ETF, 0.79% unitary fee
- Management fee, the whole total · 100%
Total costs of investing in UCITS (ESMA)
- Distribution · 48%
- Product and other costs · 52%
UCITS ongoing costs under an inducement agreement, at most (ESMA)
- Passed to the distributor, at most · 45%
- Running the fund, at least · 55%
ETF management fee vs expense ratio: which should you compare?
Compare the expense ratio, meaning the fee table's total annual fund operating expenses, net and gross. The management fee is one line of it, and its contents vary. In a US fee table, management fees "include investment advisory fees (including any fees based on the Fund’s performance), any other management fees payable to the investment adviser or its affiliates, and administrative fees payable to the investment adviser or its affiliates that are not included as 'Other Expenses'" (Form N-1A, Item 3, Instruction 3(a)). A fund that pays its administrator separately shows a lower management fee and higher other expenses than a fund whose adviser bundles both, for the same total.
Two more lines change the total. Distribution and service fees under a 12b-1 plan sit on a line of their own, and they differ most between share classes of the same mutual fund. Acquired fund fees and expenses appear when an ETF holds other funds. A comparison of management fee lines alone can rank a fund of funds as cheap and a bundled-fee ETF as expensive when the totals say the opposite. Net expense ratio vs gross expense ratio walks through the full table.
How much is one basis point worth on a fund?
One basis point of fee is worth the fund's average net assets times 0.0001 each year, to the adviser in revenue and to investors in cost. The arithmetic is trivial, and it is still the most useful number in a pricing discussion, because it turns a peer ranking into money.
One basis point a year, at four fund sizes
1 bp a year = average net assets × 0.0001
$100 million$10,000
$500 million$50,000
$1.42 billion (the sample fund)$142,000
$10 billion$1,000,000
The same arithmetic applies on the investor's side, which is why investor tools focus on it. The prospectus cost example turns the expense ratio into dollars on a $10,000 investment over 1, 3, 5 and 10 years, and FINRA's Fund Analyzer projects the same effect over a chosen holding period. For the fee-setter, the number that matters is the fund-level one in the table above, and how many basis points separate the fund from its peers.
What a unitary fee shows, and what it hides
A unitary fee bundles the adviser's fee and most of the fund's operating costs into one percentage, which the adviser collects and from which it pays the fund's service providers. It makes the fee table simple, a management fee line close to the total and other expenses near zero, and it makes ETF comparisons easier on the total. It also hides the split. Two ETFs at 0.79% can be very different businesses: one with a large share of the fee spent on index licensing, custody and administration, another keeping most of it as advisory revenue.
That matters most where regulators ask whether the fee is justified rather than merely competitive. A UK manager's assessment of value must weigh, for each charge, "the cost of providing the service to which the charge relates", and a US board considers the adviser's costs and profits each year. A peer comparison of unitary fees answers the market question well and the cost question not at all. The structure of a UK assessment is set out in the FCA assessment of value rules.
Pricing a cut: a worked example
Here is a sample from Botminds' Fee Benchmarking (the funds and firms are fictional): Quillfield Global Small Cap Active ETF, $1.42 billion, at a 0.79% unitary fee. A competitor has just cut its fee from 0.89% to 0.82%. The approved peer position puts the fund 5th lowest of 15, 6 basis points below a peer median of 0.85%, and 8 below once two peers' waivers end in April 2027. The Pricing Committee's restricted scenarios price two cuts.
What two fee cuts would cost the sample ETF a year, and what they buy
Asset growth can pay for a cut, and the break-even is easy to compute. At 0.79% the fund earns about $11.2 million a year; to earn the same at 0.75%, assets must reach about $1.50 billion, roughly $76 million or 5.3% more, from the cut alone. A cut to 0.69% needs about $206 million, 14.5% more. These are our arithmetic on sample figures, and they ignore that peers may respond. The committee in the sample chose to hold, which a peer position 6 basis points below the median made easy to defend.
Why the launch price is the one that sticks
The evidence from Europe is that fees fall mostly when new funds arrive, not when existing funds cut. ESMA's March 2026 report found ongoing costs of retail equity UCITS down 8% between 2020 and 2024, but only 2.6% for share classes present throughout; for bond funds the figures were almost 15% and 9%. Share classes new in 2024 were around 5 basis points cheaper on average than those present for five years or more (ESMA, March 2026). ETF costs fell faster still: by 13% for equity and 17% for bond ETFs over the same period.
For a product team this argues for spending most of the pricing effort before launch. A fund priced in line with today's peers will drift above the median as cheaper funds launch around it, and cutting later costs revenue on every dollar already in the fund. The peer set at launch should therefore include the newest competitors, which a vendor category often has not classified yet.
European fee trends, in ESMA's figures
−13%
ongoing costs of equity ETFs, 2020 to 2024
ESMA, March 2026
−17%
ongoing costs of bond ETFs, 2020 to 2024
ESMA, March 2026
~5 bp
cheaper on average: share classes new in 2024 against five-year incumbents
ESMA, March 2026
~20%
cheaper on average: the largest quarter of funds against the smallest
ESMA 2022 statistics, cited in its CSA report
What scale does to fees, and to the comparison
Larger funds are cheaper, but the saving shows up in some lines more than others. Studying 46,580 fund classes in 18 countries, Khorana, Servaes and Tufano found that "larger funds and fund complexes charge lower fees" (Review of Financial Studies, 2009). Gao and Livingston, splitting US equity fund expense ratios into their parts, found that "Most of the observed decline in total expense ratios comes from the small fees paid to outside service providers" and that the largest component, advisory fees, "is essentially constant for larger funds" (Financial Markets, Institutions & Instruments, 2008).
Two consequences for a comparison follow. A small new fund will look expensive against large incumbents for reasons of scale, so a peer set should record assets as well as fees. And because advisory fees do not fall with size on their own, sharing scale with investors usually takes a decision, such as breakpoints in the fee schedule, which Botminds' guide to advisory fee breakpoints covers. ESMA's 2021 supervisory action reported one supervisor finding that managers with lower net profits tended to charge higher fees, while those benefiting from scale tended to pass it on (ESMA, May 2022).
Average expense ratio for active ETFs: where active ETF fees sit
No US regulator publishes an average expense ratio for active ETFs, or for any fund category, so the useful benchmark is a peer group built for your fund. Europe has an official data point on the ordering: ESMA reports that "Active ETFs report slightly higher costs than passive ETFs but lower costs than active funds" (ESMA, March 2026). An active ETF is therefore priced against two reference points at once, the index ETFs investors could buy instead and the active mutual funds in the same strategy, and a peer set that includes only one of them answers half the question.
The sample shows why the blend needs rules. Its peer group for an active global small-cap ETF admits ETFs and the no-load mutual fund classes that carry no 12b-1 fee, requires an active share of at least 60%, and so excludes a fund labelled active whose active share was 18%: at 0.39% it was the cheapest fund in the first build and had pulled the median down. Fund peer group analysis shows how much that one decision moved.
What the comparison itself costs
The comparison is cheap next to a basis point, and expensive next to how often it is needed. Botminds' own estimate for one 14-peer answer built by hand is about five and a half working days, roughly 44 hours. At the median pay of financial analysts, $49.79 an hour in 2025 (Bureau of Labor Statistics), that is about $2,200 in wages before benefits, roughly what one basis point on the sample fund earns in a week. The cost is not the hours of one answer; it is that a hand-built answer is redone every time a competitor files a fee cut, and in the meantime the committee works from an old one.
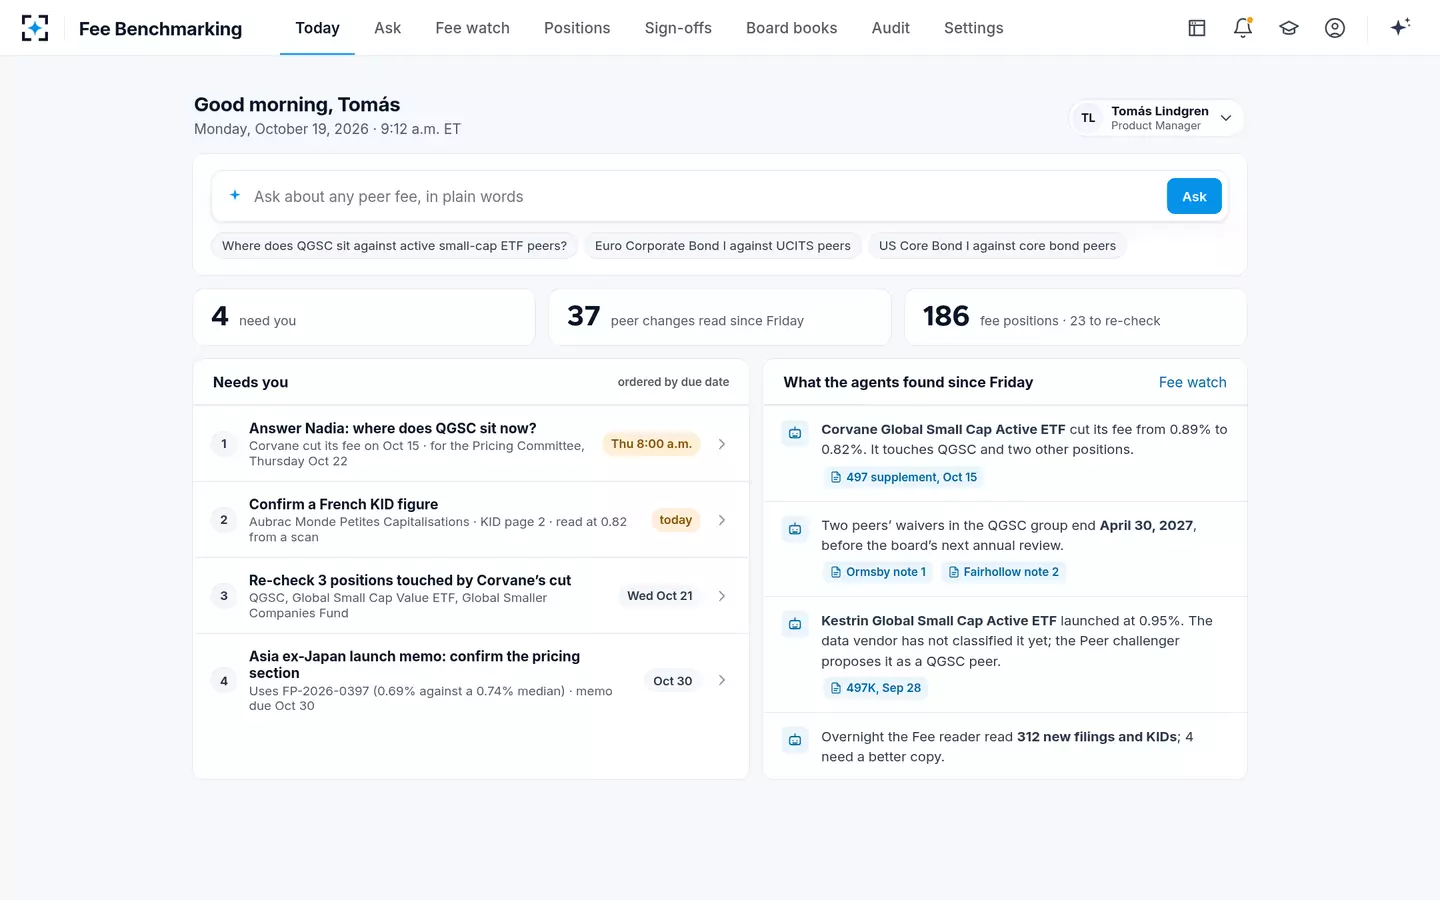
A pricing question waiting for the product manager, with the peer change that caused it
What a pricing committee paper on an ETF fee should show
A pricing committee paper on an ETF fee should fit on a page and answer five things. Where the fund sits: rank and distance from the peer median in basis points, on a stated measure, with the date. What a basis point is worth at current assets, and what each option costs or earns a year. What is about to change without anyone deciding: peers' waivers ending, fee cuts filed in supplements, launches not yet in the vendor's category. How the peer set was built, with the closest calls and what the median would be if they went the other way. And the recommendation, with the reason the committee can record.
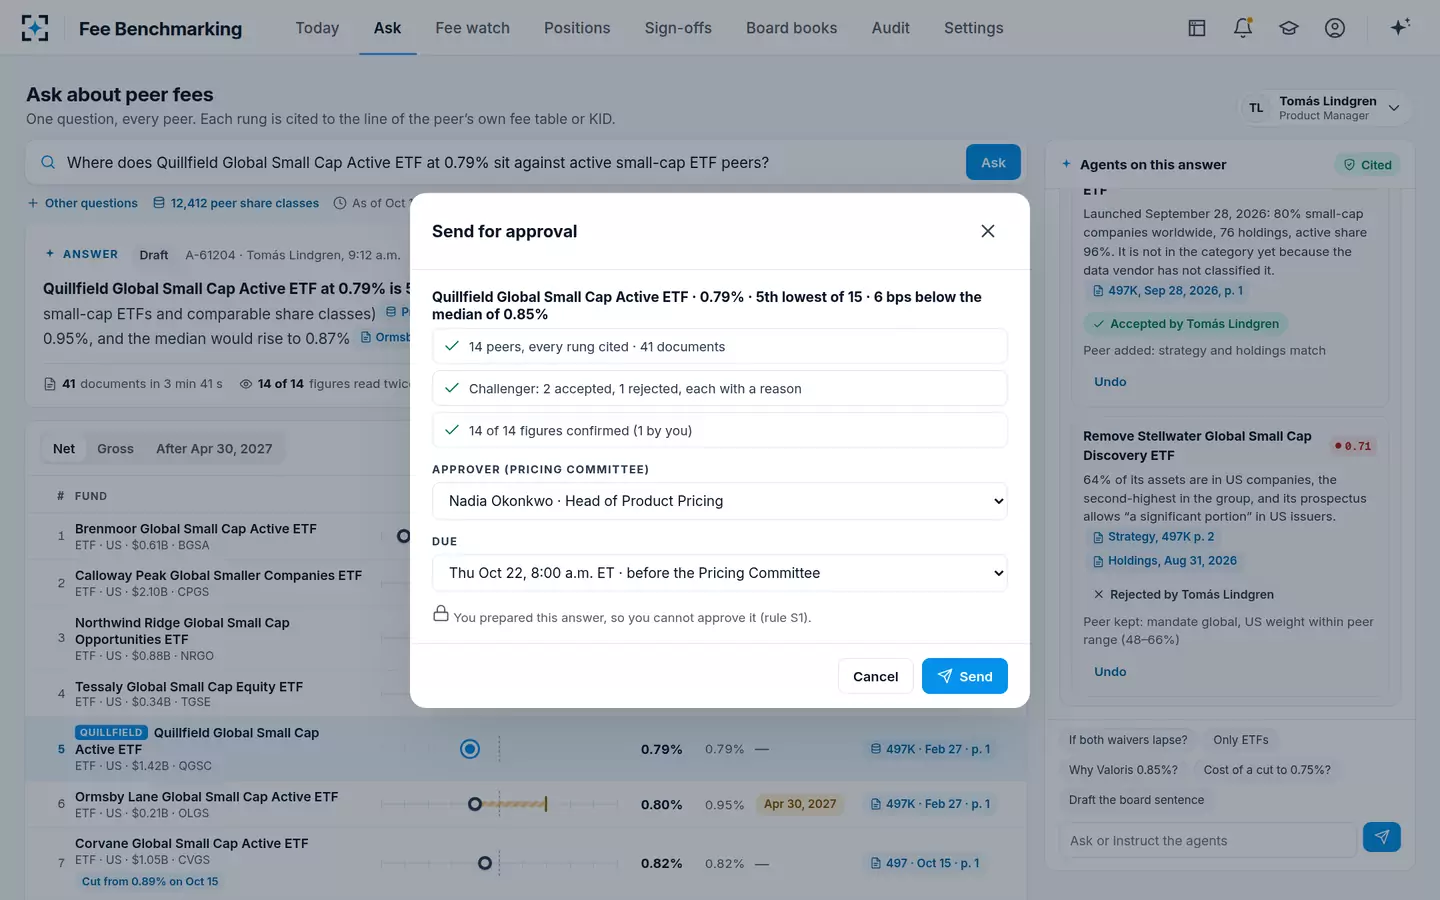
In the sample, that paper is the approved fee position: 0.79% against a peer median of 0.85% across 14 peers, 6 basis points below and 8 once two waivers end, with every rung cited; a restricted scenario showing $142,000 a year per basis point; and the decision to hold, with the reason code "Hold the fee: within 10 bps of peer median". Version 1, approved in July, had read a 0.86% median; version 2 records the competitor's cut, one fund added, one removed and one liquidated, so the committee can see why the answer moved.
How Botminds' Fee Benchmarking prices the basis point
Botminds' Fee Benchmarking keeps the market evidence and the money in one place without mixing their audiences. The peer ladder, every rung cited to its fee table or KID, is visible to everyone with access, because it rests on public filings. The scenarios, what each basis point is worth and what a cut would cost and buy in rank, are restricted to the Pricing Committee, the fund's product manager and the fund treasurer, because an unannounced fee change is sensitive. An approved fee position records the decision and its reason, and the watch agent re-runs it when a peer files a change.
The answer the Pricing Committee receives, and who may approve it
Questions people ask
Is an ETF's management fee the same as its expense ratio?
Not always. With a unitary fee the two are close, because the adviser pays most operating costs from the management fee. Otherwise the expense ratio adds other expenses, any 12b-1 fees and any acquired fund fees to the management fee, so compare the fee table's total annual fund operating expenses.
How are ETF management fees charged?
They are deducted from the fund's assets rather than billed to investors, so they reduce the fund's net asset value and its returns. The fee table states them as a percentage of the value of an investment each year, and the cost example below it converts that into dollars on $10,000.
Are ETF fees lower than mutual fund fees?
Often, but compare like with like. ESMA reports that active ETFs cost slightly more than passive ETFs and less than active funds. In the US, a mutual fund's no-load, no-12b-1 institutional class can be close to an ETF in the same strategy, while a retail class with distribution fees will not be.
Does a fee cut pay for itself?
Only if assets grow enough. On the sample's $1.42 billion fund, a cut from 0.79% to 0.75% gives up $568,000 a year and needs about 5.3% more assets to earn the same revenue, before any response from peers. Price the break-even before deciding, and check whether competitors' waivers are about to lift the median anyway.
What is a good management fee for an active ETF?
One that is justified against peers with the same strategy and against the cost of running the fund. No US regulator publishes a category average to measure against, so build a cited peer group, place the fund within it, and know what each basis point of difference is worth.