"Costs paid as a percentage of a $10,000 investment" is the expense ratio of the share class the report covers, and despite its heading it does not depend on $10,000 at all: in an annual shareholder report it is the ratio printed in the fund's audited financial highlights, and in a semi-annual report it is the half-year's ratio, annualized. The column beside it, "Costs of a $10,000 investment", is where the $10,000 matters: Form N-1A says to multiply the percentage by the average value of a $10,000 account over the period and round to the nearest dollar. In the SEC staff's own example, a 0.60% ratio on an average account of $12,000 gives $72. Funds in the first cycle under the 2022 rule multiplied by $10,000 instead, annualized semi-annual dollars and printed cents. Botminds' Tailored Shareholder Reports rebuilds this line from raw class expenses and net assets on every class report, so a wrong figure is caught before a shareholder sees it.
The three errors the SEC staff found, against what the form requires
What some funds did: Cost percentage × $10,000. At 0.60% that is always $60, whatever the fund returned.
What Form N-1A and the staff require: Cost percentage × the average account value over the period, starting from $10,000. At 0.60% on an average account of $12,000: $72.
What some funds did: A full year's cost, so a six-month report showed roughly twice what a shareholder paid.
What Form N-1A and the staff require: The cost over the six months, not annualized. Only the percentage is annualized.
What some funds did: Dollars to the cent, such as $71.64.
What Form N-1A and the staff require: Dollars rounded to the nearest dollar; percentages to the nearest hundredth of one percent.
What does "costs paid as a percentage of a $10,000 investment" mean?
It means the class's expense ratio: total annual operating expenses after any waiver or reimbursement, as a share of the class's average net assets. Item 27A(c) describes the column as "expenses as a percent of an investor's investment in the Fund (i.e. expense ratio)". The heading the form prints over it, "Costs paid as a percentage of a $10,000 investment", is the source of a common misreading, because the percentage would be the same on $1,000 or $1 million. The instructions call the same column "Cost paid as a percentage of your investment".
The table sits on the cover page or at the beginning of the report, under the prescribed heading "What were the Fund costs for the last [year/six months]?" and "(based on a hypothetical $10,000 investment)". It has one row, for the class the report covers. Before the 2022 rule, funds showed the costs of a $1,000 investment in two tables, one on the fund's actual return and one on a hypothetical 5% return; the SEC raised the amount "in order to present a more realistic investment amount for an individual shareholder today" and declined to let funds with high minimums use a larger figure, because "this would undermine comparing different funds" (SEC Release 33-11125).
How is the TSR expense example calculated? The SEC's $72 worked example
The tailored shareholder report expense example is calculated in two multiplications and a rounding. Instruction 2(a) to Item 27A(c) is the whole method:
To determine "Costs of a $10,000 investment," multiply the figure in the "Cost paid as a percentage of your investment" column by the average account value over the period based on an investment of $10,000 at the beginning of the period.
Form N-1A, Item 27A(c), Instruction 2(a)
The SEC staff worked it through in ADI 2024-14: "if a fund had expenses of 0.60%, and the average account value over the period on an initial investment of $10,000 is $12,000 for the annual period, the dollar cost over the annual period would be $72 [$12,000 x 0.60%]." Two further instructions complete it: assume every dividend and distribution is reinvested (Instruction 2(b)), and round "all dollar figures in the table to the nearest dollar" and percentages "to the nearest hundredth of one percent" (Instruction 1(a)).
The expense example calculated step by step, on the SEC staff's numbers and on one sample class
| Step | SEC staff example | Sample Class C, annual report | Rule |
|---|---|---|---|
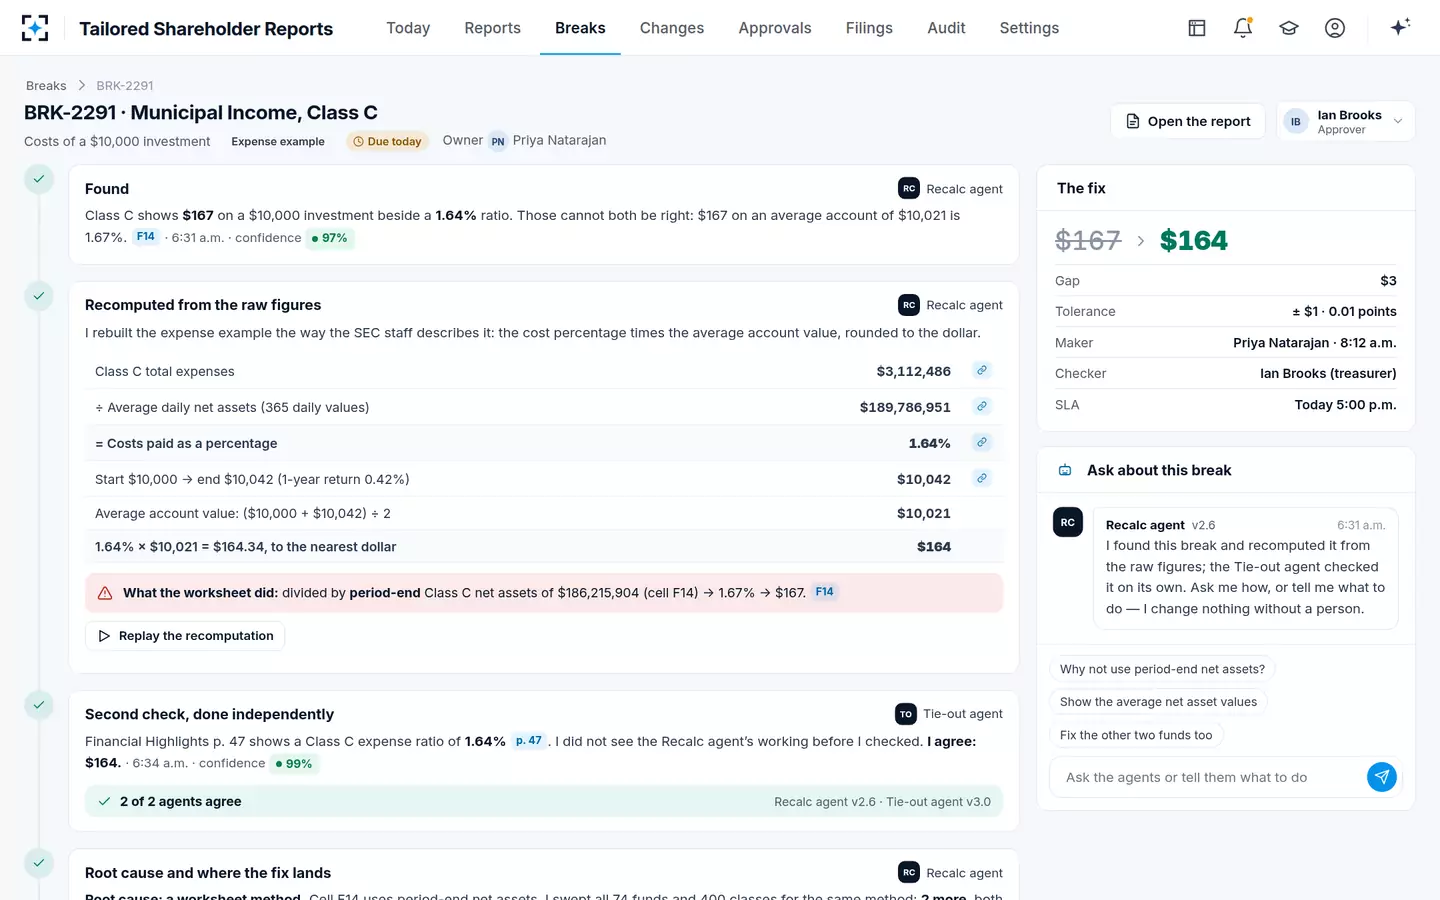
| 1. Expense ratio for the period | 0.60% | $3,112,486 of class expenses ÷ $189,786,951 of average daily net assets = 1.64% | Annual report: the ratio in the audited financial highlights |
| 2. Account at the start | $10,000 | $10,000 | Fixed by the form |
| 3. Account at the end, distributions reinvested | Not stated | $10,042 (a 0.42% return before the deferred sales charge) | Instruction 2(b) |
| 4. Average account value over the period | $12,000 | ($10,000 + $10,042) ÷ 2 = $10,021 | Instruction 2(a) |
| 5. Ratio × average account value | $12,000 × 0.60% = $72.00 | $10,021 × 1.64% = $164.34 | Instruction 2(a) |
| 6. Round to the nearest dollar | $72 | $164 | Instruction 1(a) |
Why is the cost not $10,000 times the expense ratio?
Because a shareholder pays the ratio on what the account is worth while the fees accrue, not on what it was worth on the first day. A fund that gains during the year charges its ratio on a growing balance, so the dollar cost rises; a fund that loses charges it on a shrinking one. Multiplying by $10,000 ignores the year's return entirely and makes every fund with the same ratio report the same dollars. The staff's verdict on that method, in ADI 2024-14, was four words long: "This is not correct."
At the same 0.60% ratio, the year's return moves the dollar cost from $54 to $72
The error is not cosmetic. The expense table is the one place in the report a retail shareholder sees fees in dollars, and fees are where examiners look: the SEC Division of Examinations says its fiscal 2027 examinations of registered funds "will focus particularly on RIC operations relating to, first, fund fees and expenses, including any related waivers or reimbursements" (SEC, FY2027 Examination Priorities). A dollar figure that cannot be rebuilt from the ratio and the account path is the first thing a reviewer can test.
Should semi-annual costs be annualized? Dollars no, percentage yes
In a semi-annual shareholder report the two columns follow different rules, and the staff saw funds treat them alike. The percentage must be annualized: Instruction 2(c) to Item 27A(c) says to compute the ratio from the half-year's expenses "in the manner required by Instruction 4(b) to Item 13(a)" and "Express the expense ratio on an annualized basis." The dollars must not be: the staff wrote that the semi-annual report "should reflect the dollar cost over the period" because the form asks for "expenses in dollars paid on a $10,000 investment during the period".
In arithmetic, that means taking the annualized ratio back down to the six months before applying it to the average account. Take an illustrative class with a 0.60% annualized ratio and an average account of $10,300 over a 181-day half-year: 0.60% × $10,300 × 181 ÷ 365 is $30.65, shown as $31. A report that printed $62 annualized the dollars, and a shareholder comparing it with the next annual report would see costs apparently halve. The form does not prescribe the day count, so a fund should write its method down and use it every period. The staff also suggested a courtesy line: funds "might consider noting in their semi-annual reports that costs paid as a percentage of a $10,000 investment is an annualized figure."
Where does the expense ratio in a shareholder report come from?
From the fund's own financial statements, not the prospectus fee table. In the annual report, Instruction 2(c) requires the ratio "as it appears in the Fund's most recent audited financial statements or financial highlights". The financial highlights ratio is itself prescribed: Item 13(a) requires average net assets taken at least at every month-end, and expenses as shown in the statement of operations (the financial highlights ratios guide works the calculation), including the reductions from fee waivers and reimbursements. The prospectus fee table answers a different question, what an investor may pay going forward, and Item 3 tells a fund to restate it using current fees after a material change, so the two figures can differ when a waiver starts, ends or changes mid-year.
That is why the shareholder report percentage, the financial highlights and the Inline XBRL fact must be the same number, and why the most common way the dollar figure goes wrong is upstream of the multiplication. A worksheet that divides class expenses by the period-end net assets instead of the average produces a ratio that is close but not the highlights ratio, and every figure built on it inherits the gap.
Fee waivers: the ratio after the waiver goes in, and a change in the waiver may need its own paragraph
Where an adviser waives fees or reimburses expenses, the costs line uses the ratio after the waiver, because the financial highlights ratio is calculated on expenses "including" the reductions "regarding fee waivers and reimbursements" (Instruction 4(b) to Item 13(a)). Many highlights tables also print a ratio before waivers; in the sample fund's Class C it is 1.66% against 1.64% after. Picking the wrong line of the same table is an error no recalculation from the ratio will catch, which is why the check has to start from the page, not from the worksheet.
The waiver can also change the rest of the report. Starting or ending an expense reimbursement or fee waiver arrangement is one of the six topics Item 27A(g) lists for material fund changes, so a mid-year change to a cap can require a short description and the bold cover statement as well as a different ratio. In the sample, the adviser lowered the Class C expense limitation from 1.69% to 1.64% from December 1, 2025, and both the costs line and the changes paragraph had to agree with it.
One sample break: $167 that should have been $164
Feeder funds, short periods and extraordinary expenses
Three footnote rules change the line for particular funds, and each is easy to miss in a template built for the plain case. A feeder fund must "reflect the aggregate expenses of the Feeder Fund and the Master Fund" and say so in a footnote (Instruction 1(b)), so the ratio is not the feeder's own highlights ratio alone. A class that existed for only part of the period must add a footnote "to briefly explain that expenses for the full reporting period would be higher" (Instruction 1(c)), which matters for every new class in its first report.
Extraordinary expenses are the one place a fund may add a second figure. Instruction 1(d) lets a fund footnote "what actual costs would have been if extraordinary expenses were not included", and defines them narrowly, by "their unusual nature and by the infrequency of their occurrence". A one-off litigation cost might qualify; a routine rise in custody fees would not. The test belongs to the fund's accountants and counsel, and the table itself still shows the ratio as reported.
How the solution checks the line on 400 class reports
A fund family with many classes makes the same calculation hundreds of times, and a wrong formula in one worksheet cell reaches every report built from it. In the sample family, 74 funds and 400 class reports, the error above was not a one-off. After the treasurer approved the fix for Class C, the Recalc agent searched every fund and class for the same worksheet method and found two more: High Yield Bond Class C ($177 that should be $174) and Global Real Estate Class C ($192 that should be $188).
The checks are set as tolerances the treasurer approves: the dollar figure within $1 of the ratio times the average account, and the percentage within 0.01 points of the financial highlights, net of waivers. A gap over tolerance becomes a break with both agents' workings; a fund administration analyst proposes the fix and the treasurer, as a different person, approves it with a reason code. Fixing the dollar figure means fixing it everywhere it appears, which is the part a spreadsheet does not do by itself.
The fix lands in five places, and the same method is found in two more classes
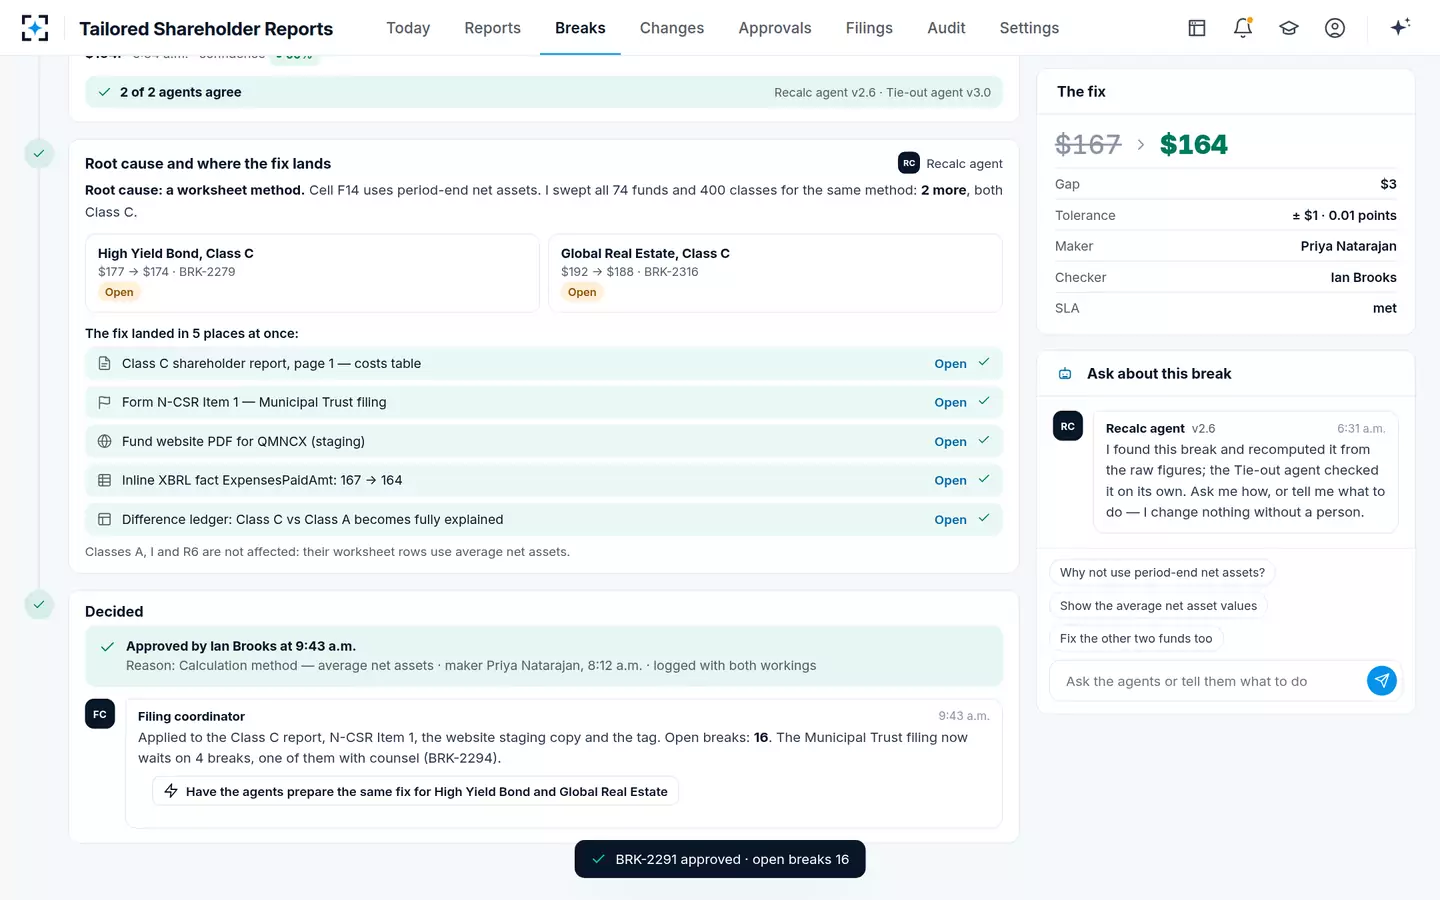
Inline XBRL is part of the line too: the dollar figure is a tagged fact, and where agents sit beside the XBRL tagging tool covers what happens when the tag and the printed figure disagree. The line's place in the whole report is shown in the annotated tailored shareholder reports example.
A check sheet for the $10,000 line, class by class
- Annual percentage equals the audited highlights ratio
Same class, same period, after waivers and reimbursements.
- Semi-annual percentage computed from the half-year and annualized
Instruction 2(c) to Item 27A(c), by the Item 13(a) method.
- Dollars = percentage × average account value
Never × $10,000; the account path assumes reinvested distributions.
- Semi-annual dollars cover six months
A figure close to the annual report's means the dollars were annualized.
- Rounded: dollars to the dollar, percent to two decimals
$164, not $164.34; 1.64%, not 1.640%.
- Feeder, new-class and extraordinary-expense footnotes
Master and feeder combined; short period noted; any extraordinary-expense figure only in a footnote.
- Report, N-CSR Item 1, website and XBRL fact agree
One number in four places; a fix is not done until all four match.
- Worksheet method documented and the same every period
Average net assets, averaging method and day count written down.
To see the line recomputed on your own classes, start from Tailored Shareholder Reports.
Questions people ask
What is the mutual fund expense ratio formula in a shareholder report?
The class's expenses for the period, as shown in the statement of operations after waivers and reimbursements, divided by its average net assets measured at least monthly; for a half-year, annualized. In an annual tailored shareholder report the figure is taken from the audited financial highlights, rounded to the nearest hundredth of one percent.
Is the expense example the same as the prospectus fee table example?
No. The prospectus example projects costs over one, three, five and ten years on assumed returns, from the fee table's estimated expenses. The shareholder report shows what a $10,000 account actually cost over the period just ended, on the fund's actual return and its actual expense ratio.
Why does Class C show more dollars than Class A in the same fund?
Mostly because the class terms differ: in the sample fund, Class C carries a 1.00% distribution and service (12b-1) fee against 0.25% for Class A, so its ratio is 1.64% against 0.89%, and its costs on a $10,000 investment were $164 against $90. A class difference that the terms do not explain is a reason to check the worksheet.
What average account value should be used if the fund lost money?
The same method as in a gain: the average value over the period of an account that started at $10,000, with distributions reinvested. A fund that fell 20% has an average account below $10,000, so its dollar cost is lower than $10,000 times the ratio. The form does not prescribe start-and-end or monthly averaging; a finer average is more accurate when the path is uneven.
Can a fund show the cost on a larger investment?
Not as the default. The SEC declined to let funds with higher minimums use a larger amount, because it would undermine comparison between funds. Online, Instruction 8 to Item 27A(a) encourages tools that let an investor change the dollar value, adding: "The default presentation must use the value that the applicable form requirement prescribes."
What happens if the expense example was wrong in a filed report?
The fund decides with counsel whether to correct it, and a correction is filed as an amendment to Form N-CSR. In its FAQ the SEC staff said it would be reasonable for the amendment to include a complete version of the corrected report, with every element tagged in Inline XBRL, not only the changed figure.