Investment company financial highlights are a fund's five-year table of results for one share and its key ratios: net asset value at the start and end of each year, net investment income and net gains or losses per share, distributions, total return, net assets, the ratio of expenses and of net income to average net assets, and portfolio turnover. Nothing in the table is typed in; every figure is derived from the financial statements and the capital stock records by a formula, which for mutual funds and ETFs is written in Item 13 of the SEC's Form N-1A. That is why auditors recompute the table rather than read it, and why a highlights table with a one-cent difference can hold up a filing. Botminds' Fund Financial Statements drafts the highlights for each share class from the same records and ties every per-share figure to its source at a $0.01 tolerance, so the reporting team reviews the differences instead of rebuilding the table.
The worked figures on this page are illustrative and ours; the screens show the solution's fictional sample data.
Six figures in the financial highlights, each with its formula and its check
Net investment income per share
Change in undistributed net investment income per share + dividends from net investment income per share
RuleInstruction 2(a); undistributed income from the balance sheet, shares from the capital stock records
What to recomputeShares outstanding at both dates, and the method named in a note if another one is used
Net gains or losses per share
The balancing figure: end NAV − begin NAV − net investment income + distributions
RuleInstruction 2(b)
What to recomputeThat it balances to the cent; it need not match the statement of operations divided by shares
Total return
Buy at the NAV on the last business day before the period; reinvest all distributions; redeem at the last day's price
RuleInstruction 3; no sales loads in the initial investment
What to recomputeReinvestment dates and NAVs from the distribution records; "not annualized" for a short period
Ratio of expenses to average net assets
Expenses in the statement of operations ÷ average of net assets taken at least monthly
RuleInstruction 4(a)–(b); Regulation S-X Rule 6-07 for waivers and offset arrangements
What to recomputeThe expense total after waivers and reimbursements, and the count of month-ends in the average
Ratio of net income to average net assets
Net investment income ÷ the same average net assets
RuleTable caption; average per Instruction 4(a)
What to recomputeThe same denominator as the expense ratio
Portfolio turnover rate
Lesser of long-term purchases or sales ÷ average of 13 month-end portfolio values
RuleInstruction 4(d)
What to recomputeShort-term securities excluded from both sides; merger purchases and sales stripped out and footnoted
What are financial highlights?
They are the condensed history of what one share of the fund earned and cost. Form N-1A asks for the table "audited for at least the latest 5 years" and gives the narrative that introduces it: "The financial highlights table is intended to help you understand the Fund's financial performance for the past 5 years," and "The total returns in the table represent the rate that an investor would have earned [or lost] on an investment in the Fund (assuming reinvestment of all dividends and distributions)" (SEC Form N-1A, Item 13(a)).
The table's captions are fixed, and their order is the order of the arithmetic: net asset value at the beginning of the period; income from investment operations, split into net investment income and net gains or losses on securities; distributions, split into dividends from net investment income, distributions from capital gains and returns of capital; net asset value at the end; then total return and the ratios. Since swing pricing was written into the form, two captions sit inside the per-share block for funds that use it: capital adjustments due to swing pricing, and the end-of-period NAV as adjusted.
An illustrative financial highlights column for one share class, one year
| Caption (Form N-1A Item 13) | Per share | How it is derived |
|---|---|---|
| Net asset value, beginning of period | $10.00 | Last year's ending NAV; must equal last year's filed table |
| Net investment income | $0.42 | Instruction 2(a) method, from undistributed income and dividends |
| Net gains or losses on securities (realized and unrealized) | $0.18 | Balancing figure (Instruction 2(b)) |
| Total from investment operations | $0.60 | Sum of the two lines above |
| Dividends (from net investment income) | ($0.41) | Distribution records, by class |
| Distributions (from capital gains) | ($0.05) | Distribution records, by class |
| Net asset value, end of period | $10.14 | Capital stock records; must equal the balance sheet NAV per share |
| Ratio of expenses to average net assets | 0.52% | $6,450,000 ÷ $1,250,000,000 average net assets |
| Portfolio turnover rate | 31% | $386 million of sales ÷ $1,247 million average portfolio |
How is net investment income per share calculated?
Form N-1A gives a default method and allows others if disclosed. The default derives the figure "by adding (deducting) the increase (decrease) per share in undistributed net investment income for the period to (from) dividends from net investment income per share for the period", with the per-share undistributed amounts obtained by dividing undistributed net investment income at the start and end of the period by the shares outstanding on those dates. The instruction ends: "Other methods of computing net investment income may be acceptable. Provide an explanation in a note to the table of any other method used" (Instruction 2(a)).
For a reviewer this means two things. The method is a choice that must be consistent from year to year and named in a note when it is not the default. And the inputs come from two different records: undistributed income from the balance sheet's components of net assets, and share counts from the transfer agent's capital stock records. A per-share figure that differs by a cent usually traces to a share count taken at a different moment than the balance, not to the income itself.
Why net gains or losses per share is a balancing figure
Because shares come and go during the year, the gains earned by a share held all year are not the fund's total gains divided by its shares. Form N-1A says so directly: the amount "is the balancing figure derived from the other amounts in the statement," and it "may not agree with the change in the aggregate gains and losses in the portfolio securities for the year because of the timing of sales and repurchases of the Fund's shares in relation to fluctuating market values for the portfolio" (Instruction 2(b)).
"The amount shown at the Net Gains or Losses on Securities caption is the balancing figure derived from the other amounts in the statement."
SEC Form N-1A, Item 13, Instruction 2(b)
A balancing figure cannot be wrong by itself; it absorbs the error of every other line. That makes it the place auditors look when the beginning NAV, a distribution or the ending NAV is off. If last year's ending NAV per share was restated or mistyped, this year's gains figure quietly changes to make the column add. The check is therefore upstream: beginning NAV against last year's filed table, ending NAV against the balance sheet, and distributions against the declarations, class by class.
How is total return calculated in the financial highlights?
Total return is computed as if one share were bought at the start, all distributions reinvested, and the holding sold at the end. The instructions are specific: "Assume an initial investment made at the net asset value calculated on the last business day before the first day of each period shown"; "Do not reflect sales loads or account fees in the initial investment" but note that they are not reflected; "Reflect any sales load assessed upon reinvestment of dividends or distributions"; "Assume a redemption at the price calculated on the last business day of each period shown"; and for a period of less than a full year, state the return for the period and disclose that it is "not annualized" (Instruction 3).
The reinvestment assumption is what separates the table's total return from a simple change in NAV. In the illustrative column, NAV rose from $10.00 to $10.14, but $0.46 was paid out. If every distribution had been paid on the last day, the return would be ($10.14 + $0.46) ÷ $10.00 − 1 = 6.00%. Paid earlier and reinvested at a lower or higher NAV, the same distributions produce a different number, which is why the reinvestment dates and NAVs from the distribution records are part of the recomputation, not a detail of it.
How is the expense ratio calculated in mutual funds?
The ratio of expenses to average net assets uses the expense total from the statement of operations and an average of net assets taken at least monthly. Form N-1A requires that "average net assets" be calculated "based on the value of the net assets determined no less frequently than the end of each month," and that the expense ratio use "the amount of expenses shown in the Fund's statement of operations for the relevant fiscal period, including increases resulting from complying with paragraph 2(g) of rule 6-07 of Regulation S-X and reductions resulting from complying with paragraphs 2(a) and (f) of rule 6-07 regarding fee waivers and reimbursements" (Instruction 4(a)–(b), as printed in 87 FR 72758).
Those cross-references carry real money. Rule 6-07 2(g) adds back the cost of services a broker or an expense-offset arrangement paid for, so they show as expenses; 2(a) shows "Reductions or reimbursements of management or service fees" as a negative amount; and 2(f) shows reimbursements under a 12b-1 plan as a negative amount (Regulation S-X Rule 6-07). In the illustrative fund, $6,450,000 of expenses after waivers, over average net assets of $1,250,000,000, gives 0.516%, shown as 0.52%. A waiver missing from the trial balance raises the expense line and the ratio together, so the error is caught cheapest where the expense line is tied, before any ratio is computed. It is one of the causes in the solution's fictional sample cycle: "Expense waiver missing from the trial balance", three open ticks in one fund.
How is portfolio turnover rate calculated?
Turnover divides the lesser of purchases or sales of long-term securities by their average value over thirteen month-ends. The instruction: divide "the lesser of amounts of purchases or sales of portfolio securities for the fiscal year by the monthly average of the value of the portfolio securities owned by the Fund during the fiscal year," calculating the average "by totaling the values of portfolio securities as of the beginning and end of the first month of the fiscal year and as of the end of each of the succeeding 11 months and dividing the sum by 13" (Instruction 4(d)(i)). Securities with maturities of a year or less at acquisition are excluded from both sides; money market funds may omit the rate.
Thirteen values make the turnover denominator, not twelve
The adjustments are where turnover goes wrong. Short sales the fund intends to hold for more than a year and options expiring more than a year from acquisition are included. Cash paid on a conversion counts as a purchase; proceeds of called or matured securities count as sales. And if the fund absorbed another fund's assets in exchange for its own shares, the acquired securities and the sales made to realign the portfolio are excluded and footnoted (Instruction 4(d)(ii)–(iv)). A merger year without that footnote is a turnover figure the auditor will recompute.
Where are the financial highlights filed now?
On Form N-CSR, not in the shareholder report. Since the 2022 amendments took effect, a mutual fund or ETF files "their financial highlights information on Form N-CSR" under Item 7(b), and the SEC said that information "is identical to the information currently required in fund shareholder reports" (87 FR 72758). It must be online within 60 days of the period end, on the same terms as the full statements (Rule 30e-1(b)(2)(i)).
Some highlights still reach the short report, and they must agree. The shareholder report shows the expense ratio in its expense section, and net assets and portfolio turnover among its fund statistics, and the rule requires any statistic that appears in, or can be derived from, the statements or highlights to be taken from them. That creates a cross-document tie: the turnover in the shareholder report against the turnover in Form N-CSR. What moved, and what stayed, is set out in the tailored shareholder report requirements guide.
Do private funds present financial highlights?
Those within ASC 946 do: the SEC has said US GAAP requires financial highlights for pooled vehicles within the topic's scope, alongside a schedule of investments (SEC custody proposal, 91 FR 63870). They do not follow Form N-1A, which is the registration form for open-end funds, and the SEC has noted that US GAAP treats the performance reporting of certain private funds differently.
The SEC pointed to that difference in 2023, when it explained the liquid and illiquid fund categories in its private fund adviser rules. The factors it first proposed for an illiquid fund, among them that it "has a limited life", "does not continuously raise capital" and "has as a predominant operating strategy the return of the proceeds from disposition of investments to investors", "were aligned with the factors for determining how certain types of private funds should report performance under U.S. Generally Accepted Accounting Principles", citing ASC 946-205-50-23 (88 FR 63206). The rules themselves were vacated in 2024; the SEC's description of US GAAP in it still stands. For a private fund, the highlights template is therefore a status-and-structure decision, covered in the status test guide.
How Fund Financial Statements recomputes the highlights
The solution drafts a highlights column for every share class from the statements, the capital stock records and the distribution records, and ties each figure to its source. Per-share data is held to $0.01, the tolerance set for financial highlights by share class; footing and cross-footing run in deterministic code at a $1 rounding tolerance. Beginning NAV is tied to last year's filed report, ending NAV to the balance sheet, and the shareholder report's statistics to the highlights they come from.
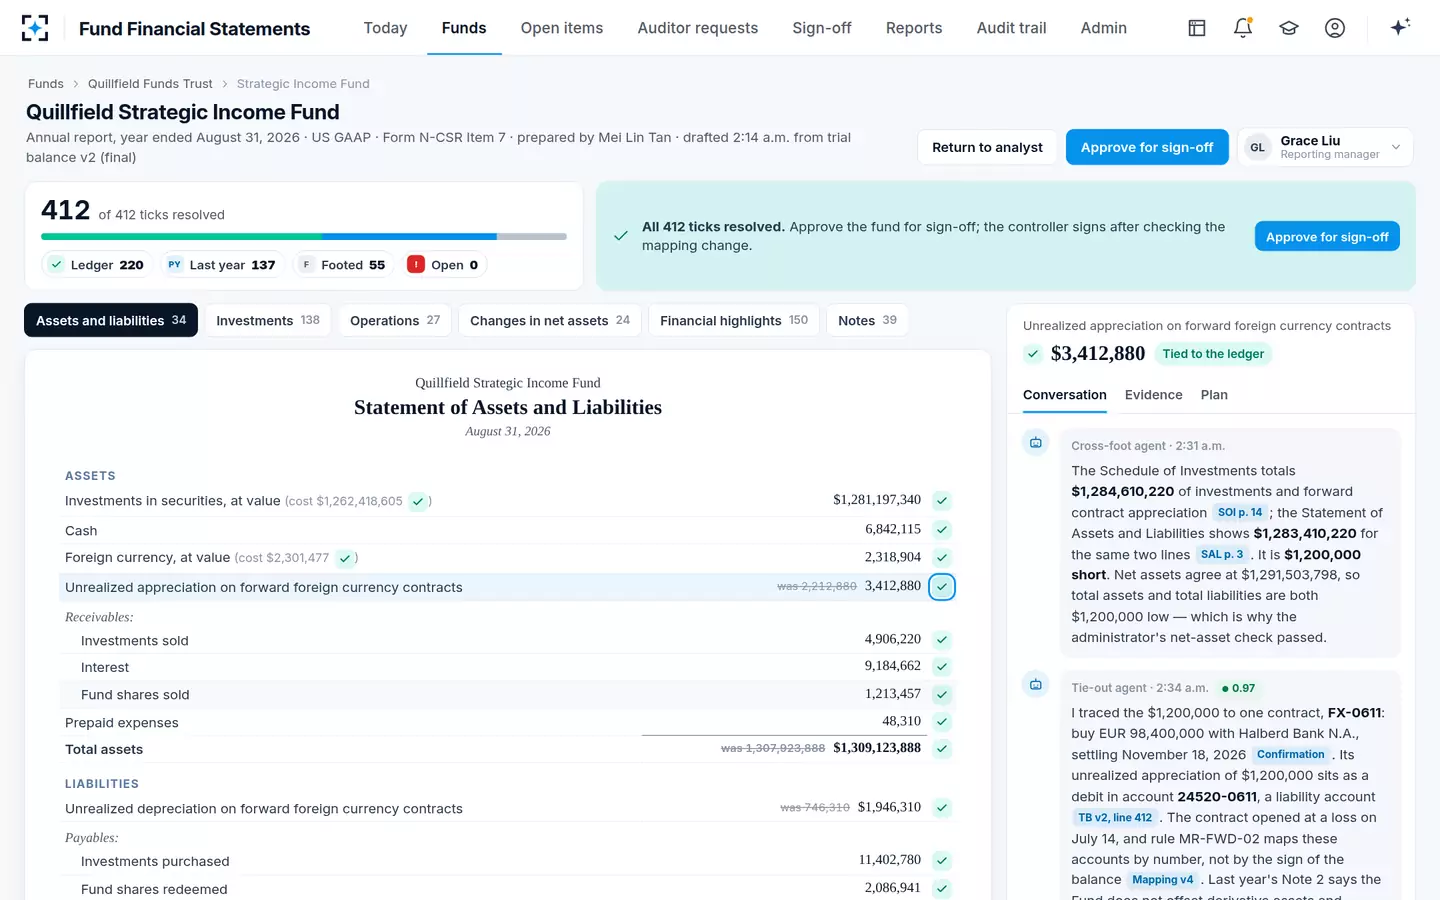
In the sample data, the Strategic Income Fund's highlights tab carries 150 ticks, the most of any tab in its statements, because each class adds a column of figures. Across the cycle, one open cause read "Per-share figure differs from the capital records by $0.01", five ticks in one fund: the kind of difference a person can clear in minutes with the capital records open, and can miss entirely in a 150-figure table checked by eye.
The highlights are one tab of a tied set, with 150 ticks for one fund
Before the highlights go to the auditor
- Beginning NAV equals last year's ending NAV as filed
Per class, to the cent, against the filed Form N-CSR rather than last year's working file.
- Ending NAV equals the balance sheet
Per class, including any swing-adjusted NAV caption where the fund uses swing pricing.
- The per-share block foots
Begin + operations − distributions = end, with net gains as the balancing figure and nothing else forced.
- Distributions agree to the declarations
Dividend and capital gain amounts per share by class; returns of capital stated separately with their nature.
- Total return reflects reinvestment
Dates and NAVs of each reinvestment taken from the distribution records; short periods marked not annualized.
- Ratios use the right numerators and denominators
Expenses after waivers per Rule 6-07; at least monthly average net assets; 13 values for turnover, with short-term securities out.
- The shareholder report agrees
Expense ratio, net assets and turnover in the short report equal the highlights filed on Form N-CSR.
Questions people ask
How many years do the financial highlights cover?
Five fiscal years, or the period since the fund began operations if shorter, in columns, plus the period from the latest year-end to the latest balance sheet date when one is presented. Form N-1A requires the table to be audited for at least the latest five years.
Are per-share amounts rounded to the cent?
At least to the nearest cent. If the fund's offering price is expressed in tenths of a cent or more, the table states amounts in tenths of a cent, and the number of decimal places must be consistent throughout. That is why a per-share check needs a tolerance stated in the same unit as the table.
Can ratios be annualized for a short period?
Ratios for a period of less than a full fiscal year may be annualized, with a note saying so. Total return for such a period is not annualized: it is stated for the period, with a note that it is not annualized. Mixing the two conventions in one column is a common review finding.
Does a money market fund report portfolio turnover?
No. Form N-1A lets a money market fund omit the portfolio turnover rate, and the 2022 amendments also exclude money market funds from showing turnover among their shareholder report statistics, because most of their holdings mature within a year and would be excluded from the calculation anyway.
What does the swing pricing caption show?
For a fund with swing pricing policies, the per-share effect of amounts retained under them, and the ending NAV as adjusted under the policies on the last day of the period. In February 2026 the SEC reported that no fund had used swing pricing as reported on Form N-CEN through October 2025 (91 FR 5545), so in practice the captions are empty, but a fund that adopts the policies takes on both.