Principal adverse impact indicators are the metrics a manager uses to report how its investments harm sustainability factors. Under the SFDR Delegated Regulation there are 18 mandatory ones in Table 1 of Annex I: 14 for investments in companies, two for sovereigns and two for real estate, plus at least one more from Table 2 (climate and environment) and one from Table 3 (social and governance). They are published each June 30 in the PAI statement, and each figure is the average of four quarter-end calculations. The hard part is not the list; it is that every number passes through holdings, enterprise values, issuer data and coverage decisions before it is printed, and supervisors have found errors at each step. Botminds' SFDR Reporting computes the indicators from a manager's own holdings and adverse-impact data and keeps each value's lineage, so any figure in the statement opens back to the holdings, the formula and the issuer's own page.
The product examples come from fictional sample data in SFDR Reporting: Quillfield Asset Management's 2025 statement, covering €286 billion of investments in scope. The method is quoted from the Delegated Regulation and the ESAs' consolidated Q&A; the supervisory findings from the ESAs' and ESMA's own reports.
One carbon-footprint figure, hop by hop, from a holding to the PAI statement
- 1
The holding at each quarter-end
Quantity held at March 31, June 30, September 30 and December 31, valued at the fiscal year-end price
ESAs answer IV.11: the composition changes by quarter; the valuation does not.
- 2
The share of the company owned
Current value of the investment ÷ the company's enterprise value including cash, fixed at fiscal year-end
Annex I definition; it "cannot be negative" (answer IV.14), and managers may not redefine it for banks (IV.13).
- 3
The emissions attributed
That share × the company's scope 1, 2 and 3 emissions for the latest year it has reported
Answer IV.10: the latest available data, applied to each quarter-end holding.
- 4
The portfolio total at that quarter-end
Sum of attributed emissions across holdings ÷ the current value of all investments, in EUR million
"All investments" includes funds, derivatives, loans, deposits and cash (answer III.2).
- 5
The figure printed
Average of the four quarter-end results, in tonnes CO2e per EUR million invested
Delegated Regulation 2022/1288, Article 6(3).
- 6
What travels with it
Last year's figure, an explanation of the change, the actions taken and planned, and the data behind it
Table 1 columns; Article 7(2) best efforts where data is missing.
What are the principal adverse impact indicators?
They are the rows of Table 1 of Annex I: nine climate and environment indicators and five social and governance indicators for investee companies, then two for sovereigns and two for real estate. Each row has a fixed metric, and the statement must give the impact for the year, the impact for the year before, an explanation and "Actions taken, and actions planned and targets set for the next reference period" (Delegated Regulation 2022/1288, Annex I, Table 1).
The 18 mandatory principal adverse impact indicators, and what each one measures
| # | Indicator | Metric, in short |
|---|---|---|
| 1 | GHG emissions | Scope 1, 2, 3 and total emissions attributed to the portfolio |
| 2 | Carbon footprint | Attributed emissions per EUR million invested |
| 3 | GHG intensity of investee companies | Emissions per EUR million of the companies' revenue |
| 4 | Exposure to fossil-fuel companies | Share of investments in companies with any fossil-fuel revenue |
| 5 | Non-renewable energy | Share of the companies' energy consumed and produced from non-renewable sources |
| 6 | Energy consumption intensity | GWh per EUR million of revenue, per high-impact climate sector |
| 7 | Biodiversity-sensitive areas | Share of investments in companies whose sites there harm those areas |
| 8 | Emissions to water | Tonnes per EUR million invested, weighted average |
| 9 | Hazardous and radioactive waste | Tonnes per EUR million invested, weighted average |
| 10 | UN Global Compact or OECD Guidelines violations | Share of investments in companies involved in violations |
| 11 | No processes to monitor those principles | Share of investments in companies without such policies or grievance mechanisms |
| 12 | Unadjusted gender pay gap | Average gap across investee companies |
| 13 | Board gender diversity | Average share of female board members |
| 14 | Controversial weapons | Share of investments in companies making or selling anti-personnel mines, cluster munitions, chemical or biological weapons |
| 15 | GHG intensity of sovereigns | Emissions of investee countries per unit of GDP |
| 16 | Countries subject to social violations | Number and share of investee countries |
| 17 | Fossil fuels through real estate | Share of real estate involved in fossil-fuel extraction, storage, transport or manufacture |
| 18 | Energy-inefficient real estate | Share of investments in energy-inefficient real estate |
Indicators 10 and 14 are binary at the company level and become shares of investments in the statement; how one incident moves indicator 10 belongs to controversy monitoring, which Botminds covers in ESG Risk Monitoring: PAI 10, from one court ruling to the statement. The extra indicators from Tables 2 and 3 are a choice of which, not whether: the manager "shall add" at least one of each (Article 6(1)).
What is a PAI statement, and who publishes one?
A PAI statement is the entity-level report, in the Table 1 template, of how a manager's investment decisions affect sustainability factors, published by June 30 for the previous calendar year. Managers averaging more than 500 employees must publish one; others publish voluntarily or explain why not. Besides the indicator table it holds the policies used to identify and prioritise impacts, "any associated margin of error within the methodologies", "the data sources used", engagement policies, adherence to international standards and a comparison with "up to the last five previous periods" (Articles 7 to 10).
The statement must cover every investment, not only the sustainable funds. ESMA recorded as non-compliance a manager whose website said its PAI statement "only relates to funds disclosing under Article 8 or 9 of SFDR", and reminded managers that they "should consider all investment decisions" (ESMA CSA final report, June 30, 2025, Example 6).
How is the PAI carbon footprint calculated?
The carbon footprint is the portfolio's attributed scope 1, 2 and 3 emissions divided by the current value of all its investments in EUR million, computed at each quarter-end and averaged. Attribution uses ownership: the value of the investment divided by the company's enterprise value, which Annex I builds from the market value of ordinary and preferred shares and the book value of debt and minority interests, with no cash netted off (Annex I, definition 4).
How are PAI indicators averaged over the year?
Each impact is the average of four calculations, at March 31, June 30, September 30 and December 31, each using the holdings at that date and the latest data the companies have reported. The rule is Article 6(3); the ESAs add that "four is the minimum but additional specific data points during the reference period could be considered", and that the aim is "to capture the change in the financial market participant's investments across a given financial year" (ESAs consolidated Q&A, answer IV.10).
The ESAs have published a worked example that shows why the quarterly average matters. A company emits 5,000 tonnes of CO2e in the year; a manager holds 10% of it for the first six months and nothing for the rest. Weighted at 10% in the March and June calculations and at zero in September and December, the company contributes "250 tonnes" to the manager's emissions for the year, not 500 and not zero (ESAs consolidated Q&A, answer IV.21). A manager that calculates once at December 31 would report zero for that company.
Three conventions in the Q&A decide the rest. Quarter-end impacts use "the valuation the individual investment (e.g. share) price valued at fiscal year-end multiplied by the quantity of investments (e.g. shares) held at the end of each quarter" (answer IV.11). Values in other currencies use "the exchange rate at the end of the fiscal year end for all the reference points" (IV.28). And short positions are netted against longs per company, "but without going below zero" (III.3). The enterprise-value step is shared with financed-emissions accounting, which Botminds' ESG Data Extraction reads from each issuer's own reports (the financed emissions calculation, line by line).
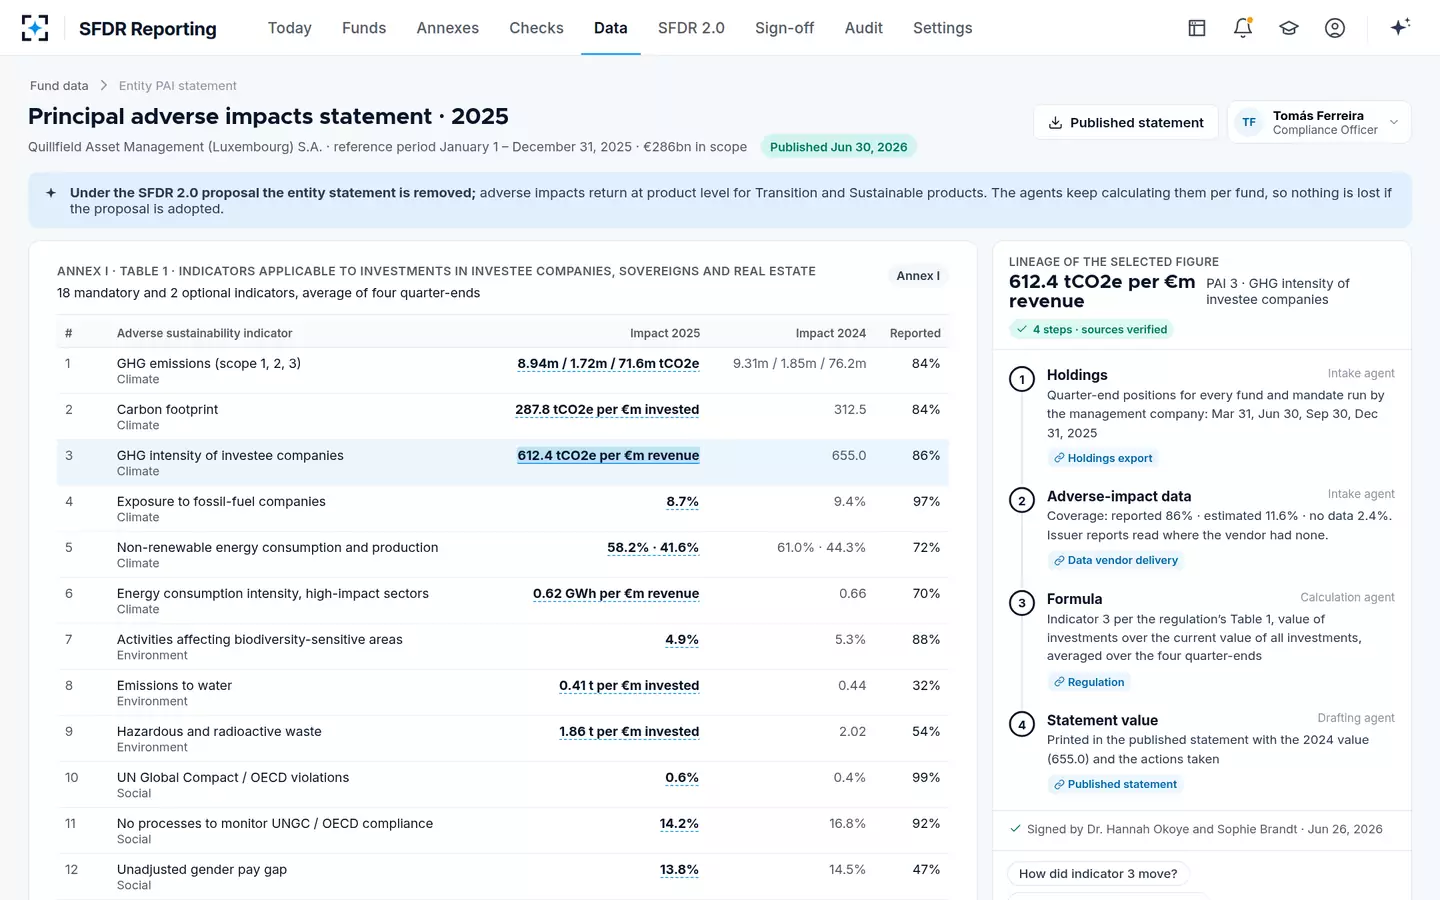
The 2025 PAI statement, with one indicator walked back to its holdings
What happens when PAI data is missing?
The rules say: make best efforts, and say what they were. Where information "is not readily available", the manager must describe "the best efforts used to obtain the information either directly from investee companies, or by carrying out additional research, cooperating with third party data providers or external experts or making reasonable assumptions" (Article 7(2)). The ESAs add that the quarterly calculation does not require quarterly data from companies; the latest annual figure is applied to each quarter-end holding (answer IV.10).
What managers actually did with gaps varied, and that variation is the main reason two statements are hard to compare. The ESAs found that for several indicators managers mostly recorded zero where data was missing; one manager instead used "the weighted average GHG intensity of the investee companies with emission data", and another "simply commented that the weights of the portfolio were adjusted" (ESAs, JC 2025 26, paragraph 44). The first approach understates the indicator; the second and third rescale it to the covered part of the portfolio. The ESAs' recommended practice is to disclose "the proportion of investments covered by data and distinguish that from the proportion that is estimated".
How much of each indicator is backed by data: average coverage in Article 8 funds
Read the chart as a warning about the bottom rows. An average emissions-to-water figure built on 13% coverage, with missing data entered as zero, describes the reporting more than the portfolio. The Commission's impact assessment reached the same view from the issuer side: in a sample of 12,000 issuers, "no single issuer reported data across all indicators", and environmental PAI coverage for small and medium EU companies "is close to 0%" (Commission impact assessment SWD(2025) 838).
What do PAI numbers look like across funds?
Wide, and not always in the direction the labels suggest. In the ESAs' 2025 analysis of fund-level data, the average carbon footprint was 353 tonnes of CO2e per EUR million invested across 6,971 Article 8 funds and 372 across 640 Article 9 funds; the medians were 269 and 247 (ESAs, JC 2025 26, Table 2). For GHG intensity of investee companies the averages were 752 tonnes per EUR million of revenue for Article 8 funds and 845 for Article 9 funds.
Two things follow. Averages well above medians mean a minority of funds with very high figures pull the averages up, so a fund should be compared with peers of the same strategy, not with a market mean. And an Article 9 average above the Article 8 one shows that the article describes a fund's objective, not its current footprint. A PAI number is a measurement of the portfolio, not a grade, which is why the template asks for an explanation and the actions taken beside every figure.
Where supervisors found errors in PAI numbers
Supervisors found errors at almost every hop of the path above. National authorities reported "errors in calculation of PAIs (e.g. using a calendar year end-approach instead of quarter-average approach)" (ESAs, JC 2025 26, paragraph 71), and ESMA found "inconsistencies in the calculations" in entity statements and noted that "practices can also vary between managers in the calculation of the denominator of some PAI indicators. Notably, some exclude derivatives" (ESMA CSA, paragraphs 18(b) and 48).
Six errors supervisors found in PAI statements, and the hop where each one enters
| Error found | Hop | What the rule or Q&A says |
|---|---|---|
| One calculation at year-end instead of four quarter-ends | 1 and 5 | Average of impacts at March 31, June 30, September 30 and December 31 (Article 6(3)) |
| Derivatives left out of the denominator | 4 | "All investments" includes derivative instruments, loans, deposits and cash (answer III.2) |
| Missing values entered as zero | 3 | Best efforts disclosed (Article 7(2)); all investments included |
| Emissions reported in the wrong unit or currency | 3 and 5 | Tonnes of CO2 equivalent; values in EUR at fiscal year-end rates (answer IV.28) |
| Prior-year figures restated without a word | 6 | Historical comparison, with an explanation of changes (Article 10; Table 1 "Explanation") |
| Real-estate and sovereign sections deleted from the template | Template | Rows may be empty or zero, but the template is kept (answer IV.15) |
The unit and currency errors look trivial, and that is why they survive review: a figure in tonnes of CO2 sits in the same cell as one in CO2 equivalent, and a dollar-denominated intensity looks like any other number. They are caught only by checking each value against its source and unit, not by reading the finished table.
How SFDR Reporting traces each PAI number
SFDR Reporting keeps the hops as data rather than spreadsheet history. On the sample statement, selecting 612.4 tonnes of CO2e per EUR million of revenue for indicator 3 opens four steps: the quarter-end holdings for every fund and mandate, the adverse-impact data with its coverage, the formula, and the printed value with last year's 655.0. The same lineage sits behind each of the 18 rows.
Who does what to one PAI number in SFDR Reporting
Agent
Intake agentLoads quarter-end holdings and two vendors' adverse-impact data; reads issuer annual reports in their own language where the vendor has nothing; marks each value reported or estimated.
Never: Invents a value, or uses one read below 95% confidence without a person
A person decides
Data reviewerResolves the exceptions the agent could not settle: missing scope 3, estimates that differ from reported values, low-confidence reads.
Agent
Calculation agentComputes each indicator at four quarter-ends with the approved methodology and averages them; keeps every input linked to the figure.
Never: Changes the methodology
Agent
Drafting agentFills Table 1 with this year and last year, drafts an explanation for each year-on-year change for a person to edit, links every figure.
Never: Publishes
A person decides
Compliance and head of sustainable investingCheck the lineage, approve the statement and sign it; people publish it on the website by June 30.
Coverage by indicator, with the exceptions a person must settle
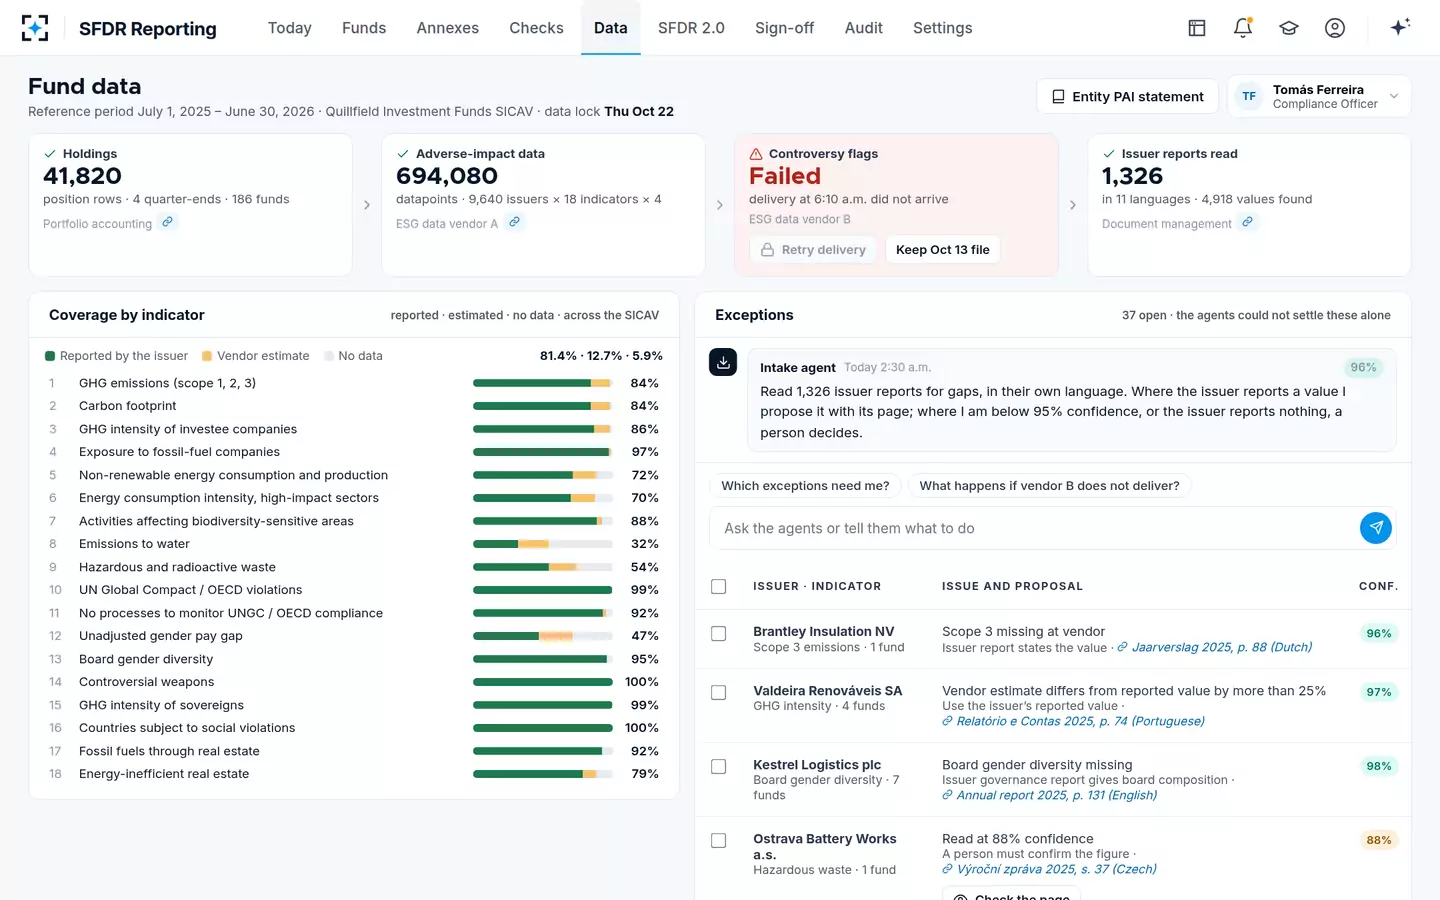
What one statement rests on in the sample firm
4
quarter-end holdings files per indicator, as Article 6(3) requires
694k
694,080 adverse-impact datapoints for one fund range's reporting year
4,918
values moved from vendor estimate to issuer-reported after reading 1,326 reports
81.4%
of datapoints reported by issuers; 12.7% estimated, 5.9% missing
The same path serves the fund-level reporting that remains under every version of SFDR 2.0. Sustainable and transition products would still identify and disclose their principal adverse impacts, so a firm that can trace an entity-level number can trace a product-level one. What PAI reporting costs a manager, and what the proposal would save, is set out in its own guide, and the June 30 deadline in the context of the full SFDR year in another.
Questions people ask
How many mandatory PAI indicators are there?
Eighteen in Table 1 of Annex I: 14 for investee companies, two for sovereigns and supranationals, and two for real estate. A manager must also add at least one indicator from Table 2 (additional climate and environment indicators) and one from Table 3 (additional social indicators), so a statement carries at least 20.
Why do people talk about 14 PAI indicators?
Because 14 of the 18 apply to investments in companies, which is most of what an equity or corporate-bond manager holds. The sovereign and real-estate rows still belong to the template; a manager without such investments leaves them empty or at zero rather than deleting them.
Is the PAI figure a year-end snapshot?
No. Each impact is the average of calculations at March 31, June 30, September 30 and December 31. Supervisors have flagged managers who used a calendar year-end approach instead of the quarter average as a calculation error.
What enterprise value is used for PAI attribution?
Enterprise value including cash: equity market value (ordinary and preferred) at the company's fiscal year-end, plus debt and minority interests at book value, with cash left in. Because cash is not deducted it cannot be negative, and the ESAs say managers should not develop their own version for banks.
Do PAI indicators apply to individual funds?
The entity statement covers all of a manager's investments. At product level, a fund's pre-contractual annex states whether and how it considers principal adverse impacts, and its periodic annex reports them; the ESAs found 89.2% of Article 8 funds and 97.2% of Article 9 funds in their sample consider them.
Will PAI indicators survive SFDR 2.0?
The entity-level statement would be deleted. Product-level adverse-impact disclosure would remain for the sustainable and transition categories, and the Commission's text builds the voluntary indicators for the categories on those in Annex I of the current Delegated Regulation.