A financed emissions calculation assigns to an investor the share of a company's greenhouse gas emissions that matches the investor's share of the company's financing. For listed shares and corporate bonds the share is the value of the holding divided by the company's enterprise value including cash (EVIC), and the financed emissions of a portfolio are the sum of that share times each issuer's emissions, holding by holding. The arithmetic is short and written into rules: the EU's SFDR delegated regulation defines enterprise value for the principal adverse impact statement, and IFRS S2 requires asset managers to disclose financed emissions by scope. What makes the work hard is the input, the issuer's emissions figure, which for much of a global book is a vendor's estimate rather than the company's own number. Botminds' ESG Data Extraction reads that number from each issuer's report, in its own language, and cites the page.
The worked example below uses sample data on a fictional asset manager, Quillfield Capital, and one of its holdings, the fictional Korean chemicals issuer Daeyang Chemical, as they run through the solution. The definitions come from the regulations themselves.
The financed emissions formula, worked on one holding
Value of the holding
$412.6 million
Held across six funds, from portfolio accounting
Divided by EVIC
$14.9 billion
Market value of equity plus book value of debt and minorities, cash not deducted
Attribution factor
2.769%
The share of the issuer the funds finance
Times the issuer's Scope 1
1,421,604 tCO₂e
Reported, FY2025, consolidated, page 87 of its own report
Financed Scope 1
39,366 tCO₂e
Was 32,675 t on the vendor's revenue-based estimate
What are financed emissions? The issuer's emissions, in proportion to what you finance
Financed emissions are the portion of an investee's emissions attributed to the loans and investments an investor holds in it. IFRS S2 defines them as "the portion of gross greenhouse gas emissions of an investee or counterparty attributed to the loans and investments made by an entity to the investee or counterparty", and places them inside Scope 3 Category 15 (investments) of the GHG Protocol's value-chain standard (IFRS S2, Appendix A).
For an asset manager the obligation under IFRS S2 is specific. Paragraph B61 asks for absolute gross financed emissions "disaggregated by Scope 1, Scope 2 and Scope 3", the assets under management included, the percentage of total AUM covered, and "the method of allocation the entity used to attribute its share of emissions in relation to the size of investments". The allocation method is the formula on this page; the coverage percentage is where most books fall short.
In the EU the same arithmetic sits inside the principal adverse impact statement. Indicator 1 of Table 1 asks for Scope 1, 2, 3 and total GHG emissions of investee companies, indicator 2 for the carbon footprint and indicator 3 for the GHG intensity of investee companies (RTS 2022/1288, Annex I). Indicator 1 is the sum of financed emissions; indicators 2 and 3 normalise it in two different ways, described further down.
The financed emissions formula, line by line
The formula has three lines. First, divide the current value of the investment by the issuer's EVIC: that is the attribution factor. Second, multiply the factor by the issuer's emissions for each scope. Third, add the results across every holding. Written out: financed emissions = Σ (value of investmenti ÷ EVICi) × emissionsi.
The European Central Bank writes its own version in plain text in its climate disclosures for the Eurosystem's monetary policy portfolios: total carbon emissions are the sum, over holdings, of "current value of investment i" divided by "EVIC" times the "issuer's carbon emissions" (ECB, Climate-related financial disclosures, June 2026, Annex 1). The SFDR regulation sets the units: the current value of investment is "the value in EUR of the investment by the financial market participant in the investee company".
Each line hides a choice. The value of the investment is a market value on a date; EVIC is measured "at fiscal year-end"; the emissions belong to a reporting year that is rarely the same year as either. A good calculation writes down all three dates beside the result, because a reader who cannot see them cannot tell a real change from a timing artefact.
How is EVIC calculated? Enterprise value including cash, step by step
EVIC is the sum of the market value of ordinary and preferred shares and the book value of debt and non-controlling interests, with no deduction for cash. The SFDR regulation's wording is exact: enterprise value is "the sum, at fiscal year-end, of the market capitalisation of ordinary shares, the market capitalisation of preferred shares, and the book value of total debt and non-controlling interests, without the deduction of cash or cash equivalents" (RTS 2022/1288, Annex I).
EVIC versus enterprise value net of cash, on an illustrative issuer
| Line | Source | Amount |
|---|---|---|
| Market capitalisation, ordinary shares | Share price × shares outstanding at fiscal year-end | $9,800 million |
| Market capitalisation, preferred shares | As above, if listed | $0 |
| Total debt, book value | Balance sheet at fiscal year-end | $4,600 million |
| Non-controlling interests, book value | Balance sheet at fiscal year-end | $500 million |
| EVIC | Sum of the four lines; cash not deducted | $14,900 million |
| For contrast: cash and equivalents | Balance sheet | $2,100 million |
| Enterprise value net of cash | EVIC minus cash, a definition the RTS does not use | $12,800 million |
The "including cash" matters more than its two words suggest. Deducting cash shrinks the denominator, raises every attribution factor and makes a cash-rich company look as if its investors financed more of its emissions. Keeping cash in also keeps EVIC positive for companies whose cash exceeds their debt, which a net-of-cash measure would not.
The ECB's own attribution table uses the same components, "the sum of the market capitalisation of ordinary shares at fiscal year-end, the market capitalisation of preferred shares at fiscal year-end, and the book values of total debt and minorities' interests", for corporate, supranational, agency and covered bonds alike (ECB, June 2026, Annex 2). A data team usually takes EVIC from portfolio accounting or a market-data feed; what it must check is that the fiscal year-end behind EVIC is the one the emissions figure belongs to.
Carbon footprint formula under SFDR, and the GHG intensity beside it
The carbon footprint divides a portfolio's financed emissions by the value invested; the GHG intensity of investee companies averages each issuer's emissions per unit of revenue, weighted by its share of the portfolio. The first answers "how much do we finance per million invested"; the second, "how carbon-intensive are the businesses we own". They move differently and should never be swapped.
Three principal adverse impact indicators from one emissions figure
What it divides by: Nothing: the sum of financed emissions, by scope, in tonnes CO₂e.
What moves it: Portfolio size, attribution factors (EVIC) and every issuer's emissions figure.
What it divides by: The current value of all investments, in € million: tonnes per € million invested.
What moves it: The same as indicator 1, but not the size of the book.
What it divides by: Each issuer's revenue in € million, weighted by its share of the portfolio: tonnes per € million of revenue.
What moves it: Which issuers are held and their revenue; EVIC plays no part.
Two practical points follow. Because indicator 3 needs revenue in euros and indicator 2 needs holdings in euros, a currency error moves them differently, and the ESAs' 2025 review found one firm reporting in US dollars rather than euros (ESAs, JC 2025 26). And because the European sustainability reporting standards ask companies themselves to disclose "total GHG emissions per net revenue", and footnote that datapoint as derived from PAI indicator 3, an issuer reporting under ESRS often prints its own intensity (ESRS E1, paragraph 53). It is worth reading, and worth recomputing: the investor's indicator needs Scope 1, 2 and 3 over revenue in euros, which may not be what the issuer chose to print.
A financed emissions calculation example: one issuer, estimated, then reported
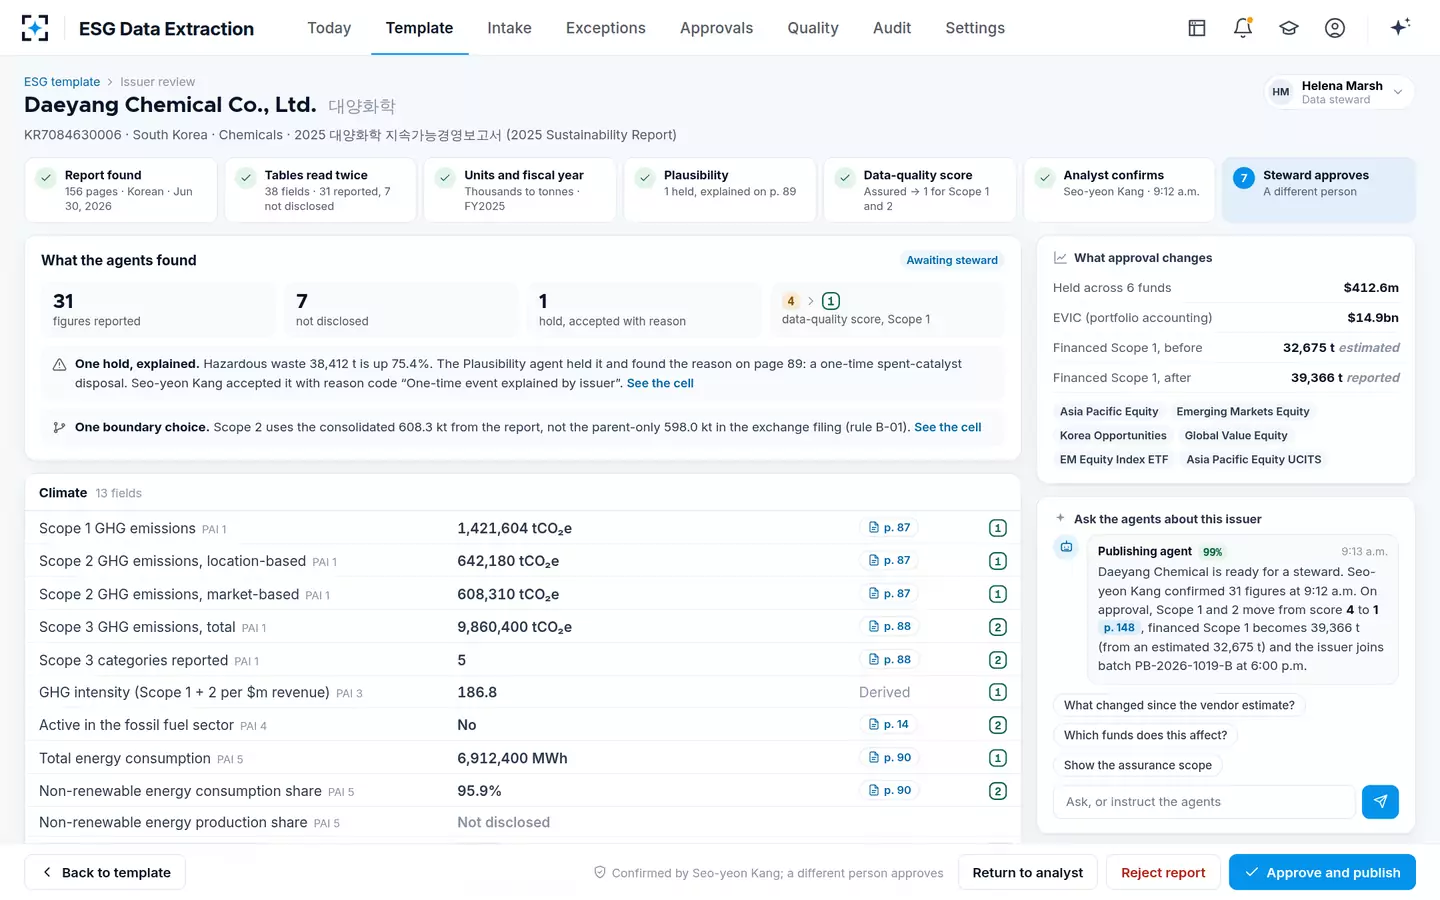
The example shows why the emissions input matters more than any other line. Quillfield's funds hold $412.6 million of Daeyang Chemical against an EVIC of $14.9 billion, an attribution factor of 2.769%. Until the issuer's report was read, Scope 1 sat on a vendor's revenue-based estimate of 1.18 million tonnes. Daeyang's 156-page Korean sustainability report gives 1,421,604 tCO₂e, consolidated, for fiscal 2025, with limited assurance covering it.
Same holding, same EVIC: the emissions input moved financed Scope 1 by a fifth
The 20% rise from estimate to report is not a rounding issue. Research on US companies found that vendors' estimated emissions differ from what firms disclose in a consistent direction, and move with financial size rather than with operations (Aswani, Raghunandan and Rajgopal, Review of Finance, 2024). An estimate built from revenue tracks revenue; a reported figure tracks the plant. For a portfolio, the difference between the two is the difference between a model of the book and a measurement of it.
ESG Data Extraction's issuer review: what approval changes in financed emissions
Financed emissions and Scope 3: the issuer's value chain inside yours
Financed emissions include the investee's Scope 3 if the calculation asks for it, and the rules increasingly do. PAI indicator 1 lists Scope 3 GHG emissions of investee companies beside Scopes 1 and 2, and IFRS S2 B61 asks asset managers for financed emissions disaggregated by all three scopes. Scope 3 is usually the largest of the three and the least reliable.
In the ECB's own corporate bond holdings, Scope 3 dwarfs Scopes 1 and 2
87%
of total carbon emissions of corporate holdings were Scope 3 in 2024
233.4Mt
Scope 3 of the Eurosystem's corporate bonds, end-2025
26.4Mt
Scopes 1 and 2 of the same bonds
That separation is good practice for any data team. An issuer's Scope 3 is itself an estimate built from spend, products sold and emission factors, and adding it to a reported Scope 1 produces a total whose quality is that of its weakest part. The sample issuer illustrates it: its Scope 3, 9.86 million tonnes across five reported categories, sits outside its assurance statement, so it scores a 2 where its Scope 1 scores a 1. Which holdings and which issuer emissions count in Category 15 is a decision tree of its own.
Why do financed emissions change when the issuer's emissions do not?
Financed emissions move with the denominator and the calendar as well as with emissions. Four effects are routine, and none of them is a change in what the company emits.
The first is EVIC itself. When an issuer's share price rises, EVIC rises; a bondholder whose holding value is unchanged now finances a smaller share of the company, so its financed emissions fall. On the illustrative issuer, a 20% rise in market capitalisation lifts EVIC from $14.9 billion to $16.86 billion, and a fixed bond position's financed emissions fall by about 12%. A shareholder's position rises with the price, so its effect is muted; the same market move therefore pushes a bond book and an equity book in different directions.
The second is the averaging date. The PAI statement averages each impact over the four calendar quarter-ends (RTS 2022/1288, Article 6), so a position bought in November contributes a quarter of a year's weight, whatever its size at year-end. The third is currency: holdings and EVIC must be in one currency at one date. The fourth is the data year. Because emissions are published a year or more after the year they describe, the ECB applied 2024 emissions to its 2024 and 2025 holdings, and warns that past data "artificially stabilises the reported metrics" (ECB, June 2026).
A calculation that shows all four, the EVIC date, the averaging dates, the currency and the emissions year, lets a reader separate decarbonisation from arithmetic. One that shows only the total invites the wrong conclusion in either direction.
What the calculation needs from the data team, issuer by issuer
Six inputs to have, and show, for every issuer in the calculation
- The emissions figure, by scope, with its page
Reported or estimated, and which; a reported figure from the issuer's own report, with the table it came from.
- The fiscal year of that figure
A March year-end mapped to a calendar year by a written rule, the same rule every year.
- The boundary
Consolidated group or parent only. The two can differ, and the template should say which it carries.
- The Scope 2 method
Location-based or market-based, named; ESRS asks issuers to disclose both.
- EVIC at the matching fiscal year-end
Built from market capitalisation, preferred shares, total debt and non-controlling interests, cash not deducted.
- The data-quality score and why
Verified, reported or estimated, so the share of the book on each can be shown beside the total.
The first four lines are extraction work and the reason the calculation is only as good as the reading behind it. Scope 2 alone shows why: the sample issuer reports 642,180 tCO₂e location-based and 608,310 market-based for the same year, and a template that does not say which it carries has two possible answers. How the data-quality score is decided covers the sixth.
How ESG Data Extraction feeds the financed emissions engine
The solution does not replace a firm's financed-emissions engine; it supplies the emissions inputs that engine is short of. Agents find the issuer's report, read every emissions table twice, convert units and fiscal years by the template's rules and propose the data-quality score; an analyst confirms and a steward approves. On approval, the figures load to the financed-emissions engine, which takes EVIC from portfolio accounting, and every value is read back.
One cell in the ESG template, traced to its page in ESG Data Extraction
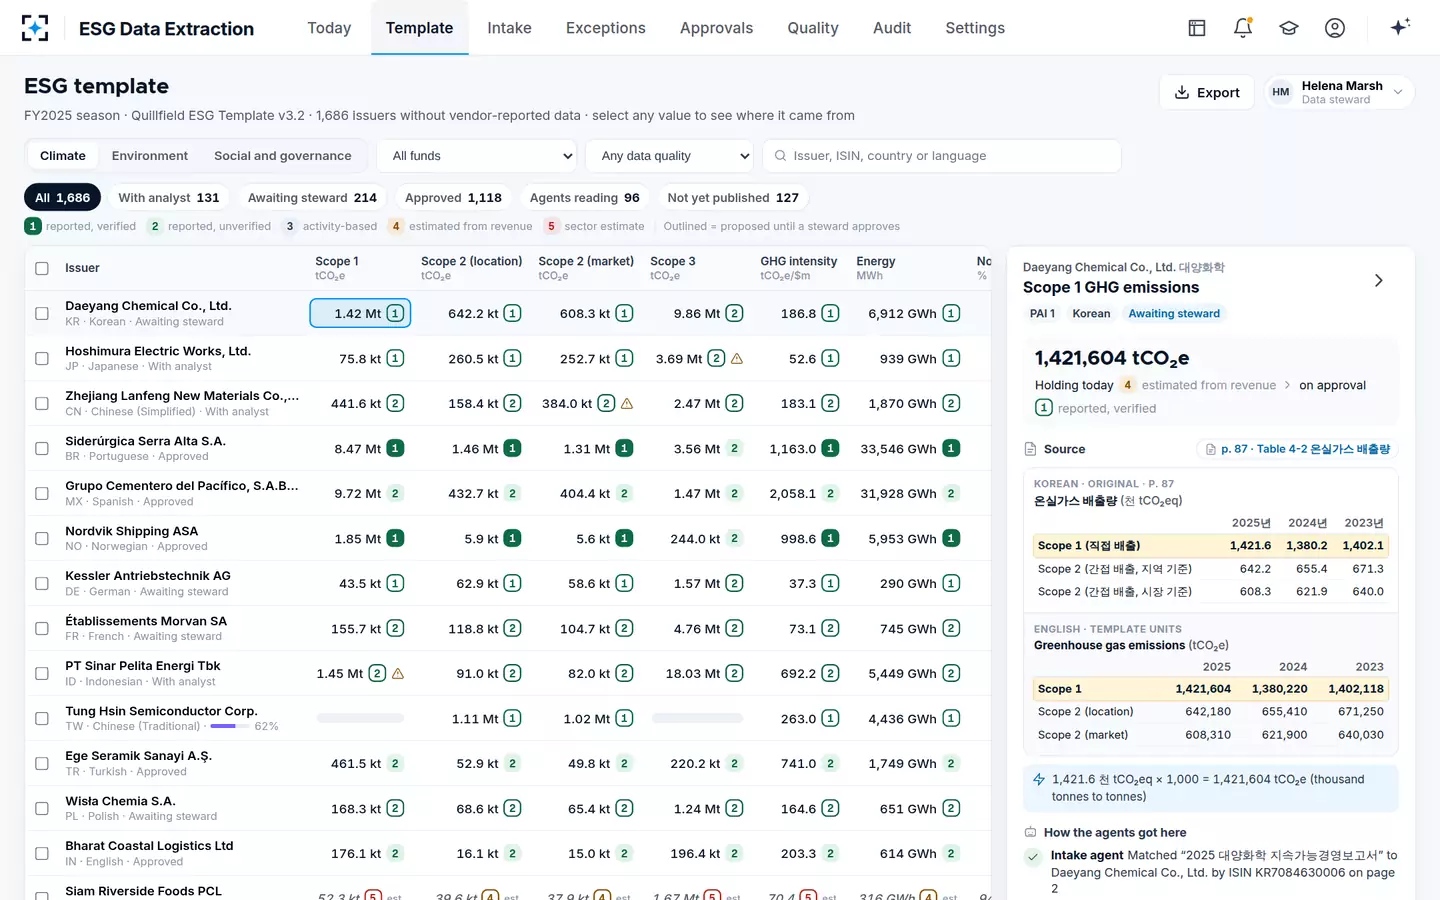
Across the sample season, those approvals moved 88% of the listed book's financed emissions onto reported data, up from 71% at the start, sample results rather than a customer's. The formula did not change; the inputs did. For the supply side of the same arithmetic, buying estimates or reading reports sets out the costs, and the rest of the solution is at ESG Data Extraction.
Questions people ask
What is the difference between EVIC and enterprise value?
EVIC keeps cash in; the usual enterprise value deducts it. The SFDR regulation defines its enterprise value "without the deduction of cash or cash equivalents", so for PAI purposes the two terms mean the same thing. On a cash-rich issuer, using enterprise value net of cash would overstate financed emissions.
Do you use the market value or the nominal value of a bond?
The SFDR regulation says "current value of investment", the value in euros of the investment, which points to market value for the PAI statement. The ECB, for its own monetary policy portfolios, calculates its metrics using bonds' nominal values. Whichever a firm uses, it should say so and use it consistently.
Should financed emissions include the investee's Scope 3?
For the PAI statement, yes: indicator 1 lists Scope 3 GHG emissions of investee companies. IFRS S2 also asks asset managers for financed emissions by Scope 1, 2 and 3. Show it separately from Scopes 1 and 2, as the ECB does, because its data quality is lower.
How are financed emissions calculated for sovereign bonds?
EVIC does not exist for a country, so the attribution uses another denominator. The ECB attributes sovereign emissions by PPP-adjusted GDP, while the current SFDR regulation's sovereign indicator is a GHG intensity per unit of GDP; the ESAs note their recommendation to use PPP-adjusted GDP has not been adopted.
What if an issuer does not report its emissions?
Then the calculation uses an estimate, and the PAI statement must describe the best efforts made to get the data, from the issuer directly, by additional research, from data providers or by reasonable assumptions. An estimate should never become a zero; the ESAs' 2025 review criticised firms that assigned a 0 where data was missing.