The PCAF data quality score is a five-point rating of the emissions data behind each holding in a financed-emissions calculation, from 1 for verified emissions the company itself reported to 5 for an estimate built from sector averages. It comes from the financial industry's carbon accounting standard, written by the Partnership for Carbon Accounting Financials, and European banking supervisors reproduce its table in their own guidance. A manager moves a holding from estimated to reported by replacing a vendor's revenue-based estimate, a score of 4, with the issuer's own figure, a 1 or 2. For the small-cap and emerging-market part of a book that means reading reports by hand, and that is the work Botminds' ESG Data Extraction gives to agents, each figure cited to its page and approved by two people before the score moves.
The season-level examples come from sample data on a fictional asset manager, Quillfield Capital, and its 1,686 issuers without vendor-reported emissions, as they run through the solution. The score definitions and the research are linked where they appear.
One season of reading reports: the gap issuers by data-quality score, start and today
What is a PCAF score? Five grades of emissions data
A PCAF score grades where the emissions number behind a holding came from, not how high or low it is. A 1 means the company reported its emissions and someone verified them; a 5 means the investor had nothing company-specific and multiplied a sector emission factor by the company's assets. The scores in between move from the company's own unverified figure, through emissions computed from its energy use or production, to estimates from its revenue.
The score is a convention of the financial industry rather than a legal requirement, but regulators have built on it. The European sustainability reporting standards tell a financial institution measuring its Scope 3 to "consider the GHG Accounting and Reporting Standard for the Financial Industry" from PCAF, "specifically part A 'Financed Emissions'" (ESRS E1, AR 46). The ECB's banking supervisors set out the table in their 2022 report on climate stress testing, and asked banks without actual data to develop proxies in line with PCAF guidance (ECB Banking Supervision, December 2022).
The PCAF data quality score table, as supervisors reproduce it
The table distinguishes three options and five scores. Option 1 uses the company's reported emissions, verified (score 1) or not (score 2). Option 2 calculates emissions from the company's own physical activity data, energy consumption (score 2) or production (score 3). Option 3 estimates from economic activity: revenue (score 4), or assets and asset turnover (score 5).
The PCAF data quality score table for business loans and unlisted equity
| Score | Option | When it applies |
|---|---|---|
| 1 | Reported emissions (1a) | Outstanding amount and total equity plus debt known; "Verified emissions of the company are available." |
| 2 | Reported emissions (1b) | "Unverified emissions calculated by the company are available." |
| 2 | Physical activity, energy (2a) | Reported emissions not known; calculated from the company's primary energy-consumption data and specific emission factors. |
| 3 | Physical activity, production (2b) | Calculated from the company's primary production data and specific emission factors. |
| 4 | Economic activity, revenue (3a) | The company's revenue known; "Emission factors for the sector per unit of revenue are known". |
| 5 | Economic activity, assets (3b, 3c) | Only the outstanding amount known; sector emission factors per unit of assets, or per unit of revenue with asset-turnover ratios. |
The ECB adds the reason for the ranking in one line: "Options 1 and 2 are preferred over Option 3 from a data quality perspective since they provide more accurate emissions results." The ISSB says the same thing in the language of a standard. IFRS S2 asks a company measuring Scope 3, which for an investor includes financed emissions, to prioritise "data based on direct measurement", "data from specific activities within the entity's value chain" and "data that has been verified" (IFRS S2, B40). A score of 1 is the PCAF name for data that meets all three.
PCAF score 4: what a revenue-based estimate is, and what it is not
A score of 4 means the emissions figure was produced by multiplying the company's revenue by an average emission factor for its sector. It is a reasonable placeholder. It is not a measurement of that company, and research shows the difference is systematic rather than random.
An estimate tracks the company's finances; a reported figure tracks its plants
Score 4: estimated from revenue: Revenue times a sector factor. Revenue up, emissions up.
Score 1 or 2: the company's own figure: Fuel burned, processes run, electricity bought, as the company measured them.
Score 4: estimated from revenue: Efficiency, fuel switching, a plant closure, a process change.
Score 1 or 2: the company's own figure: Less: it reflects what the company measured, though its Scope 3 may still be partly estimated.
Score 4: estimated from revenue: Vendor estimates differ from disclosed emissions in a consistent direction and track financial size (Aswani and co-authors, 2024).
Score 1 or 2: the company's own figure: "Third-party estimations are less consistent as compared to data stemming directly from corporate reports" (Busch and co-authors, 2022).
Score 4: estimated from revenue: Daeyang Chemical, Scope 1: 1.18 million tonnes.
Score 1 or 2: the company's own figure: Daeyang's Korean report, page 87: 1,421,604 tCO₂e, limited assurance covering it.
The first finding has an uncomfortable implication for anyone using estimates to steer a portfolio. If estimated emissions move with revenue, a portfolio tilted toward low estimated emissions is partly tilted toward smaller or slower-growing companies, and a reported decline in financed emissions may be a decline in the revenue of the issuers held. Only reported figures break that link.
The ECB's own disclosures add a second hazard: estimates and their providers change. It lists the quality issues behind its corporate data as "(i) intrinsic estimation uncertainty, (ii) diverging estimates between different data providers, and (iii) methodological refinements throughout time", and describes a case in which an issuer reclassified part of a rise in Scope 1 as Scope 3 in its 2025 report, a change the climate data provider did not pick up because of how its method works (ECB, June 2026). An investor reading the report would have seen it.
PCAF score 1 vs 2: verified, unverified, and who decides
The difference between 1 and 2 is verification: both are the company's own reported figure, and a 1 has been verified. The table does not define what counts as verification, so each firm has to write its own rule, and the rule matters because limited assurance, the level EU law keeps for sustainability reporting after the 2026 Omnibus directive, gives substantially less assurance than a reasonable-assurance engagement.
The sample template's rule is explicit: a figure scores 1 when "signed limited or reasonable assurance that covers the figure" exists, and a reported figure outside that scope scores 2. The phrase that does the work is "covers the figure". An assurance statement may cover Scope 1 and 2 and leave Scope 3 out, or cover only some sites; in the sample, Daeyang's Scope 1 and 2 score 1 while its Scope 3, 9.86 million tonnes, scores 2 because the statement does not reach it. How to read an assurance statement's scope is covered in its own guide.
Why the average score is not the measure that matters
An average score across issuers can improve while the book barely moves. Reading the reports of a hundred small holdings raises the average a long way; reading one large emitter's report may change financed emissions more. The useful measure weights each score by what the holding contributes.
Three ways to measure the same season, and why the third is the one to report
4.3 → 2.4
average score across the 1,686 gap issuers, start to today
0 → 1,100+
gap issuers on reported data, score 1 or 2
71% → 88%
share of the listed book's financed emissions on reported data
The emissions-weighted share answers the question a reader of the financed-emissions total would ask: how much of this number is measured? It is also close to what the supervisors recommend. Reviewing PAI statements in 2025, the European supervisory authorities pointed to a best practice: show what share of investments is covered by data, and separately what share of it is estimated (ESAs, JC 2025 26). A score distribution weighted by value or by emissions is that disclosure in one chart.
Five measures that show a book really moved from estimated to reported
Measures that can be tested, behind a score that is a convention
- Share of financed emissions on scores 1 and 2
Weighted by emissions, by scope, with Scope 3 shown on its own line.
- Share of reported figures inside an assurance scope
Counted figure by figure from the statements, not issuer by issuer.
- Reported-versus-estimate gap, by issuer
The distribution of differences between the vendor's estimate and the issuer's figure; a large gap is a reason to check the reading, then the estimate.
- Unit and boundary corrections caught before publishing
How many figures needed a conversion or a boundary choice, and how many of those a person changed.
- Coverage per PAI indicator
Reported, estimated and not disclosed, separately; never a zero for missing data.
The last item guards against the error supervisors found most clearly. The same 2025 review observed firms reporting zero for several indicators wherever they lacked data. A zero improves every portfolio figure it touches and has a data quality of nothing at all. A template that cannot store "not disclosed" will eventually produce one.
How to improve a PCAF data quality score without gaming it
There is one honest way to move most holdings from 4 to 1 or 2: read the issuer's report. The SFDR regulation lists the routes a firm must report when data is not readily available: asking the investee company, doing more research, turning to data providers or outside experts, or making reasonable assumptions (RTS 2022/1288, Article 7). Of those, only the first two produce company-specific figures. The ECB's banking supervisors put the order plainly: institutions "should engage in the retrieval of actual data and encourage counterparties to disclose GHG emissions", and develop proxies only where "it is impossible to retrieve actual data" (ECB Banking Supervision, December 2022).
Three habits keep the improvement real. Score each scope separately, because a verified Scope 1 says nothing about Scope 3. Re-read restated reports, because a restatement can move a figure and its score in either direction. And keep the vendor estimate beside the reported figure, not instead of it: a reported figure that differs sharply from the estimate is worth a second look before it is published, and a reported figure that matches it exactly is worth one too.
What does not count is relabelling. A figure the vendor took from the company's report is reported data, but only if the year, boundary and scope match what the company published; a vendor figure marked "reported" that the company restated last month is not. The way to know is to have the page.
Moving 1,686 issuers in one season with ESG Data Extraction
In ESG Data Extraction an assurance agent reads each issuer's assurance statement and proposes a score for each scope; it never moves a score itself. The score on the holding changes only when a steward approves the issuer, after an analyst has confirmed the figures. The quality view recalculates after every approval.
The data quality view in ESG Data Extraction, recalculated after every approval
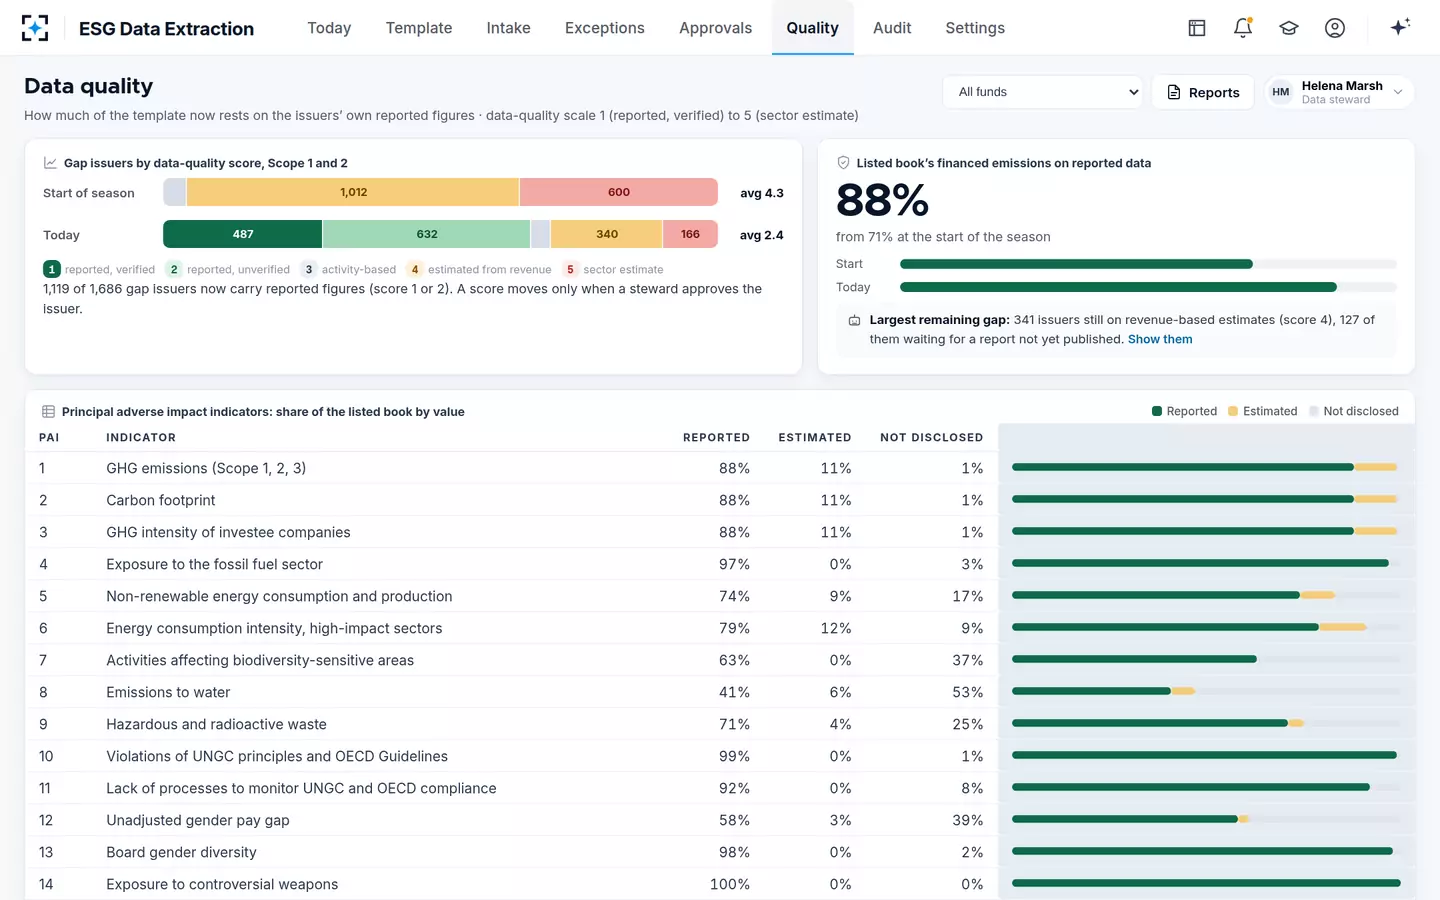
The score moves on a steward's approval, with the cited figures and the analyst's confirmation
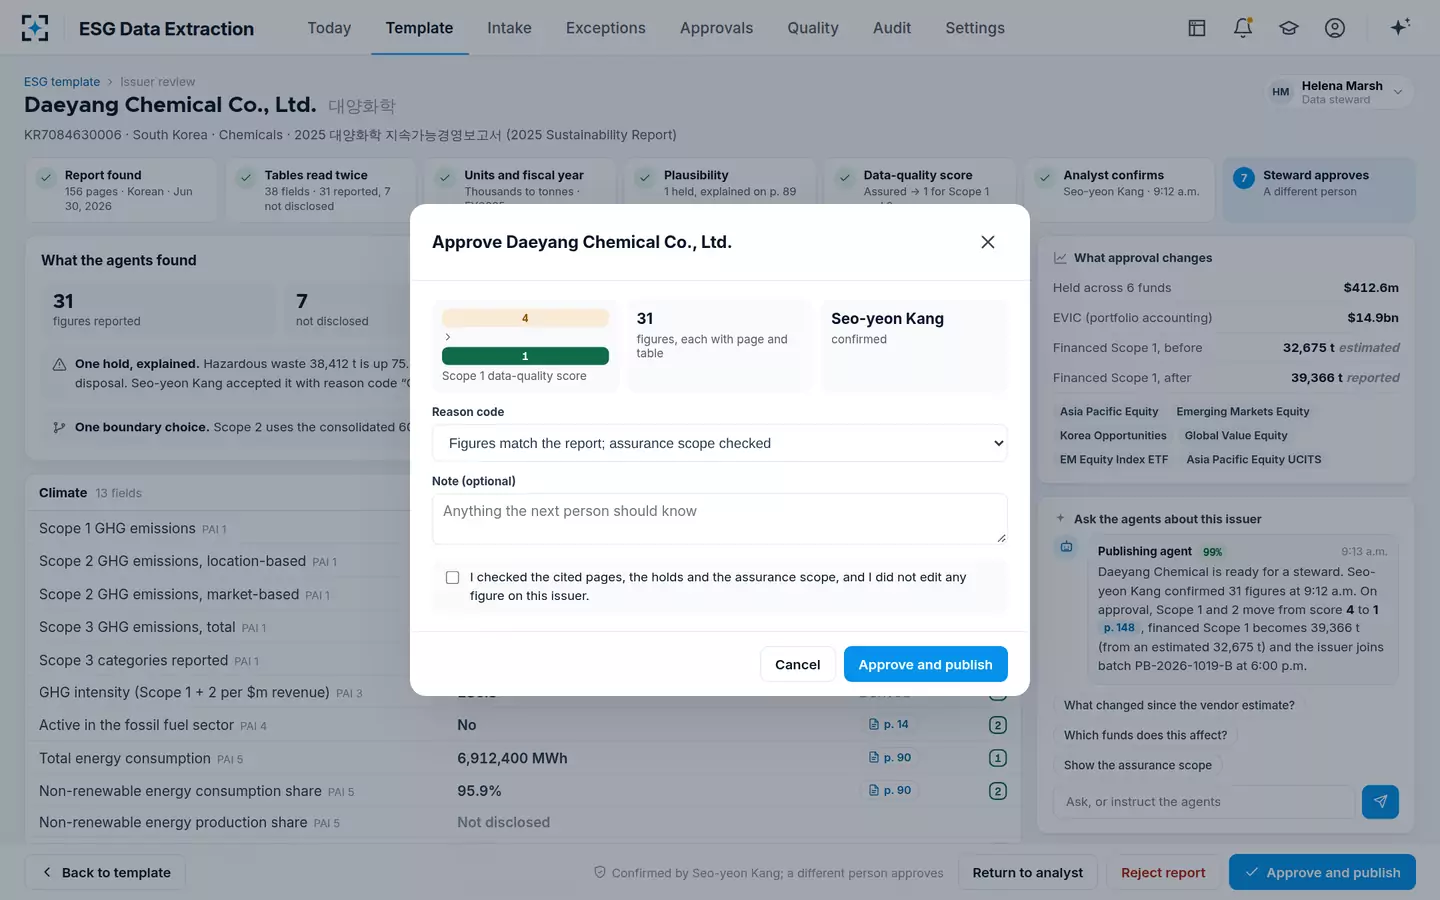
What the solution changes is the rate at which reports get read, not the scale. The PCAF table stays the firm's convention; the agents supply the cited figures that let a holding climb it. For the arithmetic each score feeds, see the financed emissions calculation, and for the solution, ESG Data Extraction.
Questions people ask
What is a good PCAF score?
Lower is better: 1 is the highest data quality and 5 the lowest. There is no regulatory threshold for a portfolio average. A more useful target is the share of financed emissions on scores 1 and 2, shown by scope, because that tells a reader how much of the total is measured rather than modelled.
Is the PCAF score mandatory?
The score itself is an industry convention. ESRS tells financial institutions to consider PCAF's financed-emissions standard when measuring Scope 3, and IFRS S2 requires companies to prioritise verified, company-specific data, so the logic behind the score is built into the standards even where the scale is not.
Does limited assurance make a figure score 1?
Only if the firm's rule says so and the assurance covers that figure. The PCAF table asks for verified emissions without defining verification; the sample template counts signed limited or reasonable assurance that covers the figure. A Scope 3 figure outside the assurance scope stays at 2.
Can a holding go from score 4 to score 2 without a sustainability report?
Yes, in principle: the PCAF table gives a score of 2 to emissions calculated from the company's own energy-consumption data with specific emission factors. In practice that data usually comes from the same report, or from asking the company directly.
How often should scores be updated?
Whenever the underlying figure changes: a new report, a restatement or a new assurance statement. In ESG Data Extraction the quality view recalculates after every approval, so the score distribution is current at any point in the season.