Annual report analysis with AI, for an ESG data team, means having a model find and read the figures your template needs in issuers' annual, sustainability and integrated reports, with each value tied to its page. The way to find out whether a tool can do it for your book is not a demonstration on a report the vendor chose; it is a pilot on last season's reports, the ones your analysts already keyed and your firm already published. Run them through the tool, compare every field with the published value, decide each disagreement by opening the page, and measure the result against pass marks agreed before the pilot starts. Botminds' ESG Data Extraction includes exactly that back-test, on issuers your analysts already did by hand, before it goes live.
The plan below is our suggestion, built on the published tests of LLM extraction from sustainability reports and on what supervisors look for. Product examples use sample data on a fictional asset manager, Quillfield Capital.
An eight-week pilot: most of the time is comparing, not running
- Choose the sample, freeze pass markswk 1
- Load template rules, run the reportswk 2–3
- Compare field by field, adjudicatewk 4–6
- Time the analysts, score, decidewk 7–8
What does annual report analysis with AI actually do for an ESG data team?
It finds the tables, reads the figures and proposes them with their sources; people decide what is published. For an ESG template that means Scope 1, 2 and 3 emissions, energy, water, waste, the gender pay gap and board diversity, each with a unit, a fiscal year, a boundary and a page. The value is not a summary of the report; it is a filled row the analyst can confirm in minutes instead of building in hours.
Firms are already using models for adjacent work. ESMA's 2026 analysis of AI use in securities markets counted drafting and summarising as the largest group, 239 of the use cases it found, ahead of internal assistants (227), with translation (95), data quality and processing (105) and code generation (109) further back (ESMA, TRV risk analysis, February 2026). Extraction into a regulated template sits closest to data quality and processing, and it carries the strictest test: the output is a number someone signs.
Why pilot on last season's reports instead of a demonstration?
Because last season is the only set of reports for which you already hold an answer for every field, chosen by your analysts under your rules. A vendor's demonstration shows that the tool can read a report; a back-test shows how often it reads yours the way your firm would, and where it does not.
Last season also contains the hard cases a demonstration avoids: the Korean report with a header in thousands of tonnes, the Japanese company with a March year-end, the scanned annual report, the issuer that restated. The published tests show those are where models fail. In Project Gaia, a central-bank test on 187 financial institutions' reports, the errors came from "overly complicated table structures", reports whose "total emissions" left out Scope 3, and years with no value, where the model "incorrectly reported the value for the last available year" (BIS, Project Gaia, March 2024). A pilot sample without those cases measures the easy part.
How many reports does an AI extraction pilot need?
Enough fields, in each kind of report that matters, to see the error rates you care about. For a template of about 38 fields, 50 to 80 issuers gives 2,000 to 3,000 field comparisons, which is enough to estimate an overall error rate to within about half a percentage point and to see whether errors cluster in one language, one field or one report type.
Design the sample before you see a single result
- Stratify by language and script
Include every language that matters to the book, not just English editions; the header is where scale errors start.
- Include each report type
Sustainability, annual and integrated reports, and at least a few scanned documents.
- Include the awkward cases on purpose
March year-ends, parent-only tables beside consolidated ones, restatements, figures only in charts.
- Weight toward what is material
The issuers that drive the funds' financed emissions and PAI figures, not only the convenient ones.
- Freeze the template rules
Units, fiscal years and boundaries written down before the run, so the tool and the analysts are judged against the same rules.
- Set the pass marks in writing
Agreed by the people who will sign, before anyone sees a result.
Random selection inside each stratum keeps the result honest. Gaia's own manual check drew "a random set of 163 examples"; a pilot that hand-picks issuers will be told what it wanted to hear.
How to test AI data extraction: compare field by field, then open the page
Compare every extracted field with the value your firm published for the same issuer and year, and treat every difference as a question, not an error. The published value is the analyst's reading, not the truth. Some differences will be the tool's mistakes; some will be your analysts'; some will be a rule nobody wrote down. Only the page decides.
The pilot scorecard: what to count, and what each count tells you
| Measure | How to count it | What it tells you |
|---|---|---|
| Agreement | Fields where tool and published value match, after units are aligned | The share of the template the tool reads as your analysts did |
| Tool errors | Disagreements where the page supports the published value | The raw error rate, by field, language and report type |
| Published errors found | Disagreements where the page supports the tool | Mistakes already in last season's statements |
| Rule gaps | Disagreements where both readings are defensible | Template rules that need writing down |
| Scale errors | Values right in their digits but wrong by a factor of 10 or more | The error class that moves a fund's figures most |
| "Not disclosed" accuracy | Fields the tool left empty, checked against the report | Whether the tool guesses where it should say no |
| Residual errors | Tool errors that would have survived its own checks and reached approval | The number that matters for the signer |
| Analyst minutes per issuer | Timed, including confirmation and exceptions | The cost line for the business case |
Count scale errors on their own line because a supervisor would. The ESAs' 2025 review of PAI statements found CO2 reported instead of CO2 equivalent, a statement in US dollars instead of euros and zeros entered where data was missing (ESAs, JC 2025 26). Those are the errors a tool must not add and should help remove; a pilot that finds some in last season's published figures has already earned its keep.
What accuracy is good enough for AI extraction?
Judge the residual error, the mistakes that would reach an approved value, not the model's raw accuracy. A tool that reads 80% of fields right on its own is not usable if the other 20% pass silently; one that reads 80% right and sends nearly all of the rest to a person, with the page, may be. The pass mark belongs to the design, not the model.
Published tests give a sense of the raw rate on sustainability reports. Gaia's manual check found 79.8% of extracted values correct, and confirmed 98.3% of its "not found" answers. A peer-reviewed study of airline sustainability reports found accuracy rose "from below 30% to above 70%" once the prompts named the KPIs explicitly (Martín-Domingo et al., 2025). Those numbers say that raw accuracy is good enough to be worth checking and nowhere near good enough to skip the check.
So the pass marks we suggest are about the system. Every value cited to a page and table. No scale error in an approved value. No zero where the report said nothing. Residual errors below the rate your analysts achieve by hand, measured on the same sample. And analyst minutes per issuer low enough to change the season's staffing. A firm can be stricter; it should not be vaguer.
Five ways an AI extraction pilot can mislead you
A pilot can be designed, without anyone intending it, to pass. The usual ways are an easy sample, a bar set after the results and a comparison with something other than the source. Each has a simple counter.
A pilot that proves something, against one that only demonstrates
A pilot that misleads: Reports the vendor suggested, or the issuers with English editions.
A pilot that proves something: A random draw inside each language and report type, including scans and March year-ends.
A pilot that misleads: A data vendor's values, or last season's spreadsheet taken as truth.
A pilot that proves something: Last season's published values, with every disagreement decided against the page.
A pilot that misleads: Agreed after the first results, or an overall accuracy figure alone.
A pilot that proves something: Written before the run, by field class, with scale errors and "not disclosed" counted separately.
A pilot that misleads: Changed during the pilot to fix individual misses.
A pilot that proves something: Frozen for the run; any rule change is noted and the sample re-run.
A pilot that misleads: The tool's processing time.
A pilot that proves something: Analyst minutes per issuer, including confirmation and exceptions, timed by the people who will do the work.
The answer-key row matters most, and the central banks' own experience speaks to it. When Gaia's team compared its values with commercial data sources, it found that "in a significant portion of the sample, there are inconsistencies between the values reported by different commercial data sources" (BIS, Project Gaia). A pilot scored against one of those sources inherits its errors and calls them the tool's.
What the central banks' test teaches about benchmarks
Project Gaia benchmarked at three levels, and the gap between them is the lesson. Against the Task Force on Climate-related Financial Disclosures' own analysis of banks, Gaia's share of institutions reporting all three scopes was "in line with" the task force's findings. Against three commercial data sources, its Scope 1 values matched at least one of them in 74% of the cases where external data existed, and the sources themselves often disagreed. Only the manual check, a person against the report, measured accuracy.
Three ways the central banks benchmarked one extraction tool
47%
of institutions reported all three scopes, by Gaia's data, in line with the task force's 40–58%
74%
of Scope 1 values matched at least one of three commercial data sources
79.8%
of extracted values were correct against a human's manual check
For a buyer the implication is direct. A vendor who benchmarks its extraction against another vendor's data set is measuring agreement between two products. The pilot should benchmark against the reports, through your own analysts' adjudication, because that is what a supervisor or auditor will do when they ask where a published figure came from.
What regulators will ask about the AI you use
Regulators have said they will look at how firms use these tools, and they have not created a special standard for them. The SEC's Division of Examinations, in its priorities for fiscal 2027, uses its own term, "super intelligence (SI)", and lists where registrants already apply it: research, drafting, coding and client communications, advisory and portfolio management work, and compliance monitoring (SEC, FY2027 examination priorities, October 23, 2026). Extraction of reported figures sits inside the first and the last of those.
The Division says it will check whether firms continue to meet their existing obligations, which do not depend on the technology. ESMA said the same for the EU in 2024: a firm's management body answers for its decisions whether people or AI tools took them (ESMA, May 30, 2024). A pilot that leaves a written method, a sample, pass marks and adjudicated results is the first piece of evidence that a firm took that responsibility before it relied on the tool.
After the pilot: keep the sample as the golden set
The adjudicated sample is worth more after the pilot than during it. Every field in it has a value a person confirmed against the page, which makes it a test set for every later change: a new model, a new template version, a wider outlier band. Without it, each change is judged on faith.
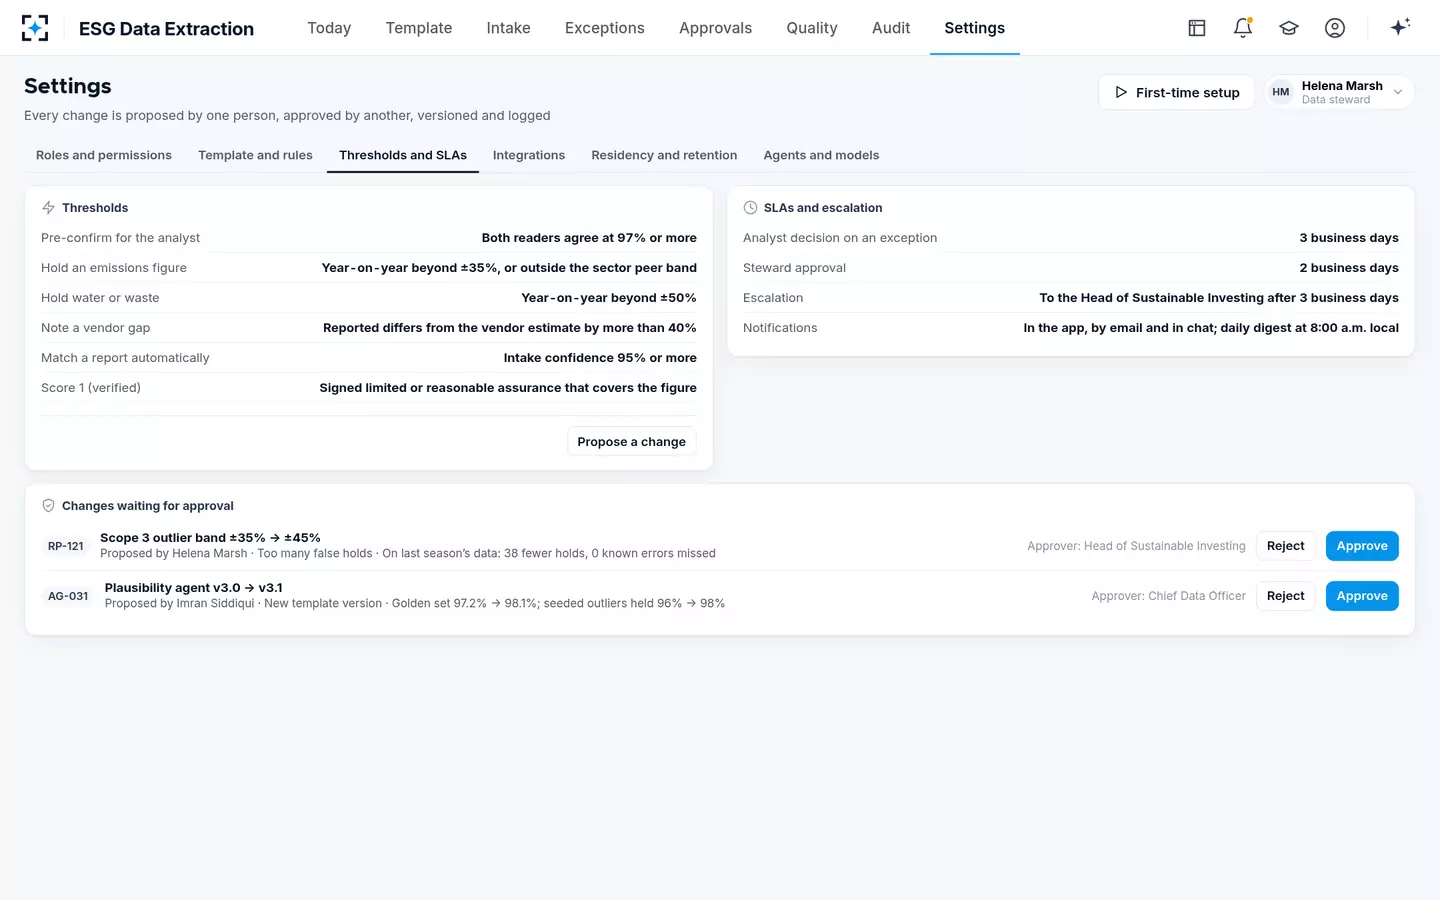
In ESG Data Extraction that is how changes are approved. Agent and model changes go to the Chief Data Officer, tested against a golden set of 1,200 figures; on the sample data, a proposed new version of the plausibility agent shows its result on that set, 97.2% to 98.1%, and on seeded outliers held, 96% to 98%, before anyone approves it. Threshold changes are tested on last season's data the same way: widening the Scope 3 outlier band from ±35% to ±45% would have meant 38 fewer holds and no known errors missed.
Changes in ESG Data Extraction are tested on last season's data before approval
Running the pilot in ESG Data Extraction
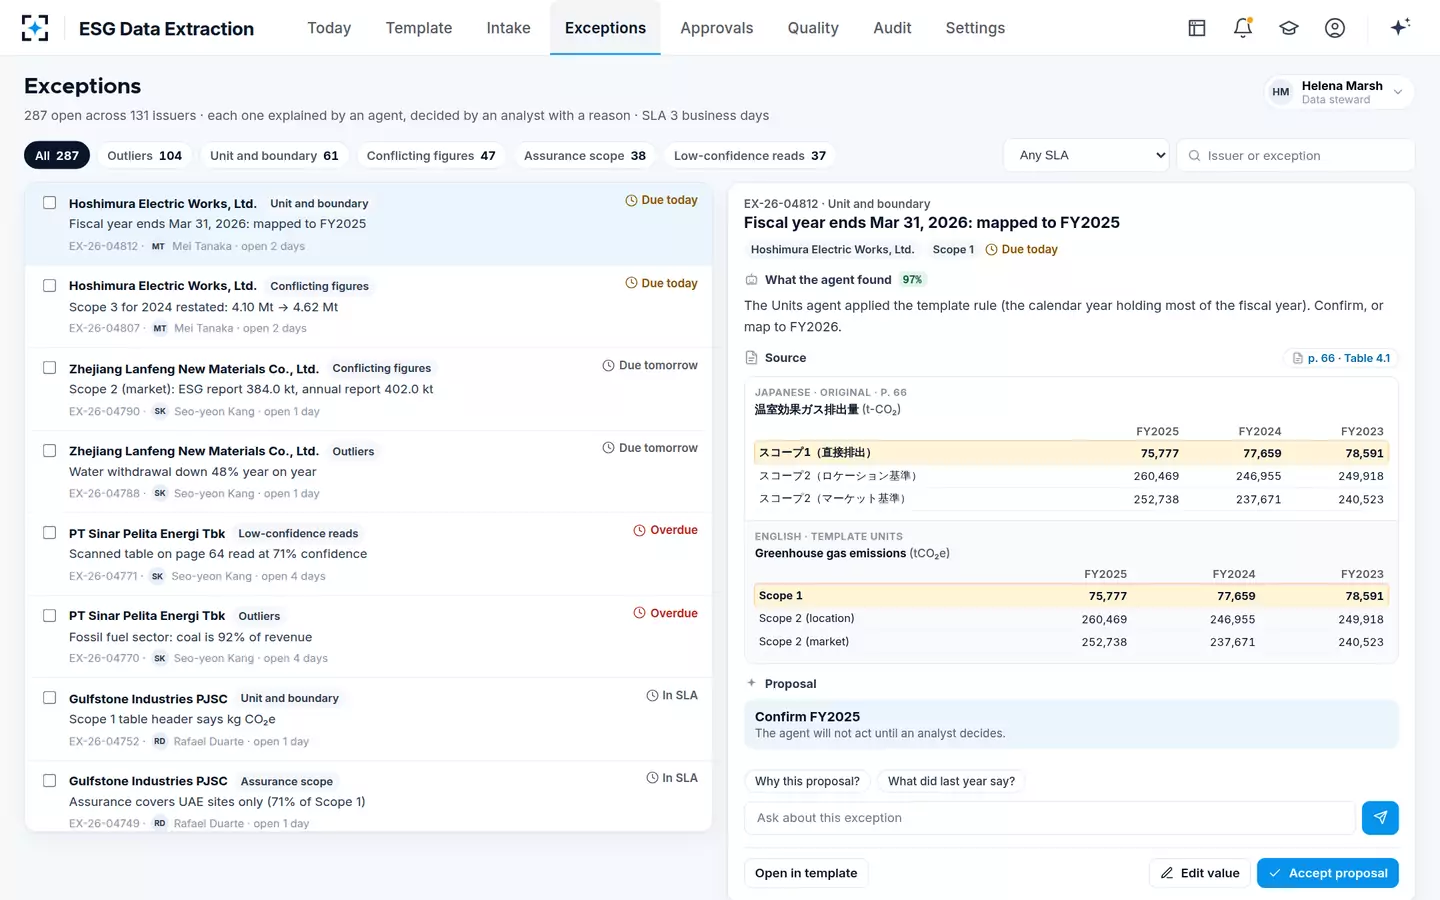
The pilot uses the same screens as the live season. Reports are matched at intake; the extraction agent and a blind second reader read every table; the units agent applies the frozen template rules; the plausibility agent compares each figure with last year, peers and the vendor estimate; disagreements and holds land in the exceptions queue with both readings and the page. The pilot team works that queue exactly as analysts will, which is also how the analyst-minutes line gets measured.
The exceptions queue the pilot team works, as analysts will in season
Everything the pilot produces stays in the audit trail: each reading with its agent's version, each decision with its reason code and person. That trail is the evidence for the go-live decision and the starting point of the golden set. For what the tool should be judged on, see two readers, one table; for the cost side, buying estimates or reading reports; and for the solution, ESG Data Extraction.
Questions people ask
Can ChatGPT analyse an annual report?
It can read one and answer questions about it, and for a single company that may be enough. For a template filled across a book, the questions are different: does every value cite its page, does a second reading check it, are unit and boundary rules applied the same way every time, and who signs. A pilot tests those, not the model's fluency.
Should the pilot use English editions or the original reports?
The originals, where the book depends on them. English editions often arrive months later and sometimes differ; in the fictional sample, the Korean issuer's English report was not expected before December. A pilot on English editions alone will overstate accuracy for the holdings that need reading most.
What if the pilot finds errors in our own published figures?
Count them separately, decide each against the page, and treat them as a finding about last season's process rather than the tool's. They are often the strongest argument for change, and the corrected figures may matter for the next statement.
Who should approve the pass marks?
The people who will sign the figures in season: the data steward, the head of sustainable investing and the owner of the data warehouse. In ESG Data Extraction those roles approve rule changes and agent or model changes, so it makes sense for them to own the pilot's bar too.
How do we compare two tools fairly?
Same sample, same frozen template rules, same scorecard, and adjudication by the same people who did not know which tool produced which value. Compare residual errors and analyst minutes per issuer, not raw accuracy alone.