ESG data management software for an asset manager does three jobs: it sources issuer-level ESG figures, from data vendors and from the issuers' own reports; it controls them, so each figure is checked, scored and signed; and it delivers them to the systems that publish, such as the SFDR principal adverse impact statement, financed-emissions reporting and client reports. For large listed companies, vendor feeds supply most of the figures. For the small-cap, emerging-market and frontier holdings they do not, and there the decision is a cost decision: license a vendor's estimate, have analysts read each issuer's report by hand, or have agents read it and analysts confirm. Botminds' ESG Data Extraction is the third option. Vendors don't publish prices, so this page is a model the reader fills in with their own quotes and wage rates, with every assumption named.
The worked figures use sample data on a fictional asset manager, Quillfield Capital, Botminds' estimates of analyst time and one public wage statistic, each labelled as such.
The cost of a holding's figures, line by line, under three options
| Cost line | License the estimate | Read the report by hand | Read it with agents, confirm by hand |
|---|---|---|---|
| Data licence | Vendor fee, priced per firm; not published | Vendor feed still needed for the covered names | Same as by hand; estimates kept as comparisons |
| Analyst time per report | None | About 2.6 hours (Botminds' estimate) | About 0.5 hours (Botminds' estimate) |
| Second check | None by the firm | Usually a sample, for lack of time | A second reader on every table; a person on each disagreement |
| Data quality of the result | Score 4 or 5: estimated | Score 1 or 2 where the issuer reports | Score 1 or 2 where the issuer reports |
| Evidence for an auditor | The vendor's methodology note | Whatever the analyst saved | Page, table, readers, conversion and two signatures per figure |
| Software and setup | Feed integration | Spreadsheets and macros | Subscription and a pilot on past reports |
What should ESG data management software do for an asset manager?
It should turn issuer disclosures into figures the firm can sign, at the scale of the whole book. That breaks into sourcing (find the report, match it to the issuer), extraction (read the figure with its unit, year and boundary), control (second reading, plausibility, data-quality score, two-person sign-off), delivery (load to the warehouse and downstream systems and read back) and evidence (a log an auditor can follow from published number to page).
The rules it serves have become more specific, not less. The SFDR statement fixes the indicators, the units and the averaging dates (RTS 2022/1288). IFRS S2 asks asset managers to disclose financed emissions by scope and the share of assets under management included (IFRS S2, B61). And fewer issuers will be obliged to publish under the EU's standards after the 2026 Omnibus directive limited them to undertakings with "a net turnover exceeding EUR 450 000 000 and an average of more than 1 000 employees" (Directive (EU) 2026/470), so more of the long tail will report voluntarily, in its own format and language.
Buy, read by hand, or read with agents: three ways the long tail gets its figures
The three options produce different products, not the same product at different prices. A licensed estimate is a model of the issuer; a reported figure is the issuer's measurement. A procurement comparison that treats them as interchangeable will always pick the estimate, because its marginal cost per holding looks like zero.
The research says why they are not interchangeable. On US companies, "vendor-estimated emissions systematically differ from firm-disclosed emissions and are highly correlated with financial fundamentals" (Aswani, Raghunandan and Rajgopal, Review of Finance, 2024). Across providers, third-party estimates agree with each other less than figures taken from companies' own reports do, and Scope 3 agrees least of all (Busch, Johnson and Pioch, Journal of Industrial Ecology, 2022). Buying an estimate buys a number that depends on whose model produced it.
How much does ESG data cost? Build the model from four inputs
Vendors don't publish prices, and no regulator or independent study publishes what managers pay, so the honest answer is a model with four inputs: the number of reports a season, the analyst hours per report under each option, the loaded hourly cost of an analyst, and the licence and software fees from your own quotes. The first three can be measured in a week.
For the wage input, the nearest public statistic is the US Bureau of Labor Statistics' median pay for financial analysts, $103,570 a year in 2025 (BLS Occupational Outlook Handbook), about $49.79 an hour over 2,080 hours. That is pay, not cost: benefits, overheads and seniority sit on top, and ESG data roles are not counted separately. Use your own loaded rate.
One season of 3,040 reports: analyst hours by option
The arithmetic is simple and the point is not the totals, which any firm will replace. It is the shape: by hand, the reading cost scales with the number of reports and lands on the people who are scarcest in the season, the analysts who read Korean or Portuguese. With agents, the remaining hours are confirmation and exceptions, which scale with how messy the reports are rather than how many.
Where the analyst's half hour goes when agents do the reading
With agents
- Match · 10%
- Tables · 10%
- Fields · 20%
- Units · 10%
- Confirm, decide holds · 40%
- Load · 10%
Run the model on your own book: a five-line worksheet
The model fits on one page, and every line is something a team lead can measure or a procurement team can quote. Fill it twice: once for the segment of the book that needs reading, once for the whole book, because the answer for the long tail and the answer for the large caps are usually different.
A season's cost of the long tail, in five lines
| Line | How to get it | Sample input |
|---|---|---|
| 1. Reports to read | Issuers without vendor-reported figures × reports each (sustainability, annual, integrated) | 3,040 reports for 1,686 issuers |
| 2. Hours per report, by hand | Time ten reports your analysts already keyed, end to end, including the second check | 2.6 hours (Botminds' estimate) |
| 3. Hours per report, with the tool | The same ten reports in a pilot, counting confirmation and exceptions | 0.5 hours (Botminds' estimate) |
| 4. Loaded cost per analyst hour | Your own rate; the BLS median pay for financial analysts is a reference point, not a cost | $49.79 before overheads |
| 5. Licence and software fees | Your quotes; the vendor feed usually stays for the covered names | Not published |
Two adjustments make the worksheet honest. Count the reports that arrive late as well as the ones that arrive on time: in the sample, 127 of 3,040 were not yet published by mid-October, and each will need reading in a shorter window. And price the season's peak, not its average. Reports cluster in a few months, so the hand option's hours fall on a small team at the same time as its other deadlines; the cost of hiring or borrowing analysts for the peak belongs in line 4.
What the worksheet does not price is the value of the result: holdings that move from estimated to reported, figures that can be shown to an auditor page by page. Those belong in the decision, but as outcomes to verify in a pilot, not as savings to promise in a business case.
What an estimate costs after you have paid for it
The licence fee is the visible cost of an estimate; three others arrive later. The first is lag. Estimates are refreshed on the provider's schedule and methodology, and the ECB described a case where an issuer reclassified part of its Scope 1 increase as Scope 3 in its 2025 report, a change "not reflected by the climate data provider for methodological reasons" (ECB, June 2026). A firm that read the report would have had the corrected figure.
The second is supervisory. In their 2023–24 review of fund managers, EU supervisors found managers taking third-party ESG data without checking or reviewing it, and data that was at times incomplete or wrong (ESMA, common supervisory action, June 2025). A licensed estimate is still the firm's number once it is in the firm's statement.
The third is the gap that estimates hide. The ESAs' 2025 review of PAI statements found firms entering zero wherever data was missing, and recommended showing the share of investments covered by data separately from the share estimated (ESAs, JC 2025 26). Software that cannot hold "not disclosed" and "estimated" as distinct states will eventually produce a zero, and a zero improves every indicator it touches.
Should we buy ESG data or extract it ourselves? Decide holding by holding
Both, by segment. The question is not which vendor or which tool, but which holdings need which treatment, and the answer follows from where vendor-reported data exists and how much each holding contributes.
Which approach fits which part of the book
Where the licensed feed is enough: Large listed companies whose own reported figures the vendor already carries.
Where reading the issuer's report pays: Small caps, emerging and frontier issuers on revenue-based estimates.
Where the licensed feed is enough: Holdings whose estimate and report would barely differ.
Where reading the issuer's report pays: Holdings that are large in financed emissions or in a fund's PAI figures.
Where the licensed feed is enough: English reports in standard templates.
Where reading the issuer's report pays: Korean, Japanese, Chinese, Portuguese or Indonesian reports; March year-ends; parent-only tables.
Where the licensed feed is enough: Coverage at low marginal cost.
Where reading the issuer's report pays: A move from score 4 or 5 to 1 or 2, cited to the page.
The segmentation also sets the budget. In the sample, reading the gap issuers' reports moved 88% of the listed book's financed emissions onto reported data, from 71%, in one season. That is sample data, not a customer's result, but it shows the order of the prize: the long tail is many issuers and a minority of emissions, so a firm can decide how far down it goes by contribution rather than by count.
What to look for in ESG data management software
Ten capabilities to test in a demonstration, on your own reports
- Report intake across languages and sources
Filing feeds, issuer websites and uploads matched to issuers by ISIN, LEI or name in any script; restatements detected.
- Every value cited to page, table and cell
In the original language, opened in one click.
- An independent second reading
Blind to the first, by a different method; disagreements to a person.
- Written unit, fiscal-year and boundary rules
Versioned, owned by a named person, applied with the arithmetic shown.
- Plausibility checks with the issuer's own explanation
Against last year, peers and the vendor estimate; the tool finds the footnote, a person decides.
- Data-quality score by scope
Proposed from the assurance statement's scope; moved only on approval.
- "Not disclosed" as an answer
With the pages searched; never a zero.
- Two-person sign-off
Analyst confirms, a different person approves; the approver cannot have edited the figures.
- Loads with read-back and rollback
Every value read back from every target system; mismatches flagged, never retried in silence.
- A read-only audit trail
Who, what, when, why, the evidence and the software version, kept for your audit cycle.
ESG reporting and data management software: investor tools and company tools are different products
Searches for ESG reporting software return two kinds of product, and a buyer should know which one they need. Company-side tools help an issuer collect its own operational data and prepare its sustainability statement; investor-side tools turn many issuers' published statements into a portfolio's figures. The first faces inward, to meters and invoices; the second faces outward, to other companies' reports.
An asset manager preparing its own entity-level sustainability report needs the first kind, the territory of ESG Reporting. A manager filling a PAI template from investees needs the second. Some firms need both, and the evidence chain differs: a company proves its figure to its assurer; an investor proves that it read the company's figure correctly.
Where ESG Data Extraction fits in the stack
ESG Data Extraction sits between the issuers' reports and the systems a firm already runs. It does not replace the ESG data warehouse, the PAI engine or the financed-emissions engine; it loads approved figures into them. Vendor estimates, ratings and controversy data stay where they are, as comparisons under the firm's licences.
Loads to five systems, every value read back, every batch reversible
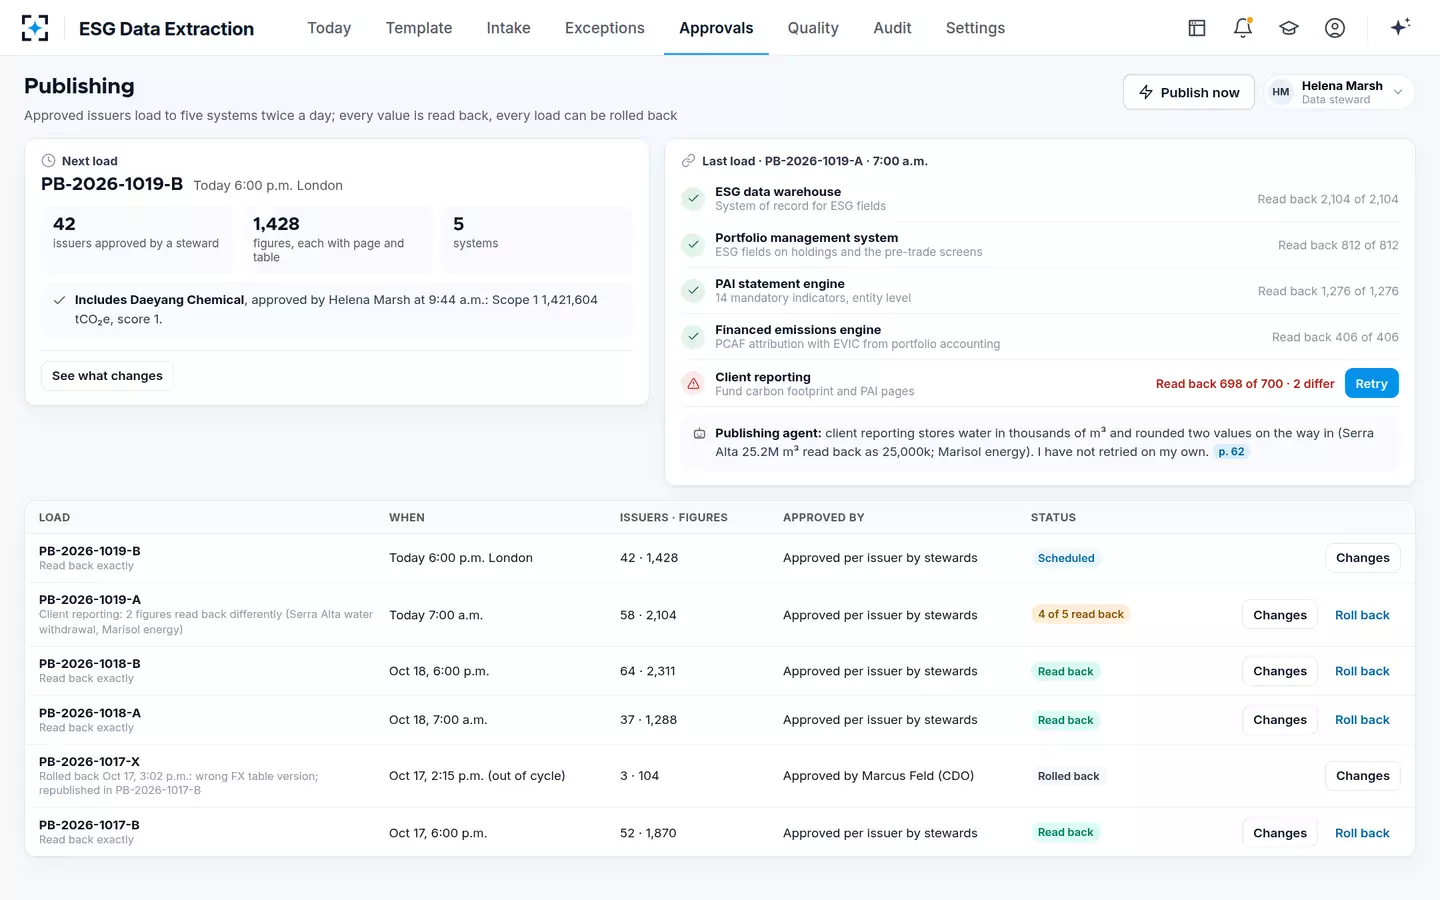
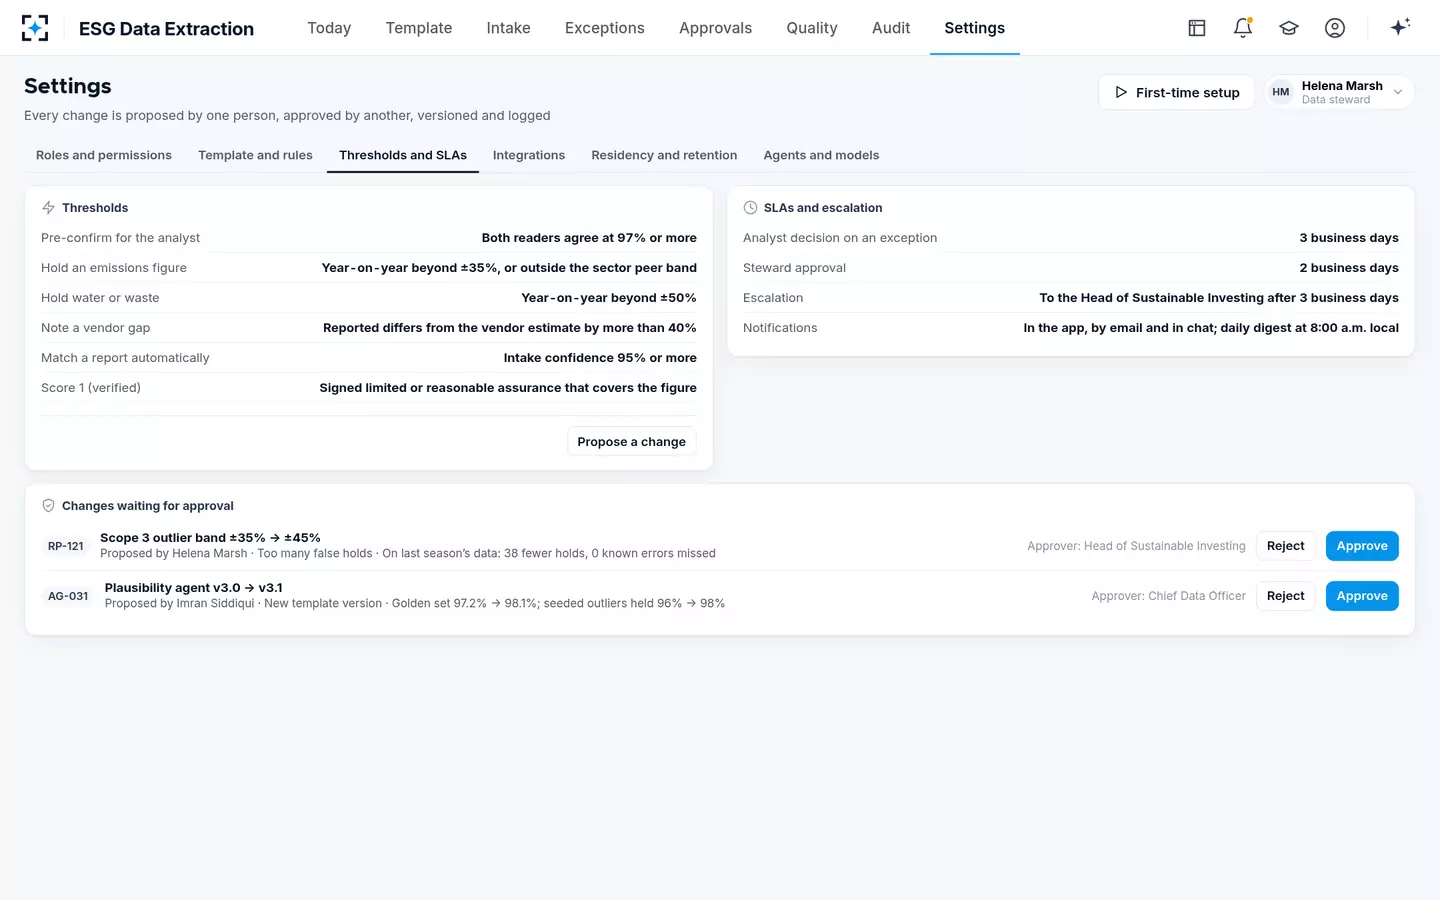
The thresholds that decide how much reaches a person are settings, proposed by one person and approved by another. The pre-confirm level, the outlier bands and the matching confidence change the hours in the cost model directly, which is why they belong to named owners rather than to the tool.
ESG Data Extraction's thresholds and SLAs, with proposed changes waiting for approval
For the test that should precede any purchase, see piloting AI extraction on last season's reports; for the design of the reading itself, two readers, one table. The solution is at ESG Data Extraction.
Questions people ask
What is ESG data management?
For an asset manager, it is the sourcing, checking, scoring and delivery of issuer-level ESG figures to the systems that publish them: the PAI statement, financed emissions, client reports and the European ESG Template. It covers vendor data and issuers' own reports, and the controls that make a figure signable.
Do we still need an ESG data vendor if we extract reports ourselves?
Usually yes. Vendor feeds cover large listed companies efficiently and supply comparisons for the issuers you read yourself. Extraction is for the holdings where the vendor has only an estimate and the issuer has published its own figure.
How long does it take to see the cost difference?
One season. Time ten reports by hand and ten with the tool, on issuers your analysts already did, and multiply by the reports you expect. The hand figure in this model, about 2.6 hours a report, is Botminds' estimate and should be replaced with yours.
Can ESG data management software produce the PAI statement?
The statement needs a calculation engine and a narrative; the extraction layer feeds them. In ESG Data Extraction approved figures load to the firm's PAI engine and financed-emissions engine and are read back, while the statement itself is written by the people who sign it.
What does a pilot cost us in time?
The inputs are reports and values you already have: last season's reports for a sample of issuers and the figures your analysts keyed. The work is comparing field by field and deciding each disagreement; the plan in our pilot guide spreads it over eight weeks, with the pass marks agreed before the first report is read.