A market conduct exam sample size calculator starts from the NAIC Market Regulation Handbook's Acceptance Samples Table, which turns the number of files in a population into the number examiners review first: in the 2017 edition, 76 claim files for a population of 200, 105 for 1,000, 107 for 2,000 and 108 for 5,000, with slightly larger samples of 79 to 116 for other practices tested against a 10 percent tolerance. The same table says how many errors that first sample can contain before the examiners must draw a second, larger one, and for claims the answer is only two or three. So the number of files a company will pull, and the count of exceptions that will widen the exam, can be known before fieldwork. Botminds' Market Conduct Exam Management pulls each sampled file and tests it against the standards before submission, so the company knows the count before the examiner does.
The calculator below reproduces the handbook's table with the same statistics. Where the solution appears, the data is from a fictional sample exam; the table and the Florida samples are from the NAIC and the Florida Office of Insurance Regulation, linked where they appear.
"the first-stage sample is designed to rule out the possibility that a given error rate is above a specified threshold."
NAIC Market Regulation Handbook, 2017 edition, chapter 14, on the first-stage sample
How is a market conduct exam sample size set?
A market conduct exam sample size is set in two stages. The first-stage sample comes from the Acceptance Samples Table for the population's size and is tested at 95 percent confidence against a tolerance of 7 percent for claims or 10 percent for other practices. The handbook says these sizes "will produce a one-tailed lower 95 percent confidence limit of no more than 4.5 percentage points for claims, and 5 percent for non-claims." If the first sample cannot rule out an error rate at or above the tolerance, a second, larger sample is drawn to estimate the actual rate.
The design is a labour-saving device, the handbook says: in many instances a process is cleared on the small sample, and only those that cannot be cleared get the larger one. The table is a recommendation, not a rule. Examiners may choose larger samples for a critical process, and if they choose sizes significantly different from the table they should be prepared to justify them. Some states start with standard samples such as 50 or 100 files.
The market conduct exam sample size calculator
Enter the number of files in the population, the sample the examiners drew (or leave the table's recommendation), the number of exceptions you found and the kind of practice. The calculator returns the table's sample for that population, the probability the handbook uses for its decision, and the most errors the sample can carry before a second sample.
Market conduct exam sample size calculator (NAIC Acceptance Samples Table, 2017 edition)
Table’s first sample for this population
105 files
Chance of this few exceptions if the true rate were at tolerance
1.7%
Most exceptions before a second sample
2
Second sample?
No
Default: 1,391 homeowners claims closed without payment in a year (the fictional sample exam’s population), the table’s 105 files, and 2 exceptions.
Try the default and then change one number. With 105 files from 1,391 claims, two exceptions leave a 1.7 percent chance that a process at 7 percent produced so few, so the first sample clears it; a third exception pushes that above 5 percent and a second sample follows. Now set the sample to 79 files, the size the examiner chose in the solution's sample exam: two exceptions give 7.4 percent, and a second sample is already due. Smaller samples are less forgiving per error, not more.
What are the NAIC acceptance samples tables?
The NAIC acceptance samples tables are the recommended first-stage sample sizes in the Market Regulation Handbook's sampling chapter, one for claims tested at 7 percent and one for other practices at 10 percent, each listing for every population size the probability of finding 0 to 7 errors if the true rate were at the tolerance. The handbook explains the probability as the chance that the number of errors found would have occurred if the true error rate were at least the tolerance, and says "The p-values are cumulative probabilities derived from the hypergeometric distribution."
Market conduct sample size tables: the first-stage sample by population (2017 edition)
| Population (files) | Claims sample (7%) | Other practices sample (10%) | Second sample when claims errors reach |
|---|---|---|---|
| 200 files | 76 | 79 | 3 |
| 400 files | 82 | 84 | 3 |
| 500 files | 83 | 86 | 3 |
| 1,000 files | 105 | 113 | 3 |
| 2,000 files | 107 | 114 | 4 |
| 3,500 files | 108 | 115 | 3 |
| 5,000 files | 108 | 115 | 3 |
| 10,000 to 50,000 files | 109 | 116 | 4 |
The sample barely grows with the population. Above about 5,000 files the claims sample stays at 108 or 109, because, as the handbook puts it, a sample sufficient for a population of 50,000 is also sufficient for 50 million. What grows the work is the number of populations: each line, each category of claim and each period an examiner defines is sampled separately.
Market conduct exam sample sizes in practice: what Florida drew in 2025
Two 2025 Florida reports show the table in use. Each examined one insurer's Hurricane Ian claims in three populations: closed with payment, closed without payment, and reopened or supplemental. One report states that the number of randomly selected items in each sample "is consistent with the recommended sample size in the Market Regulation Handbook’s Acceptance Samples Table."
Six claims populations and the samples Florida examiners drew from them
| Population | Files | Sample drawn | Table row used (our reading) |
|---|---|---|---|
| Insurer A, closed with payment | 3,397 | 107 | 2,000 → 107 |
| Insurer A, closed without payment | 709 | 83 | 500 → 83 |
| Insurer A, reopened or supplemental | 1,614 | 105 | 1,000 → 105 |
| Insurer B, closed with payment | 2,238 | 107 | 2,000 → 107 |
| Insurer B, closed without payment | 459 | 82 | 400 → 82 |
| Insurer B, reopened or supplemental | 592 | 83 | 500 → 83 |
Both reports then state each finding against all the claims reviewed, 295 in one and 272 in the other, rather than population by population. A company reading such a report should note which denominator each rate uses, because a rate across three samples is not the rate in any one population.
Which market conduct sampling methods are allowed?
The handbook allows random, systematic and stratified sampling, and forbids pre-selection. Random sampling gives every file in the population the same chance of selection. Systematic sampling takes every nth file after a random start; the handbook's example is 50 files from 5,000 by taking every hundredth. Stratified sampling draws separate random samples from subgroups, such as one claims office, and weights the results back to the whole.
Pre-selection is any step that gives some files a different chance of selection after the population is defined, and it can creep in through the company. The handbook warns that a pull list built by company programmers can leave out, say, a ZIP code, a date range or claims closed without payment, and says "Generally, sample selection by the examinee should be avoided due to the difficulty in demonstrating that preselection has not occurred." The examiner-in-charge is responsible for ensuring it has not happened, which is why examiners reconcile the lists a company sends to other data before they sample.
Before the examiners sample: five checks on the list you send
- Is the population defined the way the request defines it?
Line, category, period and location; conclusions only apply to the population sampled.
- Does the count tie to a control total?
The handbook suggests the annual statement and MCAS as checks on completeness.
- Are duplicates removed for the unit being sampled?
Claimant-level and occurrence-level lists count the same accident differently.
- Are records with missing or invalid fields corrected, not dropped?
Dropping them can bias the sample; the handbook asks that true values be found.
- Can you explain every difference from what you filed?
Reopened claims, for example, count again in MCAS.
The second sample: how big, and how its result is stated
A second sample is sized to estimate the error rate with a chosen precision, not to clear a tolerance, so it is usually much larger. The handbook gives a formula for its size and asks regulators to use evidence from the first sample for the expected error rate. Its worked example, a review of rating accuracy in 20,000 homeowners policies at 95 percent confidence and a 5-point margin with the most cautious assumption of a 50 percent error rate, gives 377 files.
The handbook's second-stage sample size formula, term by term
| Term | Meaning | In the handbook’s example |
|---|---|---|
| S = N z² P(1 − P) ÷ [(N − 1) e² + z² P(1 − P)] | The approximation the handbook gives; software using the exact distribution returns slightly different sizes. | S = 376.9, rounded to 377 files |
| N, the population | Files in the population sampled; above about 50,000 it barely changes S. | 20,000 homeowners policies |
| z, the confidence | 1.96 for 95%; for the second stage the handbook says confidence should never be below 90%. | 1.96 |
| P, the expected error rate | From the first sample where possible; 0.5 is the most cautious assumption. | 0.5 |
| e, the margin of error | The precision wanted, as a proportion. | 0.05 |
The report then states the estimate with its interval. The handbook asks that the method of any additional sample be described in the report, with the confidence limits for each estimate. A company reviewing a second-stage finding should check that the interval is there and what it says: a point estimate of 8 percent with a lower limit of 5 percent supports a finding above 7 percent less firmly than its headline suggests.
Sample size for audit testing: why small samples fail faster
Auditors outside insurance often use a much smaller sample and pass a process only if it shows no errors. The handbook describes that method, points to its use in the Financial Condition Examiners Handbook, and does not recommend it for general market conduct use: with zero errors in 38 files from a population of 200, a regulator could be 95 percent confident the true rate is below 7 percent, but such small samples raise false alarms. The 2017 handbook says the risk of a false alarm exceeds 71 percent for claims processes whose true error rate is only 3 percent. A company sizing its own claims audit, to estimate a rate rather than clear an examiner's first stage, faces different arithmetic, worked through in the claims audit sample size calculator.
The same effect shows up whenever a sample is smaller than the table's. The calculator above makes it concrete: at 79 files from 1,391 claims, two exceptions trigger a second sample; at 105 files, they do not. For a company running its own audit testing, the lesson is to use the table's size or larger, so that a clean process is not flagged by chance and a flagged process is worth the second look.
Define the population before you count: reopened claims and MCAS
The sample is only as good as the list it is drawn from, and the most common disagreement about a list is its count. The handbook tells examiners to check completeness against control totals such as the annual statement and the MCAS filing. The MCAS homeowners instructions count a reopened claim again: "If a claim is reopened for a subsequent supplemental payment, count the reopened claim as a new claim." An exam request for claims closed in a year may count each claim once.
A population count reconciled to MCAS before the sample is drawn
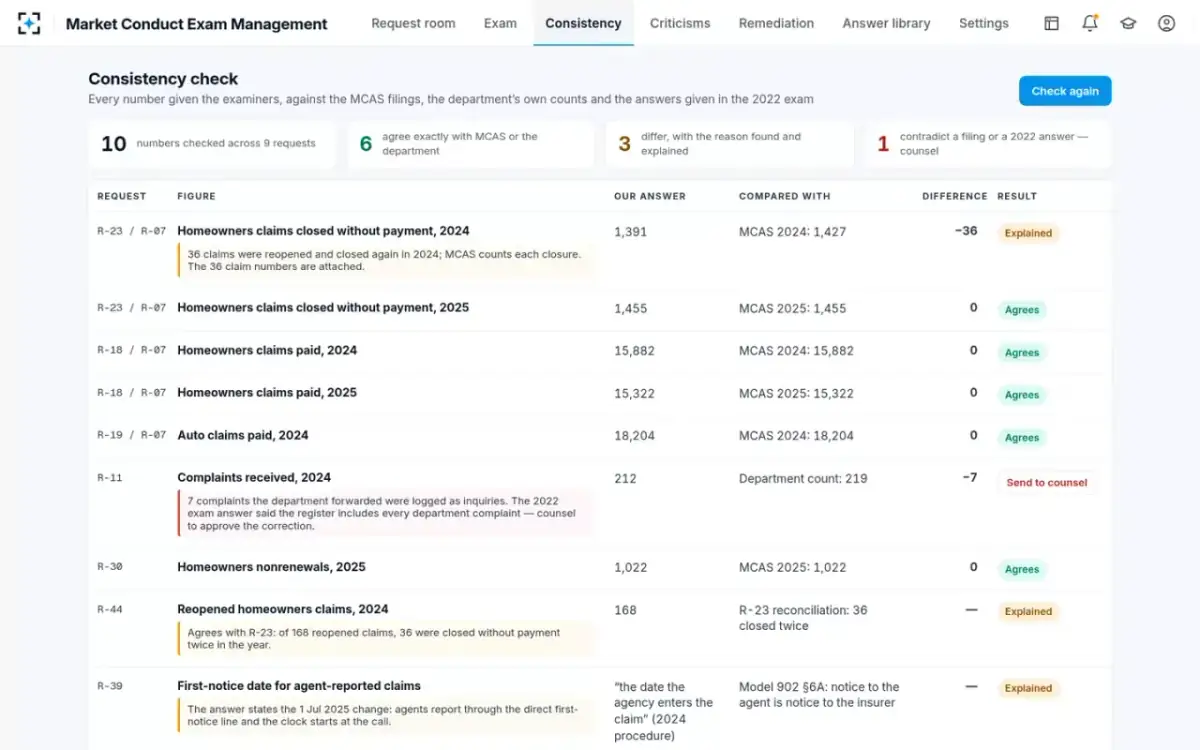
In the solution's sample exam, the claims-closed-without-payment list for 2024 held 1,391 claims against 1,427 in the MCAS filing. The consistency checker found the reason, 36 claims reopened and closed again in the year, and attached their numbers to the package. That is the kind of difference that, unexplained, makes an examiner doubt the list and ask for it again. The guide to MCAS filing requirements covers the other counts examiners compare.
How Market Conduct Exam Management uses the sample, and what it will not do
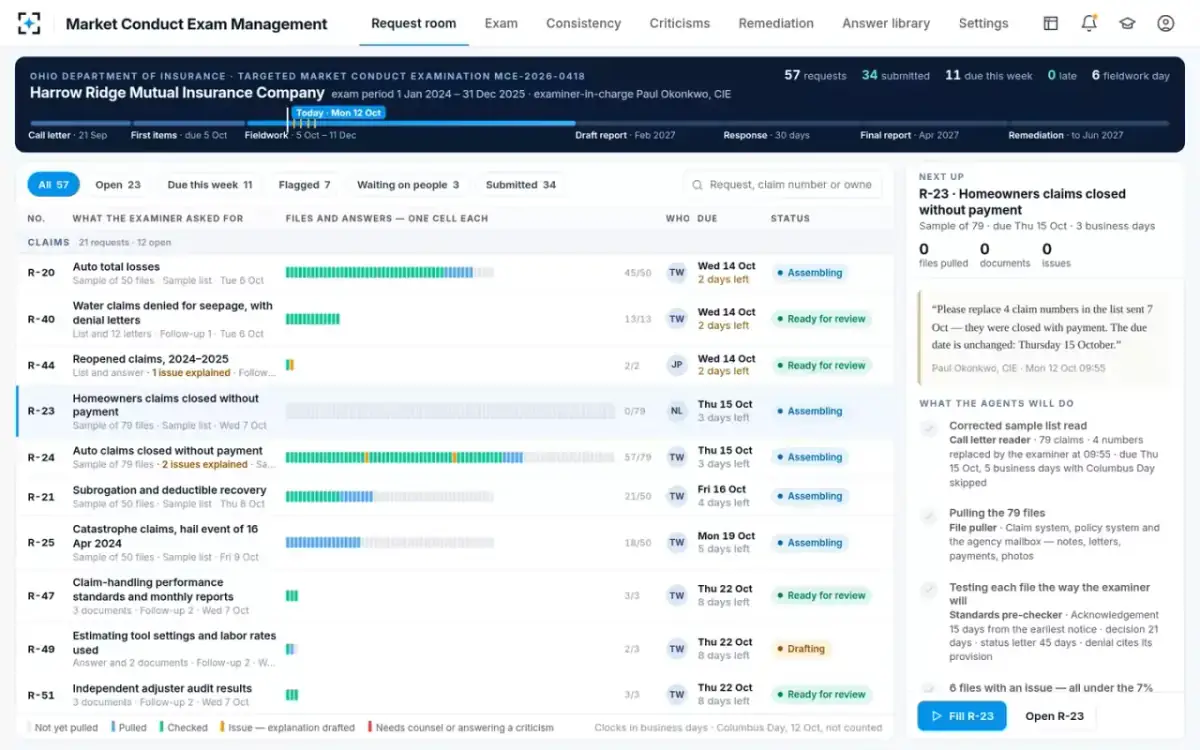
When an examiner sends a sample list, the solution reads it, notes corrections (in the sample exam, four claim numbers replaced five days after the list was sent), and pulls each file read-only with every document numbered by source. The standards pre-checker tests each file and shows each standard's count against its tolerance as files arrive, so the coordinator knows, before submission, which standards carry enough exceptions to draw a second sample. Each exception comes with its cause and a drafted explanation for the claims expert and counsel.
It does not choose the sample; the examiners do, and the handbook warns against sample selection by the company. It does not argue that a count is acceptable or that an exception is not a violation. Its job is to make sure that what the company sends is complete, consistent with its filings, and explained where it should be. For the meaning of the tolerances it tests against, see the NAIC error tolerance chart.
Sample requests in the request room, each with its files and clock
Questions people ask
How many files does a market conduct exam sample?
Under the 2017 NAIC Acceptance Samples Table, the first claims sample is 76 files for a population of 200, 105 for 1,000, 107 for 2,000, 108 for 3,500 and 5,000, and 109 from 10,000 upward. Other practices use 79 to 116. A second, larger sample follows if the first cannot clear the tolerance.
How many errors trigger a second sample?
For claims at a 7 percent tolerance, usually the third error: the table marks three errors for an additional sample at 200, 400, 500, 1,000, 3,500 and 5,000 claims, and four at 2,000 and from 10,000. For other practices at 10 percent, the fifth error up to 500 files and the seventh from 1,000.
Can an examiner use a different sample size?
Yes. The handbook calls the table the generally recommended size and gives the regulator discretion, for example a larger sample for a critical process, but says sizes significantly different from the table should be justified. Some states start with a standard sample of 50 or 100 files.
Is the Acceptance Samples Table still current?
The figures on this page are from the 2017 edition, which the Indiana Department of Insurance publishes in full. The NAIC updates the handbook each year; Florida's 2025 reports still describe their samples as consistent with the table.
Can a company choose its own sample to save time?
No. The handbook says sample selection by the examinee should generally be avoided because pre-selection is hard to disprove; the company's job is a complete, accurate list for the examiners to sample from.