A claims audit sample size calculator answers one of three questions, and each needs a very different number. To show that late steps are not more frequent than a threshold, such as the 7% benchmark examiners have long used for claims, with 95% confidence, you need about 42 files from a large population if none of them is late; the examiners' own acceptance table uses 76 to 109 claims depending on the population. To estimate the rate within two points either way, you need several hundred. To find a pattern that touches one claim in two hundred, you need more than 600, and a 60-file quarterly sample will miss it most of the time. Claims compliance desks sample because reading and dating files by hand is slow, and the sample size they can afford answers the first question at best. Botminds' Claims Compliance Audit removes the trade-off by reading and testing every closed claim, so the question becomes how to check the agents' work rather than how many files to pull.
The calculations are ours, using the hypergeometric method the NAIC's Market Regulation Handbook describes. The sample quarter is fictional sample data from the solution: 14,286 closed claims, a 60-file hand sample that found 2 exceptions, and a full read that found 559.
Four numbers from the claims audit sample size arithmetic
42files
with no exceptions needed to rule out a 7% late-step rate at 95% confidence
109claims
the examiners’ acceptance sample for populations of 10,000 or more (2017 edition)
10.1%
the highest true rate still consistent with 2 exceptions in 60 files
77%
chance a 60-file sample from the sample quarter misses all 63 claims of its costliest pattern
How do you calculate a claims audit sample size?
Start by writing down the question the sample has to answer, because the arithmetic follows from it. If the question is whether the error rate is below a threshold, the sample size is the smallest one in which the errors you find would be improbable, under 5%, if the true rate were at the threshold. That is an acceptance test, and it is what examiners run first. If the question is whether a particular kind of error exists at all, the sample has to be large enough to draw at least one of them with 95% probability, roughly 3 divided by the error's rate. If the question is what the rate is, the sample size comes from the margin of error you will accept.
The handbook calculates its own table this way, using the cumulative hypergeometric probability, which accounts for sampling without replacement from a finite population. It notes that a normal approximation is often used when samples are sized by hand, and that the approximation gives somewhat different numbers from its table (Handbook, chapter 14, 2017 edition). For an internal claims audit the safest course is to use the exact method and keep the calculation with the workpapers, so anyone can rerun it.
What a 60-file sample cannot find
A 60-file sample from a quarter of 14,286 claims cannot reliably find any pattern that touches fewer than a few hundred claims, and most patterns that matter are that small. In the solution's sample quarter, the costliest pattern was 63 California homeowners claims decided after 40 days with no status letter. A random 60-file sample would have contained none of them 77% of the time. The bars show the same arithmetic for the five costliest patterns.
Chance a 60-file sample misses every claim in a pattern: the five costliest in Claims Compliance Audit's sample quarter
The pattern most likely to be caught was the cheapest of the five: 211 late New York auto acknowledgments, the largest group by count. That is not an accident. A sample finds frequent errors and misses rare ones, and in claims compliance the rare ones are often expensive: a template that dropped a required notice, a payment process that waits for a second signature, a decision clock that nobody diaried. The sample's 2 exceptions told the desk that something was late. They could not tell it which of eleven root causes was costing the most.
What a 60-file sample can tell you
A 60-file sample can bound the error rate, loosely. Two exceptions in 60 files is a rate of 3.3%, but the true rate behind it could plausibly be anywhere from about 0.6% to 10.1%, using one-sided 95% bounds. Measured against the 7% claims benchmark, that sample does not pass. If the true rate were 7%, a sample of 60 would show two or fewer exceptions about one time in five, so the result cannot rule the benchmark out. With this population, only a 60-file sample with no exceptions at all would.
The handbook draws the same line from the examiners' side. It separates the tolerance used to size a first sample from the benchmark used to presume a general business practice, and it warns that the small first-stage sample cannot establish with confidence that the true rate exceeds the benchmark; only a larger second sample can estimate it (chapter 14, footnote 23). It is also candid that the 7% is a sampling setting that says little about how much error a jurisdiction will actually accept, a point taken further in the NAIC error tolerance chart. A desk that reports "2 of 60, within tolerance" is using a test the numbers do not support.
Claims audit sample size table: the examiners' acceptance table
The NAIC's Acceptance Samples Table is the claims audit sample size table most examiners start from. It gives a first-stage sample size for each population, and the number of errors at which a second, larger sample is needed. The claims sizes grow slowly with the population: 76 claims for 200, 105 for 1,000, and 109 from 10,000 up. Florida's 2025 Hurricane Ian examinations drew 107 claims from 3,397 and 109 from 47,469 for one category each, consistent with the table (Tower Hill, Citizens). The examiners' side of the table, population by population with the error count that triggers a second sample, is set out in the market conduct exam sample size calculator; this page is about the company's own audit.
The handbook's acceptance sample sizes for claims, with the error count that triggers a second sample
| Claims population | First sample | Second sample if errors reach | Chance of that many errors or fewer if the true rate were 7% |
|---|---|---|---|
| 200 | 76 | 3 | 14.9% at 3 errors |
| 500 | 83 | 3 | 13.5% at 3 errors |
| 1,000 | 105 | 3 | 5.0% at 3 errors |
| 2,000 | 107 | 4 | 11.7% at 4 errors |
| 5,000 | 108 | 3 | 4.9% at 3 errors |
| 10,000 to 50,000 | 109 | 4 | 11.3% to 11.4% at 4 errors |
The table is a regulator's tool and its sizes are a regulator's recommendation, not a rule for insurers. The handbook gives examiners discretion: greater precision may be warranted for "a critical issue or process likely to represent a high probability of consumer harm", and an examiner who departs significantly from the table "should be prepared to provide explicit justification". An internal audit that copies the table inherits its purpose, which is to decide whether to look further, not to find every late step.
A claims audit sample size calculator, worked three ways
The three questions give three answers on the same population. The frame below works each one for the sample quarter's 14,286 closed claims, using the hypergeometric distribution for the first two and the standard margin-of-error formula, with a finite-population correction, for the third.
One population, three questions: a claims audit sample size calculator, worked
Rule out an error rate above a threshold
Is the true late-step rate below 7%, with 95% confidence?
Smallest sample in which the errors you find would be unlikely, under 5%, if the true rate were 7%. Hypergeometric probabilities, as the handbook uses.
42 files if none is late; 66 if one is; 88 if two are
Find at least one claim of a rare pattern
Will the sample catch a pattern that touches 63 of 14,286 claims?
Sample until the chance of drawing none of them falls to 5%. Roughly 3 divided by the pattern’s rate, for large populations.
662 files for a 0.44% pattern; 295 for 1%; 59 for 5%
Estimate the rate itself
What is the late-step rate, to within 2 points either way?
n = 1.96² × p × (1 − p) ÷ margin², then corrected for the population size.
360 files at a 4% rate for ±2 points; 1,338 for ±1 point
The middle column is the one desks underestimate. A discovery sample for a pattern touching 0.44% of claims needs 662 files, eleven times the quarterly sample, and that is for one pattern whose rate is already known. A desk that does not know which patterns exist has to size for the rarest one it cares about, which is why a sample that would find every costly pattern ends up being most of the population.
Sample size for audit testing when each violation counts
Where a state counts each violation, the sample size question changes, because the error rate is no longer the whole story. California's fair claims regulations reach practices "knowingly committed on a single occasion" as well as general business practices (10 CCR 2695.1(a)), and New York's Insurance Law says that after notice and an opportunity to be heard "each instance of noncompliance with subsection (a) hereof may be treated as a separate violation" for a monetary penalty (§2601(c)). The handbook acknowledges this case directly: in such states the sample's error rate represents the probable number of violations in the population rather than a threshold test.
California's penalty rules make the count explicit. Among the factors the Commissioner weighs are "the relative number of claims where the noncomplying act(s) are found to exist, the total number of claims handled by the licensee and the total number of claims reviewed by the Department" (2695.12(a)(7)). An insurer that has found and corrected its own exceptions across the whole population is in a different position from one that knows only its sample's rate. In May 2026 the California Department of Insurance said its examiners found 398 violations in 114 of 220 sampled wildfire claims at one insurer, and described penalties of up to $5,000 per violation (CDI).
How to determine audit sample size for a claims QA program
Determine the sample size for each population you intend to report on, not for the book as a whole. The handbook is firm that results do not travel: a sample from one office cannot be extrapolated to another, because a sample represents only the population it was drawn from (chapter 14). Florida's examiners follow that rule by splitting each storm's claims into those closed with payment, those closed without payment and those reopened, and sampling each. A quarterly claims QA program that wants results by state, line and step needs a sample for each cell it will report, which multiplies the count quickly.
In the sample quarter, a defensible stratified sample would have treated New York separately: it produced 260 of the 559 claims with a late or missing step from 2,637 of the 14,286 claims. Sized by the acceptance table at about 108 claims per state, four states already need over 400 files a quarter, before any split by line or step, and still would not have found the rare patterns in the bars above. That is the point at which reading every file stops being the expensive option.
Claims audit sample size requirements: what regulators actually ask
None of the rules read for this guide sets a minimum sample size for an insurer's own claims audit. The requirements that exist bind examiners or define a standard. The handbook's acceptance table is the examiners' recommendation. New York's auto rules contain the one tolerance written into Regulation 64: unless clear justification exists, no more than 20% of a representative sample of physical damage claims chosen by the Department's examiners may take more than 30 calendar days to pay (11 NYCRR 216.7(d)(1)). Florida's 2025 reports state that their samples follow the handbook's table and that results at 95% confidence may be extrapolated to the population examined.
What regulators do require is that the insurer can produce the population. California expects claim data for the current year and the four before it to be retrievable by claim number, line and dates; the NAIC model regulation asks for two years. An internal audit that keeps the full population list, the random draw and the calculation can show an examiner exactly what it tested and why.
When the sample size question goes away
The sample size question goes away when reading a file is cheap enough to read all of them, and a different question replaces it: how do you know the reading is right? Claims Compliance Audit reads and dates every closed claim and tests each step with fixed rules, so the sampling moves from the claims to the agents' work. Reviewers check the dates on a random set of files, and every exception the agents raise is confirmed or overturned by a person, with a reason.
A sample answers a rate question; reading every claim answers a list question
A 60-file quarterly sample: A rate between about 0.6% and 10.1%, from 2 exceptions.
Every closed claim, read by Claims Compliance Audit: 559 claims with a late or missing step, each with its file page.
A 60-file quarterly sample: Misses a 63-claim pattern 77% of the time.
Every closed claim, read by Claims Compliance Audit: Every pattern found and grouped: 11 root causes.
A 60-file quarterly sample: An estimate of how many violations exist.
Every closed claim, read by Claims Compliance Audit: The list of them, each confirmed or overturned by a person.
A 60-file quarterly sample: Pulling and dating files by hand.
Every closed claim, read by Claims Compliance Audit: Confirming exceptions and checking the agents’ dates.
A 60-file quarterly sample: The claims.
Every closed claim, read by Claims Compliance Audit: The agents’ reading: reviewers spot-check dates on random files.
Every closed claim of the quarter, one pixel each, beside last quarter's sample
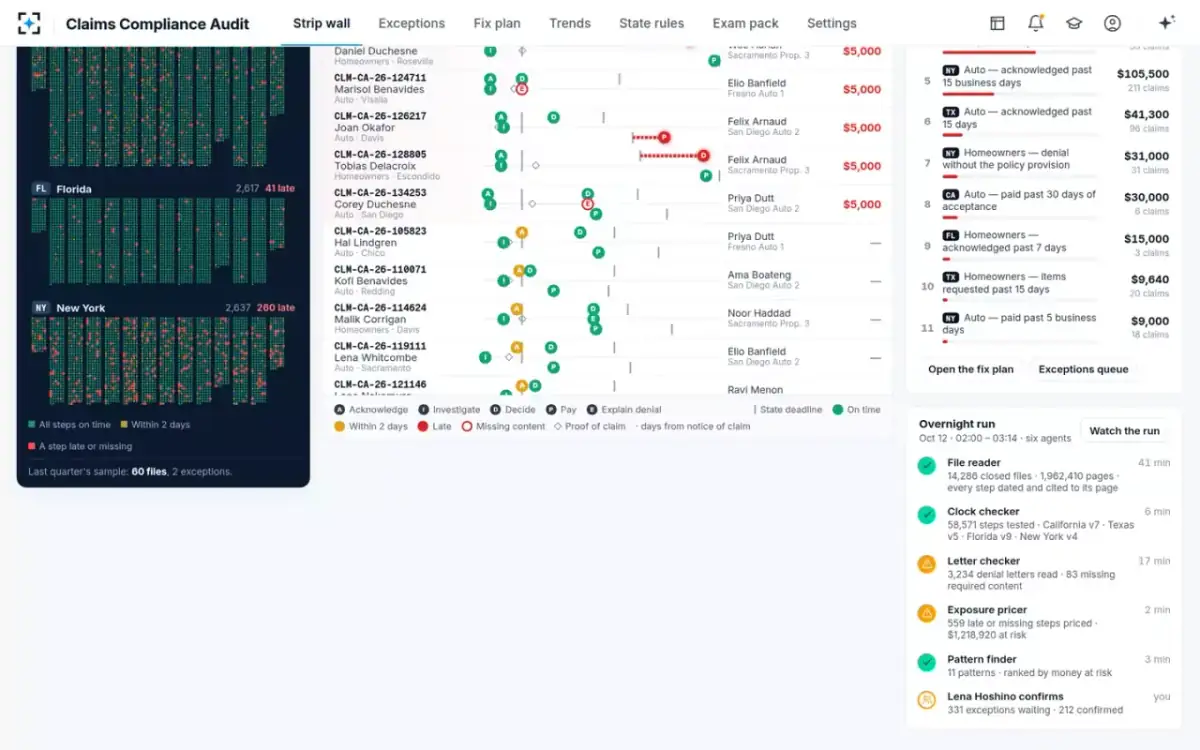
The accuracy measure then comes from the reviewers, not from a confidence interval. In the sample quarter they had overturned 16 of the 228 exceptions they had decided, about 7%, each with one of three recorded reasons. How a team pilots that switch on a quarter it already sampled by hand is set out in the closed claim file review process, and the checklist the agents run on each file in the claim file audit checklist.
Questions people ask
What is a good sample size for a claims audit?
It depends on what you want to show. To rule out a 7% error rate at 95% confidence from a large population, 42 files with no errors are enough, and the examiners' table uses 76 to 109 claims depending on population. To estimate a 4% rate within two points takes about 360 files; to find a pattern touching 0.44% of claims takes about 660.
How do you determine audit sample size for a small population?
Use the hypergeometric distribution, which accounts for drawing without replacement; for small populations it gives smaller samples than formulas that assume an unlimited population. The handbook's table, for example, uses 76 claims for a population of 200. For very small populations, testing every file is often simpler than sizing a sample.
Is there an audit sample size calculator in Excel?
Excel's HYPGEOM.DIST function computes the hypergeometric probabilities the handbook uses: the chance of k or fewer errors in a sample of n from a population of N with K errors. Increase n until the probability of the errors you would accept falls below 5% at your threshold rate, and keep the sheet with the audit workpapers.
Does a sample that passes mean the claims process is compliant?
No. A passing first-stage sample rules out an error rate above the threshold with stated confidence; it says nothing about rare patterns, and in states that count each violation it does not show how many exist. In the sample quarter, 2 exceptions in 60 files could not even rule out the 7% benchmark.
What is the 7% error tolerance in a claims audit?
It is the NAIC handbook's long-standing benchmark for claims practices, with 10% for other trade practices (2017 edition). Rates above it are presumed to indicate a general business practice in states that use that standard. The handbook stresses that the tolerance used to size samples is a statistical construct, not the error a state is willing to accept.
How many claims do market conduct examiners sample?
For each population tested, usually the first-stage size in the handbook's acceptance table: 76 claims for a population of 200, 105 for 1,000, 108 for 5,000 and 109 for 10,000 or more. Florida's 2025 Hurricane Ian examinations sampled each category of claims separately at those sizes.