In insurance, a loss pick is the underwriter's selected estimate of the losses an account will produce in the coming policy period, built from its loss history and used to set the price, a retention or a deductible. On a commercial account it is built from the loss runs in a sequence the Casualty Actuarial Society's ratemaking text sets out for experience rating: take three to five recent policy years, cap or remove large losses and add a provision for them, develop each year's losses to an ultimate value, trend them to next year's cost level, adjust to next year's exposure, and weigh the result against the losses an average account of that size would be expected to produce. Every step depends on reading the runs correctly, which is where Botminds' Loss Run Analysis Automation comes in: it prepares the loss picture by policy year and line, the large losses, the development across evaluations and the data limits, and gives no view on price, so the pick stays the underwriter's.
The worked pick below starts from a fictional sample account, Calloway Cold Freight, as the solution summarised its runs. Every factor applied after that, development, trend, exposure, the large-loss provision and credibility, is our illustrative choice to show the method, not a market figure or a recommendation.
A loss pick worked line by line, on three policy years of one sample account
| Step | What is done | Result |
|---|---|---|
| 1. Incurred, capped at $100,000 a claim | From the loss summary; four losses over $100,000 cut to $100,000 | 2022–23 $237,950 · 2023–24 $338,750 · 2024–25 $289,150 |
| 2. Develop to ultimate | × illustrative factors 1.05, 1.15, 1.35 for 46, 34 and 22 months of age | $249,848 · $389,562 · $390,352 |
| 3. Trend to the new policy period | × 5% a year (illustrative) for 4, 3 and 2 years | $303,691 · $450,967 · $430,364 |
| 4. Average the years | Simple average of step 3 | $395,007 |
| 5. Adjust to next year’s exposure | × 1.05 (illustrative growth over the experience average) | $414,758 |
| 6. Add a provision for large losses | × 1.20 (illustrative long-term ratio of excess to capped losses) | $497,709 |
| 7. Weigh against the expected loss | 50% × $497,709 + 50% × $450,000 (illustrative credibility and expected loss) | $473,855, the pick |
What is a loss pick in insurance?
A loss pick is a selected expected loss: one number for what an account's losses will cost in the coming period, chosen by the underwriter or an actuary from the evidence. "Pick" signals judgement. The method produces a range of defensible answers, and the underwriter selects one, often with the loss history, the industry's expected losses for that class and size, and what is known about open claims all in view.
The pick feeds different decisions depending on the account. On a guaranteed-cost policy it is the loss component of the premium. On a large-deductible or retrospectively rated programme it sets the expected losses inside the retention, which determine collateral and the insured's budget. In each case it is a forecast of next year, built from runs that describe past years at a past date.
How do you calculate a loss pick?
Seven steps, as in the table: choose the experience years, limit large losses, develop each year to ultimate, trend to next year's cost level, average, adjust for exposure, add back a provision for large losses, and weigh against an expected figure. The CAS text describes the core of it for experience rating plans: "historical losses are developed to ultimate, trended to current cost levels, and summed across the years", then compared with exposure and applied to the current exposure measure (Werner and Modlin, Basic Ratemaking, ch. 15).
The order matters. Large losses are capped before development, because a development factor applied to a shock loss multiplies the noise. Development comes before trend, because trend adjusts cost levels and development completes the claims. And the comparison with an expected figure comes last, because it needs the account's experience in its finished form. Change the order and the same inputs give a different pick.
How many years go into a loss pick?
Usually three to five complete policy years. The CAS text puts the trade-off plainly: "The experience period usually ranges from two to five policy years, ending with the last complete year" (Basic Ratemaking, ch. 15). Fewer years respond faster to change but swing more; more years are steadier but older.
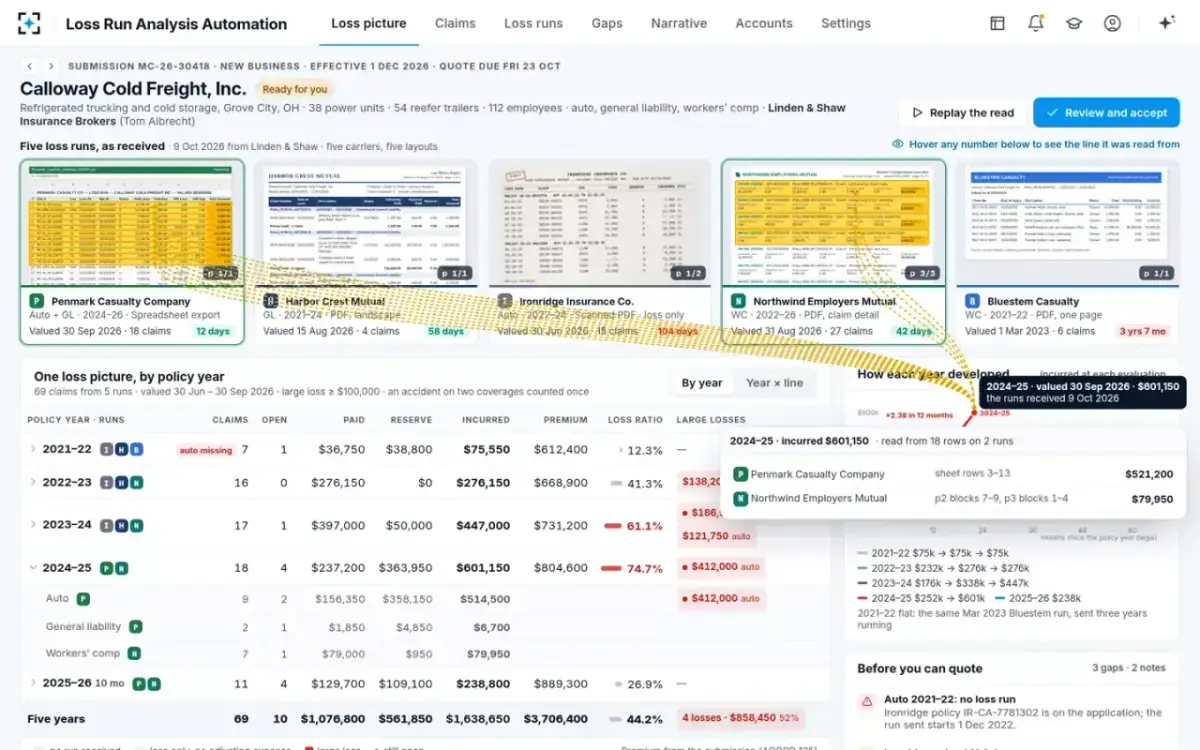
The years that go in must be complete, and the loss runs decide whether they are. The worked pick leaves out the sample's 2021–22 for two reasons the runs reveal: its auto run never arrived, so the year has no auto losses at all, and its workers' comp run was valued in March 2023, so its open claim's reserve is three and a half years old. It also leaves out 2025–26, ten months old at valuation and far from ultimate. Including 2021–22 as if it were complete would cut the pick by about $47,000, as the sensitivity chart below shows; the year looks cheap because it is missing a line.
How do large losses affect a loss pick?
A single large loss can dominate a small account's history, so the usual practice is to limit each loss to a threshold and add back a provision for large losses based on a longer or broader view. The CAS text sets the aim: "Ideally, the large loss threshold should correspond to the point at which the losses are extraordinary and their inclusion causes volatility in the rates" (Basic Ratemaking, ch. 6).
Indicated rates will be understated if actual shock losses have been removed from projected losses and no provision for shock losses has been added.
Werner and Modlin, Basic Ratemaking, Casualty Actuarial Society, ch. 6
Both halves of the rule matter. On the sample account four losses exceeded the desk's $100,000 threshold in the three years used, $458,450 above the cap in total, and the largest, a $412,000 auto claim in suit, would on its own move 2024–25 from $289,150 to $601,150. Leaving it uncapped and still adding a large-loss provision counts it twice, and in the illustration raises the pick by about $97,500. Removing it and adding no provision understates the pick. The provision is meant to come from a long view, many accounts or many years, not from the same account's own shock loss.
Development and trend: bringing old runs to next year's cost
Development completes immature years; trend moves every year to next year's prices and legal environment. Development factors should come from data on the same basis as the losses they are applied to. The CAS text is explicit: "If capped losses are used, then the loss development factors applied should be developed from data that has also been capped" (Basic Ratemaking, ch. 15). Factors usually come from the carrier's actuarial team or industry data by line; how they relate to case reserves and IBNR is set out from the claims side in case reserves vs IBNR.
Trend carries more than inflation. The same chapter says the adjustments "should reflect economic and social inflation (e.g., changes in judicial decisions or litigiousness)" as well as changes in risk characteristics and limits. That is not abstract for commercial liability lines: the NAIC's review of 2025 results reports the commercial auto liability pure net loss ratio at 71%, improved 3 points on rate increases, while noting that liability lines still face profitability pressure from social inflation (NAIC, 2025 Property and Casualty Industry Analysis). A trend assumption is a view on that environment, and it moves the pick.
Industry context for the expected side of a commercial pick, 2025
71%
commercial auto liability pure net loss ratio, improved 3.0 points
48%
workers’ compensation pure net loss ratio, worsened slightly
67%
other liability (occurrence) pure net loss ratio
Credibility: how much the account's own runs count
The final pick blends the account's developed, trended experience with an expected loss for an average account of its class and size, in proportion to how credible the account's experience is. A large account with many claims a year earns high credibility, so its own runs dominate; a small one with a few claims leans on the expected figure. The illustration uses 50%, a midpoint chosen for the example.
Washington's workers' comp experience rating rule shows the same idea in a filed formula: credibility weights an employer's actual primary and excess losses against expected losses calculated from its reported exposure in each classification and the class expected loss rates (WAC 296-17-855). The underwriter's loss pick is the commercial-lines cousin of that formula, with judgement where the rating plan has tables.
Where a misread loss run moves the pick most
The biggest errors in a pick come from the runs, not from the factors. Each bar below changes one thing about how the sample account's runs were read, or one assumption, and holds everything else in the worked pick constant.
How much one change moves the illustrative $474,000 loss pick
The three largest effects are all things a loss run reader controls: whether the large claim is capped, whether a year with a missing line is treated as complete, and whether the latest valuation is used. Each is a mistake that a typed spreadsheet makes silently and a cited summary makes visible. The stale-evaluation case is the subtle one: on capped losses it moves the pick by $16,000, but the claim behind it rose by $297,000, which a pick with a $100,000 cap mostly sends to the large-loss provision. That is why the underwriter still reads the large open claims, not just the capped totals.
How each policy year developed across evaluations, and the rows behind it
What is the difference between a loss pick and a loss ratio?
A loss ratio describes the past; a loss pick predicts the future. The loss ratio on a loss summary is incurred losses divided by premium for years already written, at a valuation date. The pick is the expected loss for a year not yet written, after development, trend, exposure and large-loss adjustments. On the sample account the five-year incurred loss ratio was 44.2%; the pick for the next year is a dollar figure, which divided by the proposed premium gives an expected loss ratio for the quote.
The two are often confused because a loss ratio is the quickest view of an account's history. But a 44.2% five-year ratio built from runs of different ages, one year missing a line and one loss-only run, is not a forecast of anything. It is the starting point the pick corrects.
What is a loss pick in workers comp?
The same idea built on payroll: expected losses for the coming year, from the employer's own experience and the expected losses for its classifications. Workers' comp has the most formal version of the comparison step, because the experience mod already blends the employer's actual losses with expected losses by class. The underwriter's pick for a large-deductible or retrospective programme starts from that structure and adds the account-specific view, especially of open lost-time claims. How workers' comp runs split each claim into indemnity, medical and expense, and why that split matters to the mod, is in loss runs for workers compensation.
Where Loss Run Analysis Automation stops, and the pick begins
The solution's agents produce the inputs a pick needs and nothing beyond them: the loss picture by policy year and line, with paid, reserve and incurred; large losses against the desk's threshold; the development across every evaluation on file; and the data limits stated in words. Its loss analyst writes the narrative with every figure cited and the sentence "No pricing view: that is yours".
The cited narrative the underwriter starts the pick from
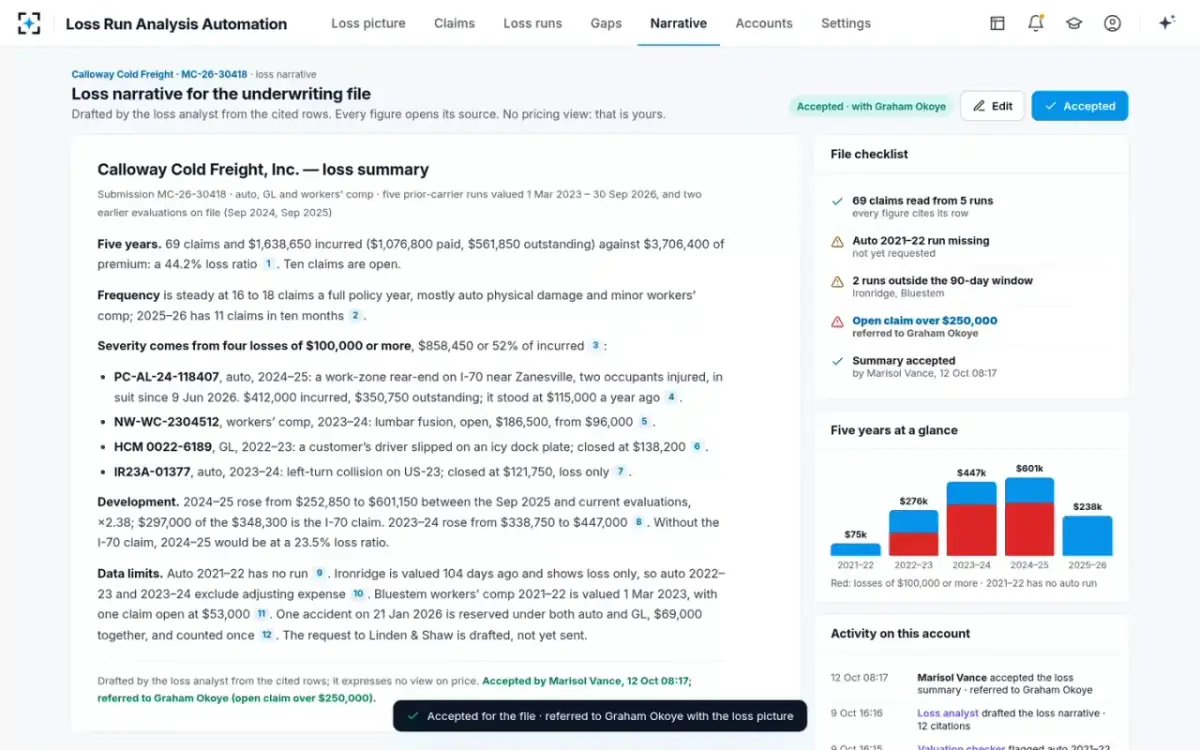
Keeping that line in place is deliberate. A pick rests on judgements the runs cannot make: which development factors fit this account, how much trend to assume, how credible a trucking company's five years are. What the runs can do is arrive at the pick correctly read. The economics of getting them read, per account, are in loss run software or a spreadsheet.
Questions people ask
What is a loss pick formula?
There is no single formula, but the common structure is: capped incurred by year × development factor × trend factor, averaged, × exposure change, × (1 + large-loss provision), then credibility-weighted with an expected loss. Each factor is a selection, which is why the result is called a pick.
Is a loss pick the same as expected losses?
Close: a loss pick is the selected expected losses for the period. "Expected losses" is also used for the manual or class-based figure the pick is weighed against, so it helps to say which one is meant.
Who makes the loss pick, the underwriter or the actuary?
On most commercial accounts the underwriter, using factors the actuarial team publishes; on large or loss-sensitive programmes an actuary often prepares it. Either way the loss runs are the evidence, and their reading should be checkable.
Should open claims be included in a loss pick?
Yes, at their incurred value, developed like the rest of the year, and capped like any other large loss. The underwriter should also read the largest open claims individually; on the sample account one open claim rose $297,000 in a year.
How do you handle a year with a missing loss run?
Leave the year out, or ask for the run; never treat it as complete. In the illustration, counting the sample's 2021–22, which has no auto run, lowered the pick by about $47,000.