Loss run software reads the loss runs prior carriers send with a commercial submission and turns them into one loss summary, replacing the hours an underwriter or assistant spends re-keying each carrier's layout into a spreadsheet. Whether it pays depends on one comparison: the staff time it removes per account, at a fully loaded wage, against what it costs per account once setup, exceptions and review are counted. The deciding inputs are how many accounts a desk reads a year and how many prior-carrier runs each one brings. Botminds' Loss Run Analysis Automation is one such tool: six agents read the runs in any layout, line up the evaluations on file and draft a cited loss narrative, with a design target of about four minutes per account from received runs to a loss picture.
No government, academic or non-profit source publishes loss run software prices, keying times or outsourcing rates, so this guide gives a method rather than a price list: BLS figures for the cost of a person's time, Botminds' own estimate of the minutes involved, labelled as such, and blanks for the quotes you will collect. The worked numbers are illustrative inputs to be replaced with yours.
The cost of an underwriting hour, from BLS figures
$81,370
median annual wage, insurance underwriters, May 2025
68.5%
share of employer costs that is wages, full-time private industry, June 2026
$57/h
median underwriter hour with benefits, our arithmetic
How much does loss run software cost?
Vendors price per run, per page, per account or by annual subscription, and we found no independent, published price to compare quotes against, so the honest answer is: what your quotes say, divided by the accounts you will read. That makes the per-account figure the one to compare across options, because it is the unit the underwriting desk lives in and the one each alternative can be expressed in.
Converting a quote is simple arithmetic but easy to get wrong. A per-page price on an account whose workers' comp carrier sends three pages of claim detail and whose auto carrier sends two scanned pages costs more than the same price on five one-page runs. A per-run price on an account that changed carriers twice costs more than on a stable one. Ask each vendor for a price on a sample of your own recent submissions, not on its average.
How long does it take to key a loss run?
Longer than the typing, because most of the time goes on making runs comparable, not on transcribing them. Botminds estimates about 75 minutes by hand for a five-carrier, three-line commercial account before the underwriter reads anything: 35 minutes re-keying claim rows, and 10 minutes each on mapping columns and status words, tying claims to policy years, lining up last year's evaluation and writing the summary. It is an estimate, not a measurement, and your own desk's figure is the one to use.
Measuring it takes a week. Ask three assistants to log, for every account, the number of runs, pages and claim rows, and the minutes from first opening the runs to a summary the underwriter accepts. The rows and runs explain most of the variation; a desk that knows its minutes per run and runs per account can cost any option.
The total cost per account: a formula you can fill in
The saving per account from any tool is the staff time it removes, priced at a loaded wage, less what it costs per account and less the staff time it adds back in exceptions and review. Setup is a one-off cost spread over the accounts read in the period you are evaluating, typically three years.
Saving per account from loss run software: four terms
Staff time removed
(minutes by hand − minutes with the tool) × loaded cost per minute
At Botminds’ estimate and target: (75 − 4) × $0.95 ≈ $67.60 on a five-carrier account.
Your desk’s timed sample
Vendor price
quote ÷ accounts read
Per run, page or account, or a subscription spread over the year’s accounts.
Your quotes
Exceptions and review
minutes on flags and new layouts × cost per minute
Confirming a new carrier’s column map, correcting faint figures, checking a mismatch.
Measured in the parallel run
Setup, spread
(integration + mapping + testing) ÷ accounts over three years
Mailbox and file connections, settings, a parallel run on closed accounts.
Project plan
The formula makes the deciding variable plain. Staff time removed scales with runs per account and accounts per year; the vendor price scales with whatever unit the vendor chose. A desk with many multi-carrier casualty accounts gains far more per account than one whose submissions bring a single property run, and the same software can be an easy purchase for one desk and a poor one for the next.
Is it cheaper to outsource loss run analysis?
Sometimes, on labour; rarely on total cost once the review time that stays in-house is counted. Outsourcing moves the keying to a service provider, but someone at the carrier still checks the summary against the runs before pricing on it, handles the provider's questions and chases the gaps. The comparison is the staff time each option leaves inside the desk, plus each option's fee.
Staff cost each option leaves in-house over three years, at 1,000 five-carrier accounts a year
The bars show staff cost only, and that is deliberate. The in-house labour each option leaves is knowable from your own timings and BLS wages; the fees are knowable from your quotes. Outsourcing wins on paper when its fee per account is below about $57, the difference between the first two bars spread over 3,000 accounts, and software wins over outsourcing when its fee is less than the outsourcing fee plus about $10. Your numbers will move both thresholds.
Two things the bars cannot show favour keeping the reading close to the underwriter. Turnaround: an outsourced summary comes back in the provider's service window, while runs read as they arrive let the gaps go to the broker the same day. And traceability: a typed summary from anyone, in-house or outside, has to be re-checked on the claims that drive the price, while one whose figures open their source rows does not.
What is the ROI of loss run automation?
On the estimate and target above, about $67.60 of staff time per five-carrier account, before the vendor's price and the exceptions. The annual figure is that times accounts a year, which is why volume decides it.
Annual staff time freed, by accounts read a year
"Freed" is the honest word. On most desks the hours do not leave the payroll; they move to work that was not getting done: chasing missing runs the same day, reading the large claims, turning quotes faster. BLS projects underwriter employment to fall 4% from 2025 to 2035 while still showing about 6,800 openings a year, so for many carriers the return shows up as openings they do not have to fill rather than people they let go. A business case that counts freed time as cash will be challenged by finance, and should be.
Can a spreadsheet handle multi-carrier loss runs?
It can hold them, and for a desk with a few accounts a month a well-built template is the right tool. What a spreadsheet cannot do on its own is remember where each number came from, remember each carrier's column meanings, or line up last year's evaluation without someone keying that too.
Five ways to turn loss runs into a loss summary
| Option | Who reads the runs | Source of each figure | Reserve movement | Cost driver |
|---|---|---|---|---|
| Spreadsheet template | Assistant, by hand | Lost once typed | Only if last year is keyed too | Staff minutes per run |
| Outsourced keying | Provider’s staff | Usually lost; sometimes page references | Rarely | Fee per run or page, plus in-house review |
| Generic document extraction | OCR or a general AI model | Often kept at page level | No | Licence plus mapping and exception work |
| Built in-house | Your model and your team | As designed | As designed | Build, run and maintain |
| Loss Run Analysis Automation | Six agents; a person confirms new layouts | Page, row and column for every figure | All evaluations on file lined up | Vendor price plus exceptions |
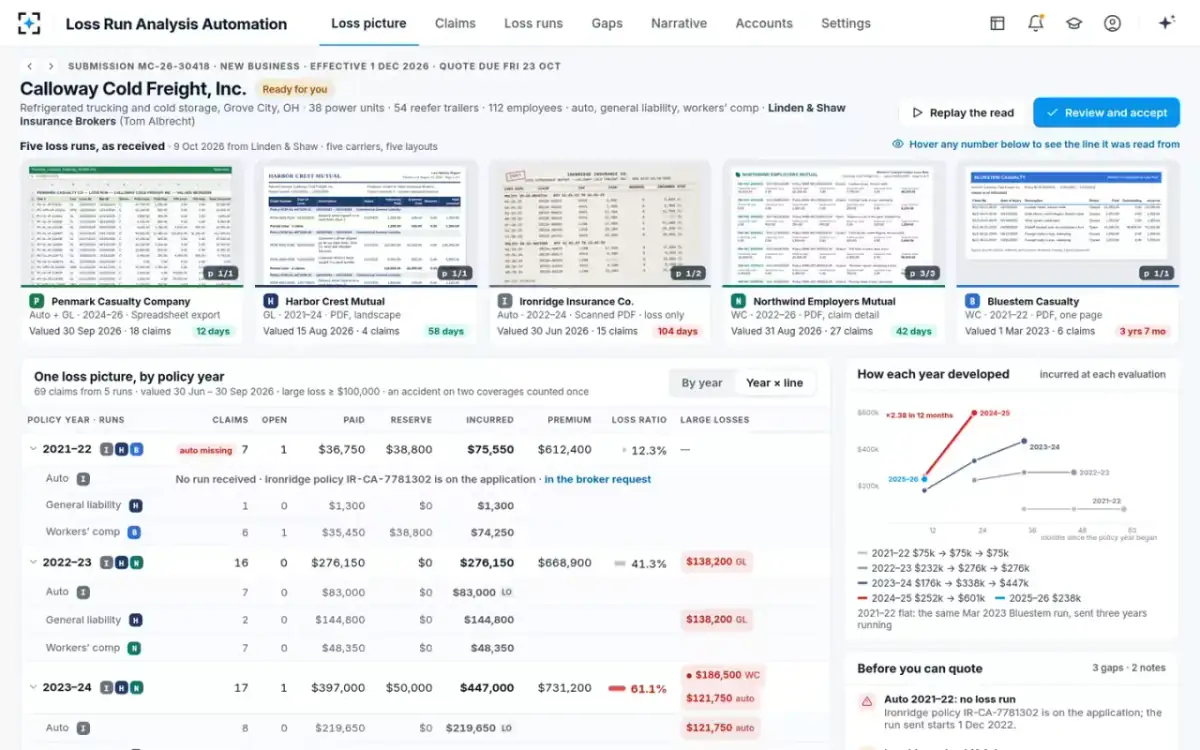
The middle column is the one buyers underrate. When a manager asks where a $412,000 figure came from, the spreadsheet answer is "row 8 of the carrier's file, I think"; the traced answer opens row 8. Every time the answer is "I think", someone re-checks the claim against the PDF, and that re-checking is a cost the spreadsheet option carries forever.
The loss summary by year and line, with the missing year shown as a gap
What hidden costs come with loss run tools?
The costs that do not appear on a quote are the ones that decide whether the tool saves time in practice: exceptions, new layouts, integration, and the cost of an error the tool makes confidently. A trial on your own runs, timed, is the only way to see them.
Costs to price before signing
- New carrier layouts
How many of your prior carriers the tool already reads, and the minutes to confirm each new one.
- Exceptions per account
Faint figures, totals that do not tie, unknown status codes: how often, and who clears them.
- Expense errors
A tool that treats loss-only runs as including expense makes summaries look better than the account; ask how it decides.
- Re-checking
If figures cannot be traced, underwriters will re-check the large claims anyway, which keeps part of the manual cost.
- Integration
Broker mailbox, submission system, file template; who builds and maintains each connection.
- Pricing unit drift
Per-page prices rise with scanned and multi-page runs; model your real mix.
- Setup and parallel run
Weeks of staff time on mapping sign-off and testing against closed accounts.
- Exit
Whether the summaries, mappings and settings can be exported if you leave.
The parallel run is where these costs get measured rather than argued: two weeks of reading closed accounts both ways and comparing, which is described week by week in loss run automation: a six-week go-live plan. What to ask about the extraction itself, from scans to faint figures, is in loss runs AI.
What should loss run software include?
At minimum: reading every layout your prior carriers send, including scans; a confirmed mapping per carrier that settles expense and status; ties to each run's printed totals; policy-year matching against the application's prior carriers; and a summary by year and line with paid, reserve and incurred. Beyond that, three capabilities separate tools that save time from tools that move it.
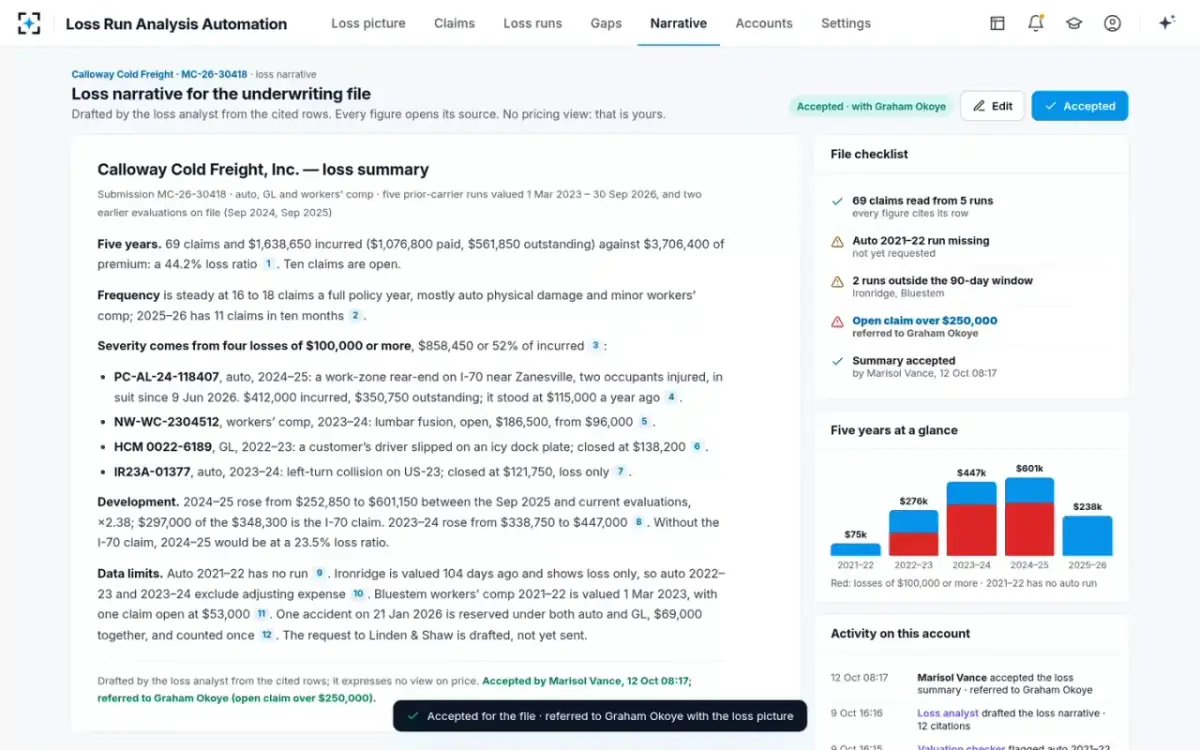
The first is traceability, every figure opening its cell, which removes re-checking. The second is lining up earlier evaluations, which shows reserve movement; on the sample account it surfaced one claim that went from $115,000 to $412,000 in a year. The third is a drafted gaps request, which turns the end of reading into the start of chasing. Loss Run Analysis Automation includes all three, and leaves out one thing deliberately: any view on price, credit or declination.
The output: a cited loss narrative, accepted and referred
Questions people ask
Is loss run software worth it for a small commercial desk?
Only if the accounts bring several runs each. At 250 five-carrier accounts a year the illustrative staff time freed is about $16,900, which a per-account price can easily exceed. A desk with mostly single-carrier accounts is usually better served by a good template.
What is a loss run analysis tool?
A loss run analysis tool reads prior carriers' runs and produces a loss summary by policy year and line: claim counts, paid, reserves, incurred, large losses and loss ratios. The better ones also show how reserves moved between evaluations and flag missing or stale runs.
Can loss run software integrate with a submission system?
Most can take runs from a broker mailbox or a file drop and export a spreadsheet; deeper integration is project work to scope and cost. Loss Run Analysis Automation takes runs from broker email and the submission, and returns the narrative in the carrier's template and the summary as a spreadsheet.
Should the business case count time saved as cost saved?
Only where the time leaves the payroll. More often it is redeployed to chasing gaps, reading large claims and quoting faster. Finance teams usually accept freed time as capacity, not cash.
How many loss runs does an underwriting desk read a year?
No government or academic source counts them, so the figure has to come from your own submissions: accounts a year times prior-carrier runs per account. A desk quoting 1,000 accounts a year whose submissions average four runs reads 4,000 runs. That product, not the account count alone, is what drives both the manual cost and most vendors' prices.
How do we compare two vendors' prices fairly?
Give both the same sample of recent submissions, with their real mix of scans, spreadsheets and multi-page reports, and ask for the total price per account on that sample. Time your own staff on the exceptions each tool raises during the trial.