Insurance commission rates vary by line of business, and the best public measure of them is what insurers report spending: in 2024, commission and brokerage expense was 11.11% of earned premium across all property and casualty lines, $80.7 billion, in the national Insurance Expense Exhibits that the Texas Department of Insurance compiles from NAIC data (TDI, 2024). Commercial lines ran higher (16.32% for commercial multiple peril, 17.22% for inland marine, 12.57% for commercial auto liability), workers' compensation lower at 9.45%, personal auto lower still at 7.69%, and surety highest at 29.01%. These are insurers' expense ratios, not any agency's schedule, which is why an agency checks its own rates line by line against the schedule each carrier agreed; Botminds' Insurance Commission Reconciliation does that on every statement line.
All industry figures on this page are from Section I of the 2024 exhibit: direct business, national data for the companies that write in Texas, calendar year 2024, published January 2026. Product examples are fictional sample data.
Commission and brokerage as a share of earned premium, by line, 2024
What are typical insurance commission rates?
Across property and casualty insurance as a whole, insurers' commission and brokerage expense was 11.11% of earned premium in 2024. By line, the 2024 exhibit puts most commercial lines between about 12% and 17%, personal auto under 8%, homeowners at 12.41% and workers' compensation at 9.45%. That spread is the first thing an agency should know about its own blended rate: it depends on its mix far more than on any one carrier.
The exhibit also shows how big the money is. On $746.6 billion of direct premium written and $726.4 billion earned, insurers incurred $80.7 billion of commission and brokerage expense in 2024. The table below gives the amounts for the lines most agencies write.
Premium and commission by line, 2024, national direct business
| Line | Premiums written | Commission and brokerage | % of earned premium |
|---|---|---|---|
| All P&C lines combined | $746.6bn | $80.7bn | 11.11% |
| Private passenger auto liability | $135.8bn | $10.2bn | 7.69% |
| Homeowners multiple peril | $120.9bn | $14.1bn | 12.41% |
| General liability, occurrence | $48.7bn | $5.6bn | 11.84% |
| Workers' compensation | $46.2bn | $4.4bn | 9.45% |
| Commercial multiple peril | $45.8bn | $7.2bn | 16.32% |
| Commercial auto liability | $39.3bn | $4.7bn | 12.57% |
| Inland marine | $34.2bn | $5.7bn | 17.22% |
| Surety | $10.6bn | $2.8bn | 29.01% |
How much commission do insurance agents make on commercial insurance?
On commercial lines, insurers spent between 11.84% (general liability written on an occurrence basis) and 17.22% (inland marine) of earned premium on commission and brokerage in 2024, with commercial multiple peril, the package policy most small businesses buy, at 16.32%. An agency's actual rate on a commercial account is whatever the carrier's schedule sets for that line and transaction, and often differs between new business and renewal.
What the agency keeps is not what the producer earns. The agency receives the carrier's commission, and its producers are paid a split of it under their own agreements; the Bureau of Labor Statistics reports that commissions are the most common form of pay for insurance sales agents, with the amount depending on the type and amount of insurance sold and on whether the policy is new or a renewal (BLS Occupational Outlook Handbook). How insurance agents are paid follows the money from the carrier's statement to the producer's.
What is the average commission on workers' compensation?
Insurers' commission and brokerage on workers' compensation was 9.45% of earned premium in 2024, below the all-lines figure, and 6.50% on excess workers' compensation. Workers' compensation is also one of the lines where premium moves after the policy is written, through payroll audits, so the commission an agency receives on it can change months after binding; an audit return premium can bring a chargeback with it.
Why is surety commission higher?
The exhibit reports that surety commission and brokerage was 29.01% of earned premium in 2024, with fidelity at 16.20%; it does not say why. Our reading is that surety premiums are small relative to the work of qualifying a principal, and that much of that work is done by the producer, but no source on our list measures it. What matters for reconciliation is that a high-rate line magnifies premium errors: a $10,000 mistake in the premium base costs $2,901 of commission at surety's 29.01%, and $945 at workers' compensation's 9.45%.
Where a dollar of earned premium went in 2024, across all P&C lines
Seen this way, commission is the largest expense after losses and their adjustment, larger than other acquisition costs and general expenses combined (10.89%). Because it is so large a share, a schedule revision paid late is real money on an agency's statement, not rounding.
Do commission rates differ by state?
The national exhibit cannot answer it, and its state section is built in a way that rules it out. For its Texas pages, the department explains:
"For this section, we multiplied the companies' earned premium in Texas by the nationwide expense ratio to get amounts not available from NAIC."
Texas Department of Insurance, 2024 Insurance Expense Exhibit, introduction
So the Texas expense figures repeat the national ratios by design. Whether a carrier pays different rates in different states is in its schedule, and some schedules do vary by state or program. An agency writing in several states should load each state's schedule where a carrier issues one, and check each line against the schedule for the state the risk is in.
What the 11.11% is, and what it is not
What the exhibit measures: Insurers' incurred commission and brokerage expense on direct business.
What it cannot tell you: What any agency was paid, or kept after producer splits.
What the exhibit measures: Companies that write in Texas, national data; farm mutuals, risk retention groups and state plans excluded.
What it cannot tell you: Insurers that do not write in Texas, or the excluded groups.
What the exhibit measures: A premium-weighted ratio for each line across all carriers.
What it cannot tell you: A schedule rate for any carrier, line, transaction or state.
What the exhibit measures: Both together.
What it cannot tell you: The difference between new business and renewal rates.
What the exhibit measures: A yardstick: an effective rate far below it on a line is a reason to check the schedule.
What it cannot tell you: Proof of an error: only the line-by-line check against the schedule shows that.
What is the difference between new and renewal commission?
New and renewal business can carry different rates: the BLS notes that commission depends on whether a sale is a new policy or a renewal, and a carrier sets each rate in its commission schedule, with effective dates. The public exhibits combine the two, so the only place to find the difference is the schedule itself. In the solution's fictional sample, one carrier's 2026 schedule paid 17.5% on new commercial package business and 15.0% on renewals, up from 12.5% on renewals in 2025.
One carrier's schedule: new business, this year's renewal rate and last year's
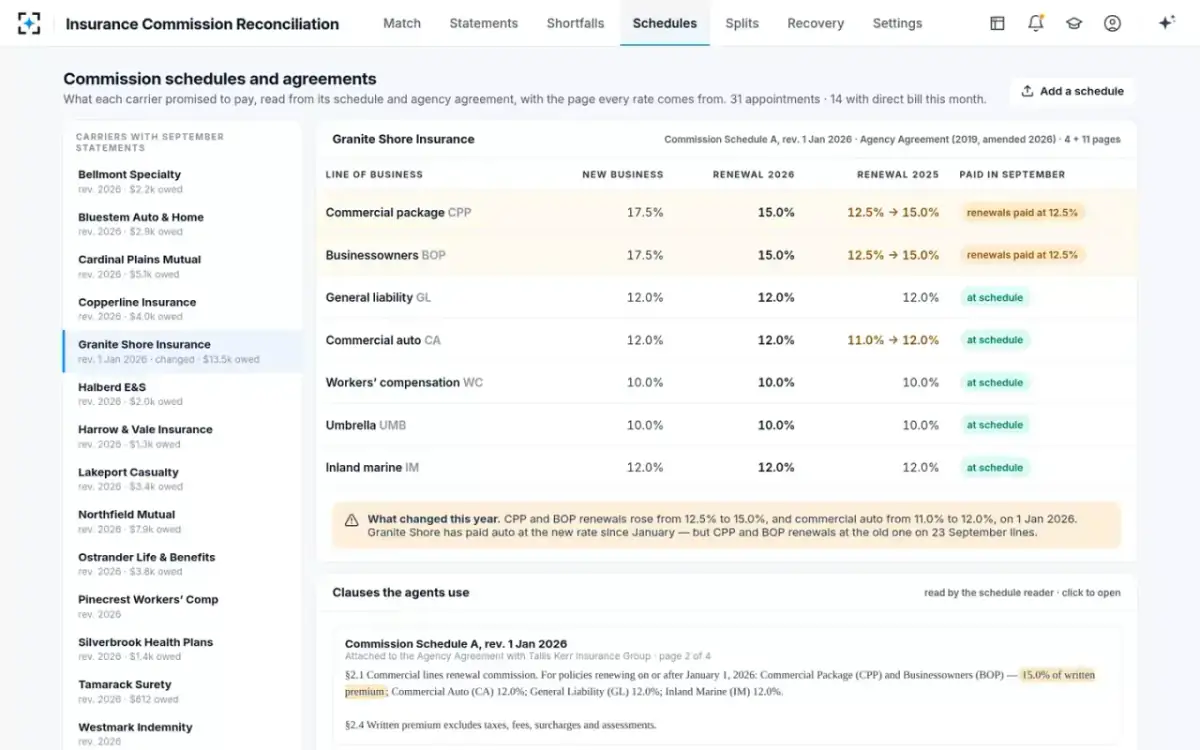
The renewal rate is where agencies most often lose money they never see. A renewal paid at last year's rate still looks paid: the line matches, the premium is right and the percentage looks normal. Only a check against the current schedule shows that 23 renewals on one statement in the sample were 2.5 points short. What each point of rate is worth on a whole book is worked out in the KPI guide.
Your effective rate against the yardstick, worked
An agency's effective rate on a line is the commission it received on that line in a year divided by the premium it placed. Set beside the exhibit's ratio, it shows where to look first. The example below is invented: a commercial book, four lines.
One invented agency's commercial book against the 2024 yardstick
| Line | Premium placed | Commission received | Effective rate | 2024 yardstick |
|---|---|---|---|---|
| Commercial multiple peril | $8.0M | $1,120,000 | 14.0% | 16.32% |
| Workers' compensation | $5.0M | $480,000 | 9.6% | 9.45% |
| Commercial auto liability | $4.0M | $460,000 | 11.5% | 12.57% |
| General liability, occurrence | $3.0M | $360,000 | 12.0% | 11.84% |
Two lines sit within a fraction of a point of the yardstick. Commercial auto is about a point under it, and commercial package 2.3 points under, about $186,000 a year on $8 million of premium. Neither gap is proof of error: the agency may write a lower-commission niche, or carry more renewals at lower rates. Each is a reason to pull that line's schedules for the year and check a month of renewals line by line, the check that in the solution's sample found 23 renewals paid at last year's rate on one statement.
Are insurance commission rates regulated?
The rules that apply to commission mostly govern who may be paid and what must be disclosed, not the rate. In the UK, the FCA's rule for commercial customers is short: "An insurance intermediary must, on a commercial customer's request, promptly disclose the commission that it and any associate receives in connection with a policy," and "Disclosure must be in cash terms (estimated, if necessary) and in writing or another durable medium" (FCA Handbook, ICOBS 4.4.1). In the US, New York requires an initial disclosure on every sale and the amount on request, and the NAIC's model law ties insurer compensation to written acknowledgment when the producer is also paid by the customer; who may be paid, and what must be disclosed sets those rules out.
Two other payments are sometimes called commission and are not in a schedule rate. Contingent or profit-sharing commissions depend on a year's results rather than a line's premium; contingent profit commission explains how they are earned and when they are paid. And the ceding commission a reinsurer pays an insurer is a reinsurance term entirely; sliding scale commission explains how it moves with losses.
Where can you find insurance commission data, and how should an agency use it?
The most detailed free source is the Insurance Expense Exhibit, which insurers submit with their annual statements to the NAIC and compiled each year by the Texas Department of Insurance for the companies that write in Texas. It reports commission and brokerage by line, with premium, losses and other expenses beside it, for direct and net business.
Use it in three steps. Compute your own effective rate by line: commission received on a line ÷ premium on it, for the year. Compare each with the exhibit's line ratio, remembering that your mix of carriers, transactions and states differs. Where your rate sits well below the yardstick, open the schedules for that line and check a month of statements line by line. A low effective rate is not an error by itself; a renewal paid at last year's rate is, and only the schedule shows which you have. To run that check on every line, start from Insurance Commission Reconciliation.
Questions people ask
What is the average insurance commission percentage?
Across all property and casualty lines, insurers' commission and brokerage expense was 11.11% of earned premium in 2024. It is a premium-weighted average across very different lines, from 7.69% on personal auto liability to 29.01% on surety.
What is the average commission on homeowners insurance?
Insurers' commission and brokerage on homeowners multiple peril was 12.41% of earned premium in 2024, on $120.9 billion of direct written premium. Individual carriers' schedules differ around that figure.
Is the 11.11% what agents earn?
No. It is what insurers spent on commission and brokerage as a share of earned premium. Agencies pay producers a split of what they receive, and a broker's income may also include fees and other compensation.
Do commission rates include contingent commissions?
A carrier's base schedule rate is separate from contingent or profit-sharing commissions, which are paid on a year's results. Check the exhibit's definitions before comparing it with an agency's total commission income.
Why do personal auto commissions run lower than commercial?
The exhibit reports that they do (7.69% on personal auto liability and 7.81% on physical damage in 2024, against 12% to 17% on most commercial lines) but not why. Our reading is that personal auto policies need less placement work per dollar of premium; treat that as a reading, not a finding.