Subrogation data analytics is the use of claim data to find recoverable claims and to measure how well an insurer recovers. The finding half usually works on coded fields: cause of loss, line of business, loss amount, vehicle count, a police-report flag. Those fields can say that a claim is the kind that is often recoverable. They almost never say who should pay, because the party is named in free text: the first-notice line "water heater burst", the adjuster's note "installed summer 2019 by Brightwater Plumbing", the garage-fire note's "e-bike battery was charging". A model built on codes ranks claims; only a reader of the notes names a party, and a named party is what a subrogation specialist can pursue. Botminds' Subrogation Identification reads every note, statement, report and photo caption for that sentence, and quotes it with every find.
The gap is easiest to see side by side. The left-hand column below shows how claims like these are typically coded; the right-hand column is what their files actually say.
What the claim code says, and the sentence in the file that names who should pay
The coded cause of loss: Water damage, plumbing
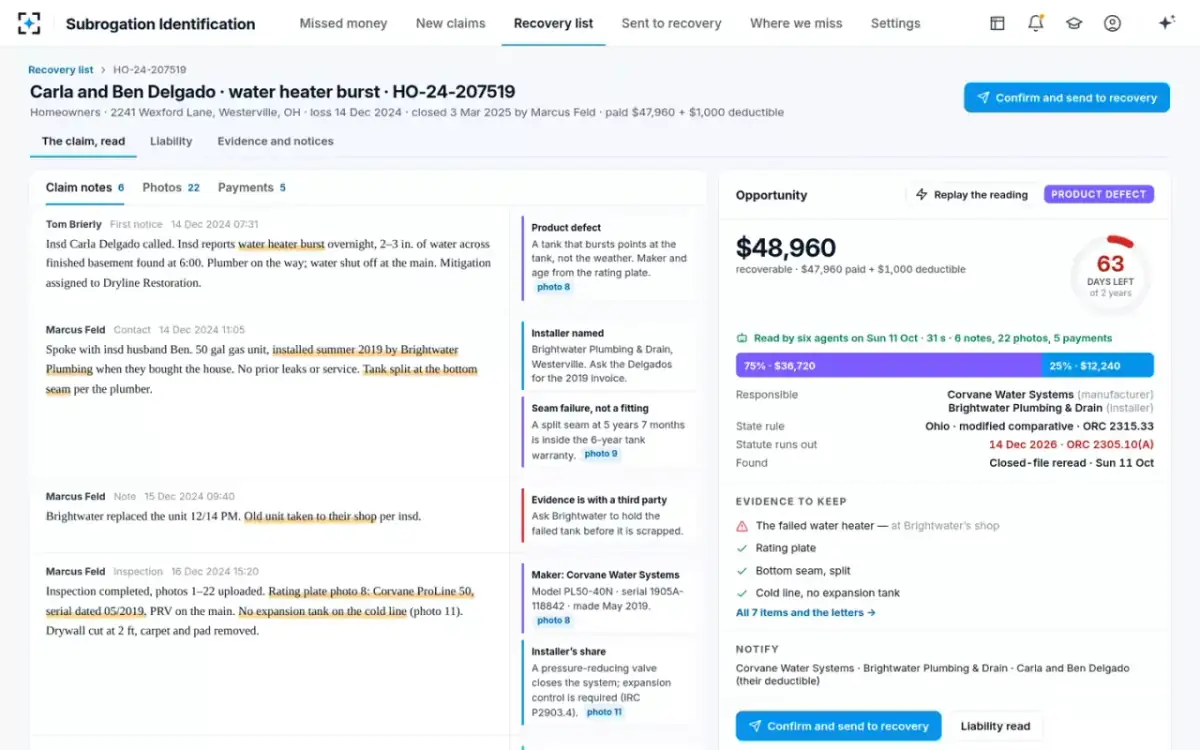
The sentence in the file: “installed summer 2019 by Brightwater Plumbing … Tank split at the bottom seam per the plumber.”
The coded cause of loss: Fire, electrical
The sentence in the file: “Fire started in the garage where the e-bike battery was charging; fire department report attached.”
The coded cause of loss: Fire, commercial property
The sentence in the file: “Fire started where the welder was cutting brackets on the mezzanine; no fire watch posted.”
The coded cause of loss: Water damage, appliance
The sentence in the file: “Dishwasher door seal failed — unit 14 months old, water under the kitchen floor.”
The coded cause of loss: Fire, residential
The sentence in the file: “Fire started at the adjoining unit’s grill on the shared deck.”
What is subrogation data analytics?
It covers two different jobs that share a name. One works claim by claim: which open or closed claims have another party who should pay, and which of those are worth pursuing first. The other works on the book: how much the insurer recovers against what it pays, by line and over time, and how that compares with other insurers. The first job needs the claim file. The second needs the annual statement and the insurer's own recovery accounts.
Most analytics programmes are built for the second job and then asked to do the first. That is where they disappoint. A dashboard can show that homeowners water claims are recovered less often than auto claims; it cannot tell a supervisor which of last quarter's water claims had a plumber in the notes.
Why do insurers miss subrogation?
Because the fact that names the other party arrives as a sentence, and nothing in the claim system turns a sentence into a field. Intake types it while the insured is on the phone. The adjuster codes the cause of loss for coverage and reserving, where "water damage" is the right answer. The closing note records the coverage outcome. Nobody re-keys "installed summer 2019 by Brightwater Plumbing" into a structured field, because there is no field for it, and so a model trained on the structured data never sees it.
The research literature has noticed the problem rather than solved it. Bisco and Fier write that salvage and subrogation "has largely been overlooked in the academic literature" (Journal of Insurance Regulation), and their own analysis, like most work on the subject, uses the annual statement, which reports recoveries by line and year but nothing about individual claims. The claim-level question is left to insurers and their own files.
What fields show subrogation potential?
Some coded fields raise the probability; only text and documents name the party. Cause of loss, loss location, the number of vehicles, a police or fire report on file, an item's age and the payment amount all help to rank claims. None of them says which installer, which maker or which tenant. The fields that do name a party, such as an at-fault vehicle's insurer, are usually filled only in auto claims, where the other party is obvious at the scene.
Coded fields that rank a claim, and the text that names the party
| Signal | Where it lives | What it can tell you |
|---|---|---|
| Cause of loss | Coded field | The kind of event: water, fire, collision. Rarely who caused it. |
| Third-party vehicle and insurer | Coded fields, mostly in auto | The party, when someone filled it in. |
| Item age and installation date | Notes, invoices, rating plates | Whether a product failed inside its warranty, and when its repose period started. |
| Who did the work | Notes, invoices, permits | The contractor or installer, and the date the work was done. |
| Where the water or fire started | Fire reports, plumbers’ reports, notes | The unit above, the neighbour’s grill, the city main. |
| The sentence itself | First notice, notes, statements, captions | The party, quoted, with a source a person can check. |
Can text mining find subrogation?
Yes, and the methods are now ordinary. Actuarial research has shown how transformer language models can turn insurance text into usable features: one tutorial works through car accident descriptions and a dataset of short property claims descriptions, and shows approaches for classification with little or no labelled data (Troxler and Schelldorfer, arXiv). The labelled-data point matters for subrogation, because few carriers have a clean history of "this claim was recoverable" labels; the claims that were never recognised were never labelled.
What text mining alone does not supply is the evidence a specialist needs. A classifier that says "73% likely recoverable" is a ranking. A reader that says "the adjuster's note of 14 December names the installer, and photo 8 is the rating plate" is a find, and it can be checked in seconds. Subrogation analytics should be judged by whether every flag carries its sentence and source.
The claim read as a document: each sentence marked, with a margin note beside it
What data predicts subrogation success?
At the level of the insurer, the research names organisational factors; at the level of the claim, the predictors are the facts a specialist would check. Bisco and Fier found that firm size, age, leverage, profitability, the decision to accrue anticipated recoveries and the importance of the line to the insurer were related to how quickly auto physical damage recoveries came in, and that group members recovered more slowly. Those are findings about insurers, not claims.
For a single claim, success depends on whether the party is named with its insurer, whether the evidence is held, whether the state's fault rule leaves the insured's share recoverable, whether the amount clears the cost of pursuit, and how much time is left. We know of no published, independent model that weights those factors across carriers. A carrier can learn its own weights from its closed files, provided the files the team never recognised are read first; otherwise the model learns only what the team already finds.
How do you score subrogation opportunities?
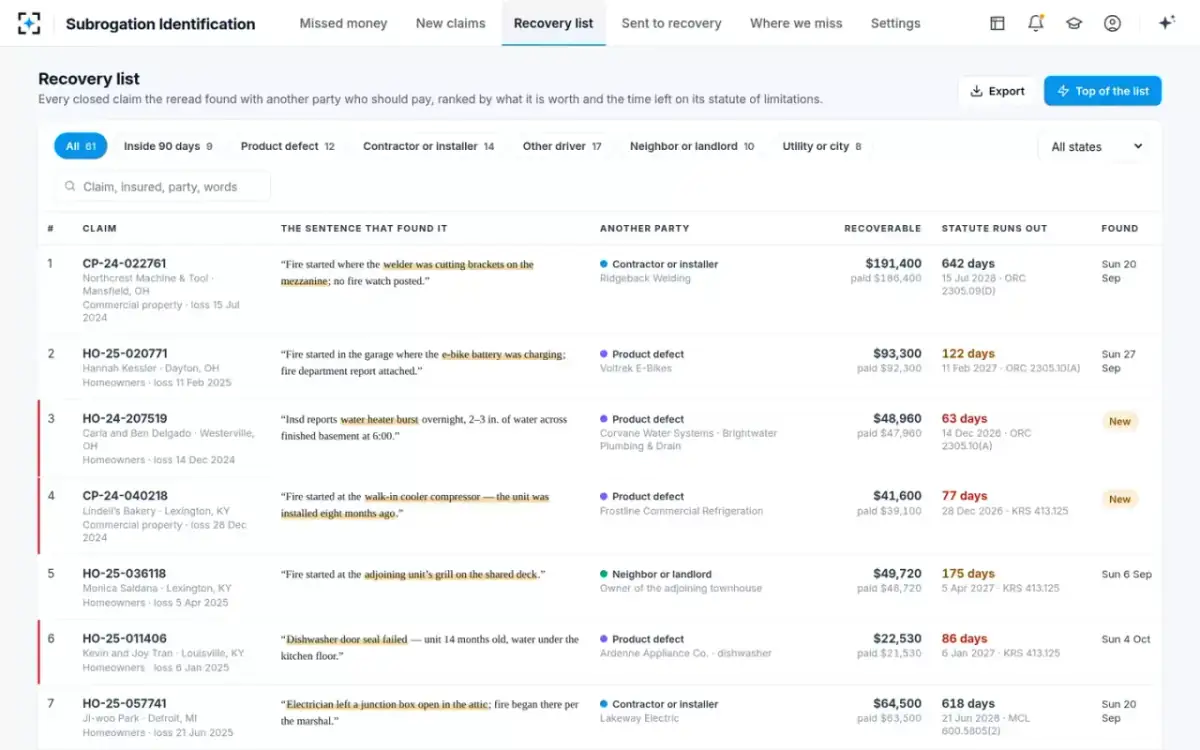
By money and time first, then by strength. A find worth $40,000 with 60 days left outranks one worth $90,000 with two years left, because the second will still be there next month and the first will not. Strength (a named party with an insurer, evidence held, a clear fault rule) decides whether the find is pursued at all, and a supervisor judges it with the sentence in view. In the solution, finds are ranked by recoverable money and time left on the statute, and anything inside the 90-day red band is surfaced first.
The recovery list, ranked by money and days left, each row quoting its sentence
Measure the book: where your recovery ratio sits
The book-level measure is recovery as a share of net claims paid, by line, and the published data give the scale. On auto physical damage, Bisco and Fier found the industry ratio rose from roughly 11% in 1996 to about 20% in 2021, one dollar back for every five paid. On auto liability the average over the period was 1.1% for commercial and 2% for personal lines. Those figures combine salvage with subrogation, which is why physical damage, with its sale of totaled cars, runs so much higher.
Salvage and subrogation recovered as a share of net claims paid, auto lines
A carrier can compute its own ratios from the same schedule and compare them by line. The comparison says whether the book is recovering; it cannot say why not. For that, the analysis has to go back to the claims, and specifically to the ones closed without a recovery attempt. How widely insurers differ on the all-lines ratio is shown in the subrogation department guide.
Where the money sits: by kind of party, not by line
Grouping finds by the kind of party responsible, rather than by line, shows where coded analytics are weakest. On the solution's sample carrier, the open finds from closed claims break down as follows.
Still recoverable in 61 closed claims at a sample carrier, by kind of party
Share of $1,286,580 recoverable
- Contractor or installer · 35.6%
- Product defect · 30.6%
- Neighbour or landlord · 13.3%
- Other driver · 12.9%
- Utility or city · 7.6%
Other drivers account for the most files, 17, and among the least money. Contractors and products account for two-thirds of the money in 26 files. That pattern is what you would expect if coded analytics work: auto claims with another vehicle are easy to flag from structured fields and are mostly caught early, so what is left in closed files is the expensive property claims whose party lives only in the notes.
Measure early catch, team by team
The most useful number for coaching is not how many recoveries a book makes but how many were flagged at first notice rather than found later. A recoverable claim flagged at first notice keeps its evidence and its full clock; one found in a closed-file reread has lost months of both. The solution's sample carrier reports it by team for losses from October 2024 to September 2026.
Recoverable claims flagged at first notice, against those found later, by team at a sample carrier
| Team | Claims closed | Flagged at first notice | Found later | Caught early |
|---|---|---|---|---|
| Auto physical damage | 9,460 | 1,104 | 27 | 98% |
| Indianapolis property | 3,910 | 141 | 19 | 88% |
| Columbus property | 6,842 | 212 | 31 | 87% |
| Michigan property | 2,874 | 88 | 14 | 86% |
| Small commercial | 1,218 | 46 | 8 | 85% |
The pattern is the one the rest of this guide predicts. Auto physical damage, where the other driver is named at the scene and often in a coded field, catches 98% early. Property and small commercial, where the party hides in the notes, catch 85–88%, and the remainder are the claims that a closed-file reread exists to find. A team whose early-catch rate falls is a coaching conversation; the phrases that should have stopped each miss are the material for it.
Fire claims show the limit of cause codes
Fire is where a cause code is most precise and least helpful for subrogation. The U.S. Fire Administration estimates $1.5 billion of residential building fire dollar loss from electrical malfunction in 2023, and a 28% increase in that loss over 2014 to 2023 (USFA); it counts 23,700 electrical malfunction fires in residential buildings in 2023 (USFA). "Electrical malfunction" is a cause category. Whether the malfunction was a charger, a battery, an appliance or an electrician's unfinished work, and so whether there is a maker or a contractor to pursue, is in the fire report and the adjuster's notes.
Questions that separate useful subrogation analytics from a dashboard
- Does every flag quote its sentence and source?
If not, a supervisor cannot confirm it without rereading the file.
- Does it read closed files, not just new ones?
The recoveries still in time are in last year’s closings.
- Is it trained only on claims the team already recognised?
Then it learns the team’s blind spots along with its successes.
- Does it rank by time left as well as money?
A find in its last 90 days needs action this week.
- Does it group misses by how they were closed?
“Wear and tear” and “sudden and accidental” hide different misses, and need different coaching.
- Can it be scored on a replay of your own closed claims?
Against how each file actually ended.
Where Subrogation Identification fits is the claim-level half: it reads every note, statement, report and photo caption on new and closed claims, names the party, ranks by money and time left, and shows the sentence with every find. A supervisor confirms each one. What the reader should do when the sentence names a kind of party but not the party is set out in what subrogation potential means.
Questions people ask
How do insurers use analytics for subrogation?
Most score claims on coded fields such as cause of loss and amount to decide which to review, and track recovery ratios by line from their own statements. The newer step is reading the free text of notes and reports, where the party who should pay is actually named, and quoting it with each find.
What is a subrogation model?
A model that estimates whether a claim has another party who should pay, and sometimes how much can be recovered. Models built on coded fields rank claims by likelihood; models that read text can name the party. Either should be tested on the carrier's own closed claims against how they ended.
What is a good subrogation recovery ratio?
It depends on the line. On auto physical damage, salvage and subrogation together returned about 20% of net claims paid industry-wide in 2021; on auto liability the long-run average was 1–2%. Comparing a book against its own lines over time is more useful than one industry figure.
Where do insurers report subrogation recoveries?
In the statutory annual statement, in Schedule P, where salvage and subrogation received are reported by line. Bisco and Fier's study uses Parts 1J, 1B and 1C for auto physical damage and the two auto liability lines.
Can machine learning replace subrogation referrals?
It can replace the habit of waiting for an adjuster to refer, by reading every claim. It should not replace the supervisor's decision: each find needs its sentence, its party and its deadline checked by a person before anyone pursues it.
What data do you need to start subrogation analytics?
For the book: recoveries and paid losses by line and year. For claims: read-only access to notes, statements, police and fire reports, invoices, permits and photo captions on new and closed claims, plus the state rules that turn a find into a deadline.