A cat modeling analyst prepares a property insurer's exposure data for catastrophe models, runs those models for hurricane, earthquake, flood, wildfire and severe storm, and turns the output into numbers an underwriter can price with: average annual loss, probable maximum loss, and how a new account changes the book's accumulation. In practice, a large share of the week goes on someone else's spreadsheet. Before a model can run, every location on the broker's schedule of values has to be placed on the right building and coded for construction, occupancy, year built and value, and broker schedules rarely arrive that way. Botminds' Schedule of Values Validation exists for that part of the job: six agents read the schedule in any layout, place each address on the roof or the parcel, check its construction, occupancy, protection and exposure against public and purchased records, and hand the analyst a model-ready file in which every unknown is marked as unknown.
The week on this page is a composite, and its hours are our estimate, not a survey. The screens come from the solution's sample data, a fictional 42-location logistics renewal. The research comes from the NAIC, Florida's hurricane model commission and peer-reviewed geocoding studies, linked where they appear.
A renewal-season week: most of today's hours go on the schedule, not the model
- Geocoding and fixing addresses12 h
- Coding construction, occupancy, year built6 h
- Chasing answers3 h
- Model runs and checks8 h
- Results with underwriters6 h
- Portfolio accumulation5 h
- Review pins, code exceptions, answers3.5 h
- Model runs and checks10 h
- Testing the unknowns8 h
- Results with underwriters9 h
- Portfolio accumulation9.5 h
What does a cat modeling analyst do?
A cat modeling analyst runs and explains catastrophe models, and the first half of that job is data. The NAIC's description of the tool names its four components, hazard, vulnerability, exposure and financial, and puts the insurer's own portfolio in the exposure module: each building's location, its risk characteristics and its insured values (NAIC, Catastrophe Models (Property)). The model needs three things from the insurer: where each building is, what it is made of and used for, and what it is insured for. Everything else, the wind fields, the flood depths and the damage curves, comes from the model.
The analyst's outputs feed decisions with real money behind them. The NAIC's catastrophe modeling primer notes that average annual loss "is synonymous with pure premium or expected loss" and is "the most common metric used in catastrophe ratemaking and pricing." It also records that in 2017 the NAIC added a specific charge for hurricane and earthquake risk to the property and casualty risk-based capital formula, calculated from the 100-year probable maximum loss of listed vendor models (NAIC Catastrophe Modeling Primer, exposure draft, December 2024; the Property and Casualty Insurance Committee adopted the primer on 13 August 2025). An analyst's exposure file therefore touches price, reinsurance and capital at once.
On a commercial property desk the job splits three ways. For a new or renewing account, the analyst prepares the broker's schedule, runs it and tells the underwriter what the account adds to average annual loss and to the tail. For the portfolio, the analyst tracks accumulations by zone and peril. And for reinsurance and capital, the analyst produces the runs that buyers, rating agencies and regulators read. Only the first lands on a deadline set by a broker.
A renewal-season week, hour by hour
In a busy week the schedules arrive faster than the analyst can clean them. Take the composite week in the figure above: three renewals of about forty locations each, quotes due Friday. Monday and Tuesday go on the first two schedules. Each one arrives in the broker's own layout, often several tabs, with the year built in a notes column, construction described in words rather than classes, and some addresses that are a street with no number. The analyst runs them through a geocoder, sorts the results by match quality, and starts on the ones that did not land on a building.
Wednesday is the third schedule and the questions. Every location the analyst cannot place or code becomes an email to the underwriting assistant, who forwards it to the broker. Thursday, finally, the models run: one or two vendor models per peril, a check that the totals reconcile to the schedule, and a look at which locations drive the loss. Friday is with the underwriters, explaining why one account's loss cost moved and another's did not. Portfolio accumulation work gets what is left.
None of the clean-up is waste. It is the step that decides whether Thursday's numbers mean anything. The point of the week on this page is not that the analyst is slow; it is that the most skilled person on the property desk spends half the week as a data clerk because nobody upstream checks the schedule.
Why the exposure file decides the answer before the model runs
The model cannot correct a wrong input; it can only fill a missing one with an assumption. The NAIC primer is direct about the mechanism: "Catastrophe models include a framework to use default assumptions to fill in some of the missing information, such as the use of a default year band based on the occupancy in a certain geographical area using the model vendor’s proprietary building inventory database. However, the uncertainty of the modeled output increases when the input data is not accurate or has material gaps and relies on assumptions."
While exposure values are essential to the modeling process, obtaining consistent and accurate values remains challenging. These values also need to be adjusted periodically to account for inflation trends.
NAIC Catastrophe Modeling Primer, exposure draft (December 2024)
Florida, where an insurer may use a hurricane model in a residential rate filing only if the state's commission has found it accurate or reliable, writes the same point into its standards. "Hurricane model outputs, including hurricane loss costs, are sensitive to insured exposure locations," the Florida Commission on Hurricane Loss Projection Methodology says in the purpose of its insured exposure standard, which is why "Appropriate methods must be used when converting street addresses to geocode locations" (Hurricane Standards Report of Activities, as of 1 November 2025, standard A-3). The standard is written for the model builders, but the input it is protecting is the one an analyst hands over every week.
The practical result is that two analysts running the same model on the same account can produce different losses because one fixed the schedule and the other did not. A location left on a postal-code centre draws the hazard of that centre, not of the building. A warehouse coded as frame because nobody knew better is modeled as frame. A building value that has not moved since 2019 sets the size of every modeled loss at that location.
The ZIP centroid problem in someone else's spreadsheet
A ZIP centroid is a stand-in, not a location. When an address cannot be matched to a building, a parcel or even a street segment, geocoders fall back to the centre of the postal code, and the model then reads hazard at that point. Florida's commission sets a rule even for the fallback: "ZIP Code centroids, when used in the hurricane model, shall be based on population data." A population-weighted centre sits where people live, which for an industrial port location may be kilometres from the building.
The size of the gap is well measured for street geocoding, the next step up. In a peer-reviewed study of 3,000 residential addresses in upstate New York, the largest errors, over 5 km, came from the reference data rather than the method: "It appeared that many of these large errors are due to inaccurate ZIP code boundary information in the software's reference files" (Cayo and Talbot, International Journal of Health Geographics, 2003). A later letter in Environmental Health Perspectives by the geographer Paul Zandbergen summed up the literature: "street geocoding in general is not very accurate" (Zandbergen, 2010). Both studies used homes, not warehouses, and they are dated; the direction of the finding is what matters to an analyst. How to measure geocoding accuracy on a property schedule sets out the full error tables and the five measures worth reporting.
The exposure file the analyst receives: placement shown, unknowns kept unknown
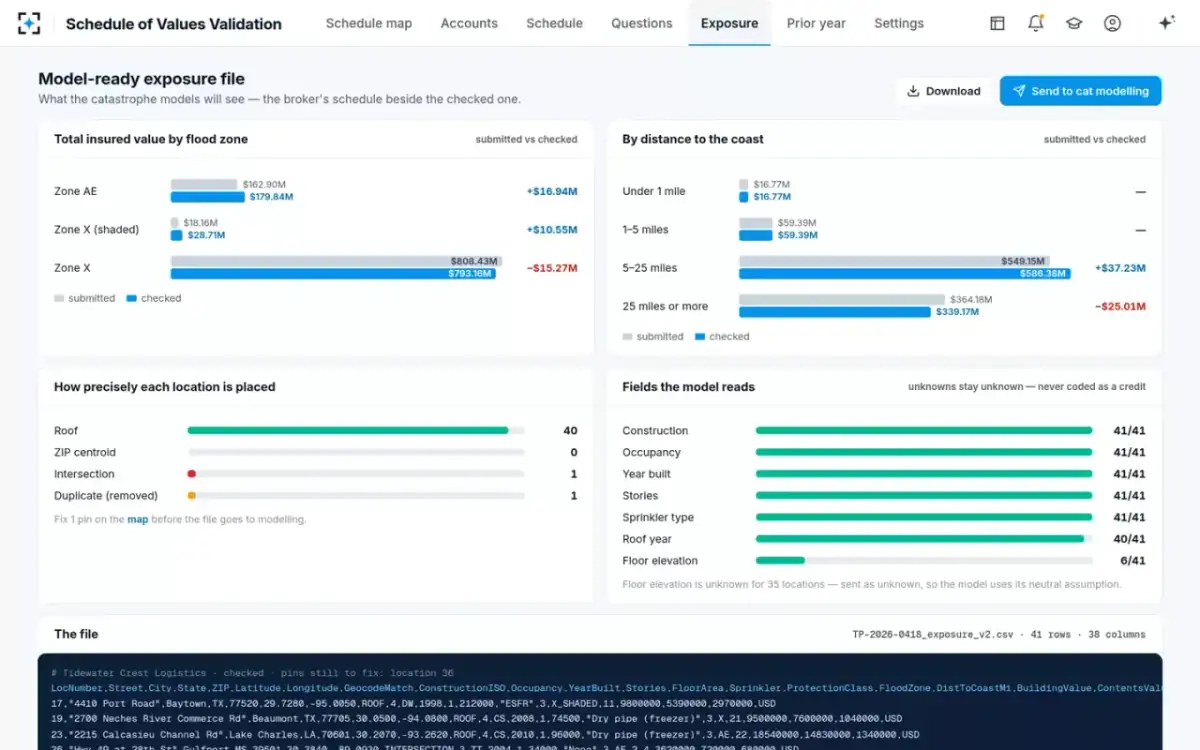
In the sample renewal on this page, location 23 is a cold store on a ship channel in Lake Charles, Louisiana. Its address was not in the address file, so it matched only the 70601 ZIP centroid, in flood Zone X. The building it describes is 5.6 km west, on the channel, in Zone AE with a base flood elevation of 8 feet. Moved by the underwriter onto the roof, the location takes $34.71M of value into the high-risk zone. Nothing in the spreadsheet would have shown the difference; only the map does.
Coding construction and occupancy without inventing a credit
Construction and occupancy are the two characteristics every vulnerability curve depends on, and a broker schedule gives them in words. "Tilt-up, steel roof," "concrete block," "warehouse/office" all have to become the classes the model reads. The NAIC primer lists the variables the damage functions turn on: occupancy, construction, age and height, "and many more, such as the age of roof, roof to wall connection and opening protection." The analyst's job is to code what the schedule supports and leave the rest as unknown.
The temptation runs the other way. A field coded with a favourable value, such as a newer roof or a better construction class than the evidence supports, lowers the modeled loss; a field left blank lets the model use its own default. Regulators know the difference. Among the questions the NAIC primer suggests a department ask in a rate filing: "Describe which data is real/actual and which data is the result of default coding." The honest file is the one that can answer it location by location. COPE in insurance underwriting walks through the four letters an analyst codes and the public sources that can check each one.
Seven checks before an exposure file leaves the analyst
- Every location placed, and its placement precision stated
Roof, parcel, street, intersection or postal code, per location, so the reader knows which losses rest on a guess.
- No location still on a postal-code centre without a reason
If one must stay there, it is named, with its value, at the top of the file.
- Duplicates removed by building, not by row
Two rows on one parcel double the value in one place; matching on the parcel catches it.
- Construction and occupancy coded from evidence
A survey, a permit or a property record behind each class, or the field left unknown.
- Unknown left unknown
No blank coded as a favourable value, so the model uses its neutral assumption.
- Total insured value reconciled to the schedule
Submitted and checked totals side by side, with every difference explained.
- Values tested against the cost to rebuild
A value far below the rebuild cost shrinks every modeled loss at that location.
The one input a cat modeler cannot check alone: the value
Location and construction can be checked against maps, permits and surveys; value is the input an analyst usually takes on trust. The model reads the insured value as the size of the building, so a value that has been rolled forward at a few percent a year while rebuilding costs rose by half shrinks every modeled loss at that location. That is the NAIC primer's point about values needing periodic adjustment for inflation, and it is the hardest one to act on from the modeling desk, because the analyst does not own the value and cannot change it.
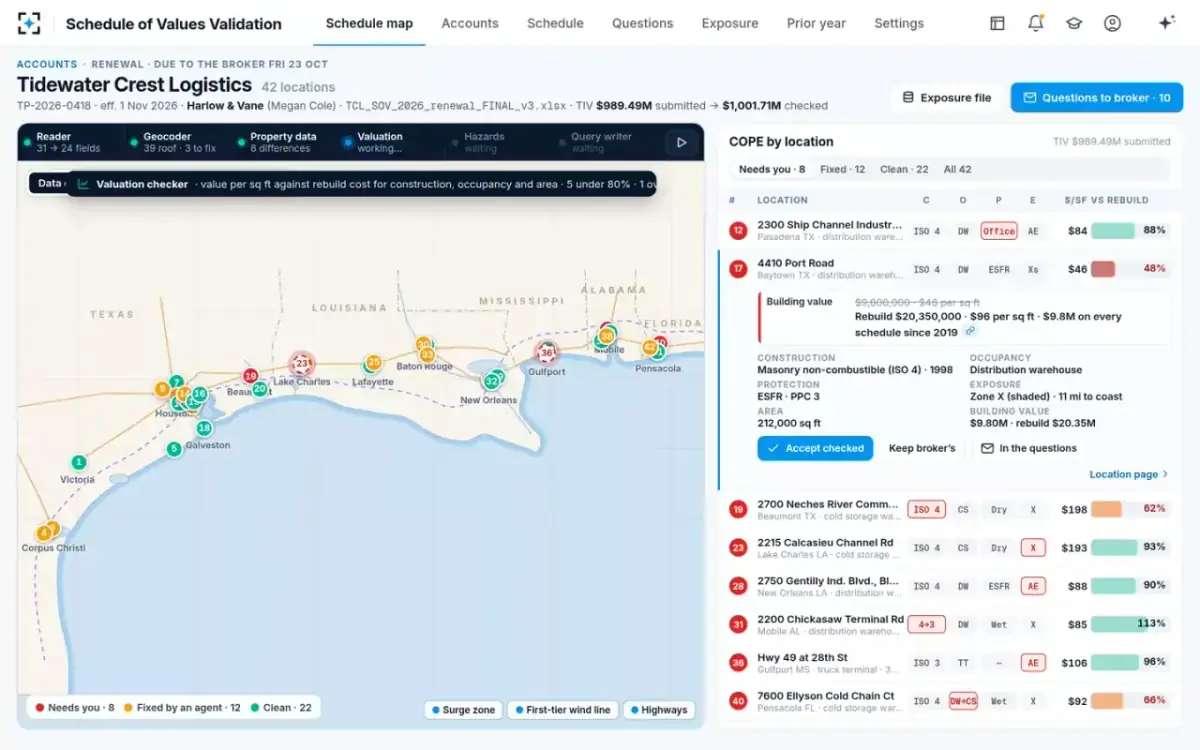
What the analyst can do is see it. In the sample renewal, a 212,000 square foot distribution warehouse in Baytown, Texas, carries $9.8M, $46 a square foot, the same figure on every schedule since 2019. Against the carrier's own rebuild cost table it should be about $20.35M. Modeled at $9.8M, its loss estimates start from a building half its real size, before anyone has argued about the wind. How far a 2020 building value has slipped uses the public producer price indexes to show the size of that gap across building types.
Where the hours go once agents do the clean-up
The time freed is not idle; it moves to the work only an analyst can do. In the illustration, clean-up falls from just over half the week to under a tenth. The analyst still reviews every pin the agents could not place on a roof, and still codes the exceptions, but no longer re-keys a layout or geocodes a list by hand.
Share of an analyst's week by kind of work, illustrative
Today
- Fixing the schedule · 52%
- Model runs · 20%
- Results with underwriters · 15%
- Portfolio · 13%
With agents
- Fixing the schedule · 9%
- Model runs · 25%
- Testing the unknowns · 20%
- Results with underwriters · 22%
- Portfolio · 24%
Two new pieces of work fill the space. The first is testing the unknowns: running the account with unknown floor elevations or roof ages at the model's default and again at a plausible worse case, so the underwriter sees how much of the loss rests on missing data. The second is the portfolio view that renewal season usually crowds out. In the sample renewal, 35 of 41 locations have no floor elevation; that is a question for the broker, and a sensitivity run for the analyst, not a field to fill.
The agents' run, as the analyst sees it start
What software do cat modeling analysts use?
Analysts use four kinds of software, and only one of them is the catastrophe model. The vendor models do the simulation, and regulators read their output; in Florida, statute requires an insurer to use hurricane models the state's commission has found accurate or reliable when it files residential rates. Around them sit a geographic information system for mapping and spatial joins, a geocoder, and the exposure database that holds every location the insurer writes. The fourth, in most shops, is the spreadsheet in which broker schedules are reshaped before any of the others can read them.
Public tools exist too. FEMA's Hazus, which FEMA calls a "nationally applicable loss estimation methodology," covers earthquake, flood, hurricane and tsunami, with a national building inventory classed by occupancy and building type (Hazus Inventory Technical Manual, Hazus 6.0). FEMA built it for emergency response, recovery planning and mitigation, not for pricing a policy, but its occupancy classes and construction descriptions are a useful reference for coding a broker's words into classes a model can read. How modeling software differs from the software that handles the claims after an event is set out in catastrophe modeling software compared with catastrophe claims management.
The spreadsheet is the one worth replacing. Schedule of Values Validation reads the broker's layout as it arrives, maps it to the carrier's fields using last year's confirmed mapping for that broker first, and produces both the cleaned schedule and the exposure file the models read. It does not run the catastrophe model, choose its settings or interpret its output; those stay with the analyst. Which fields an agent may change, and which it may only propose, is set out field by field elsewhere in this series.
Cat modeler or actuary, and how people get into the work
A cat modeler and an actuary use some of the same output for different questions. The actuary builds the rate and reserves for the whole line, using catastrophe model output as one input among many; the cat modeling analyst produces that output and answers for the data behind it, location by location. The NAIC primer draws the boundary in its own terms: catastrophe models "are exposure-based and do not use historical claims data or claims experience from a specific location or policy being modeled." Claims history is the actuary's ground; exposure is the analyst's.
People reach the job from geography and GIS, engineering, meteorology, statistics and actuarial work, and from underwriting. What they need in common is comfort with spatial data, a working knowledge of how buildings are built, and the patience to treat a broker's spreadsheet as evidence rather than fact. Regulators' own training has grown with the field: the NAIC's committee summary describes the primer as a bridge to available training from the Center for Insurance Policy and Research's Center of Excellence.
The data side of the job is also where its standing comes from. An analyst who can say, for every location, how it was placed and what was assumed is the person an underwriter, a reinsurer and an examiner will all believe. To see how the sample renewal reaches a model-ready file, start from Schedule of Values Validation.
Questions people ask
What is geocoding in cat modeling?
Geocoding turns each address on a schedule into latitude and longitude, and records how precisely it was placed: on the building, the parcel, the street, or only the postal-code area. The model reads hazard at that point, so a weak match changes the answer. The NAIC primer notes that models distinguish high-resolution matches such as street, building or parcel from low-resolution ones such as postal code or city.
How long does it take to prepare an SOV for a cat model?
No government or academic source publishes a figure, and it depends on the layout, the number of locations and how much is missing. The product team's estimate for one 42-location sample schedule is about 20 working hours by hand across re-keying, geocoding, checking construction and values, and writing questions, of which about four hours are geocoding. The design target with the agents is about an hour for the whole schedule.
Do catastrophe models use an account's claims history?
No. Catastrophe models simulate events against the exposure, the location, construction, occupancy and value of each building, rather than projecting the account's own past losses. That is why the exposure file matters so much: the model has nothing else about the account to go on.
What is average annual loss?
Average annual loss is the mean of the modeled losses across all simulated years, the long-run expected loss in any one year. The NAIC primer calls it synonymous with pure premium or expected loss and the most common metric in catastrophe ratemaking. Probable maximum loss, by contrast, describes the tail, such as the 1-in-100-year loss.
Is cat modeling a good career?
It is a specialist role that regulation keeps central. The NAIC has carried a catastrophe charge for hurricane and earthquake in its risk-based capital formula since 2017, and models for wildfire and severe convective storm were adopted for informational reporting for 2023 and 2024 year-end. Every one of those numbers starts with an exposure file someone has to prepare and defend.