A commercial building valuation tool, for insurance, estimates what it would cost to rebuild a building at today's prices, its replacement cost, so that the insured value on the schedule can be tested against it. There are four common ways to do that: trend the old value with a construction cost index, apply a cost-per-square-foot table for the building's type and area, commission an appraisal, or run a check against cost tables on every location at every renewal. They often agree about a given building; they differ in how many buildings they reach, what errors they can see, and what trail they leave behind. Botminds' Schedule of Values Validation is the fourth kind: its valuation checker compares each building's value per square foot with the cost to rebuild that construction and occupancy in that area, using the carrier's own cost tables, and shows the underwriter the build-up and its source. It does not replace an appraisal; it tells the underwriter which buildings need one.
Public sources anchor the comparison: FEMA's own replacement cost table, the BLS construction price indexes and North Carolina's guidance to the agencies that insure its state buildings. The worked examples come from the solution's sample data, a fictional 42-location Gulf Coast logistics renewal.
Four ways to check a commercial building value, compared
| Index trending | Cost-per-square-foot table | Appraisal | Per-location checks every renewal | |
|---|---|---|---|---|
| What it does | Multiplies the last value by an index ratio | Area × cost for the type, class and location | A valuation professional estimates one building, often after a visit | Value per square foot against a cost table, for every row, with stale values flagged |
| Buildings reached | Every location | Every location with a reliable area and type | A chosen few | Every location |
| Cost per location | Near zero | Low | High | Low |
| Sees a wrong area or occupancy | No | Only if the inputs were checked | Yes, on the buildings visited | Yes, where permits, records or surveys show it |
| Sees a wrong starting value | No: it trends the error | Yes | Yes | Yes |
| Trail it leaves | Index series and dates | The table, the inputs, the date | The report | The table, the inputs, the source of each input, and who decided |
| Best used for | Keeping a sound value current between estimates | Screening a schedule | High-value, unusual or flagged buildings | Choosing which buildings need the other three |
What is the best commercial building valuation tool for insurance?
The best one is the combination that reaches every building and spends the expensive method only where it is needed. No single approach does both. An index reaches every building but cannot see the building; an appraisal sees the building but reaches only a few. The question to ask of any tool is therefore not "how accurate is it" in the abstract, but "which errors can it see, on how many of our buildings, and can we show our work afterwards."
Showing the work is not optional where regulators have written it down. FEMA's flood program, for example, lets insurers obtain a non-residential building's replacement cost "by using common industry practices," but requires that "The method or documentation used to determine the Building Replacement Cost Value must be maintained in the policy underwriting file by the insurer," and that the insurer "review (and update if any changes) the Building Replacement Cost Value information at least every 3 years" (FEMA NFIP, Risk Rating 2.0 simple guide for non-residential buildings). A commercial property desk outside the flood program is not bound by that rule, but it is a fair description of a defensible file.
Index trending: every location, blind to the building
Trending is the cheapest check and the most widely used, and it only works if the starting value was right. Multiply the value by the index at the test date over the index at the date the value was set: a warehouse valued at $10.0M in January 2020 trends to about $15.05M in September 2026 on the BLS warehouse construction index, which rose from 162.6 to 244.738 (U.S. Bureau of Labor Statistics, via FRED).
What trending cannot do is see the building. An addition the schedule never recorded, a warehouse that became a cold store, a value that was half the rebuild cost the day it was set: each is trended faithfully and stays wrong. Trending is the right tool for keeping a sound value current between estimates, and the wrong one for finding an unsound value. The 2026 construction cost indexes by building type gives the series to trend with.
Cost-per-square-foot tables: what FEMA's public table shows
A cost table turns area, construction, occupancy and location into a rebuild cost, and FEMA publishes one. Its Hazus loss-estimation inventory carries a "Default Full Structure Replacement Cost" per square foot for each occupancy class, in 2022 dollars, derived from industry-standard cost-estimating models: $135.47 for a typical 30,000 square foot warehouse, $162.65 for a 30,000 square foot factory, $204.43 for a mid- to high-rise office (FEMA, Hazus Inventory Technical Manual, Hazus 6.0, Table 6-2).
FEMA's default replacement cost per square foot, by occupancy, 2022 national average
FEMA's own caveats are the caveats of every cost table. "It should be noted that the replacement costs provided in Table 6-2 are an average replacement cost by occupancy," the manual says; each occupancy is a single typical building, and "The replacement value model tables provide average national costs," localised by county factors. A 212,000 square foot tilt-up distribution centre and a 30,000 square foot block warehouse share an occupancy code and not much else. A table is a screen: it shows which buildings are far out of line, not what any one of them is worth.
Tables also age. Bringing a 2022 table to September 2026 prices on the BLS warehouse index adds between about 6% and 18%, depending on which month of 2022 the table reflects (the index stood at 207.766 in January 2022 and 231.276 in September 2022; our arithmetic). A cost table without a date on it is a guess about which.
Do you need an appraisal for commercial property insurance?
Not for every building, and not every year, but for some buildings a cost table cannot value. North Carolina's guidance to the agencies insuring state buildings puts it simply: "For older buildings that are purchased or otherwise acquired, an appraisal may be necessary to arrive at the insurance replacement cost," while for new buildings "the cost of construction is typically the replacement value for the building at that point in time" (NC Office of State Fire Marshal, State Property Fire Insurance Fund).
The same guidance draws the distinction that most often confuses valuation for insurance: "Keep in mind that the replacement value for buildings is not the same as the market value. Market value is used to determine the sales value of property at a point in time. This is what a willing buyer will pay a willing seller. The replacement value for insurance purposes is the cost to rebuild the structure at the time of loss with one of like kind and quality." A real estate appraisal answers the first question; an insurance valuation answers the second. A warehouse in a weak market can be worth far less than it costs to rebuild, and an insured value taken from a purchase price can be badly short.
Appraisals earn their cost on high-value, unusual or historic buildings, on buildings whose use has changed, and on buildings a screen has flagged. Spent on a sample chosen at random, they find what a cost table would have found for less.
Checking every location every renewal, with the source on screen
The fourth approach applies a cost table to every row, but only after checking the inputs the table depends on, and keeps the evidence. In Schedule of Values Validation, the valuation checker compares each building's value per square foot with the cost to rebuild that construction and occupancy in that area, using the area and occupancy the property data checker confirmed from records, permits and surveys rather than the broker's figures. It flags values under 80% of rebuild, values over 130%, and values unchanged for three schedules or more; all three thresholds are the underwriting leader's settings, and the cost table is a setting too: the carrier's own tables or a licensed valuation service.
The sample renewal shows why checking inputs first matters. A cold store in Beaumont, Texas is listed at 48,000 square feet; a 2021 building permit added a 26,500 square foot freezer, so the checked area is 74,500. A cost table run on the broker's area would have under-stated its rebuild cost by about a third and called the building adequately insured. On the checked area, its $9.5M value is 62% of a $15.32M rebuild estimate, and the question goes to the broker with the permit attached.
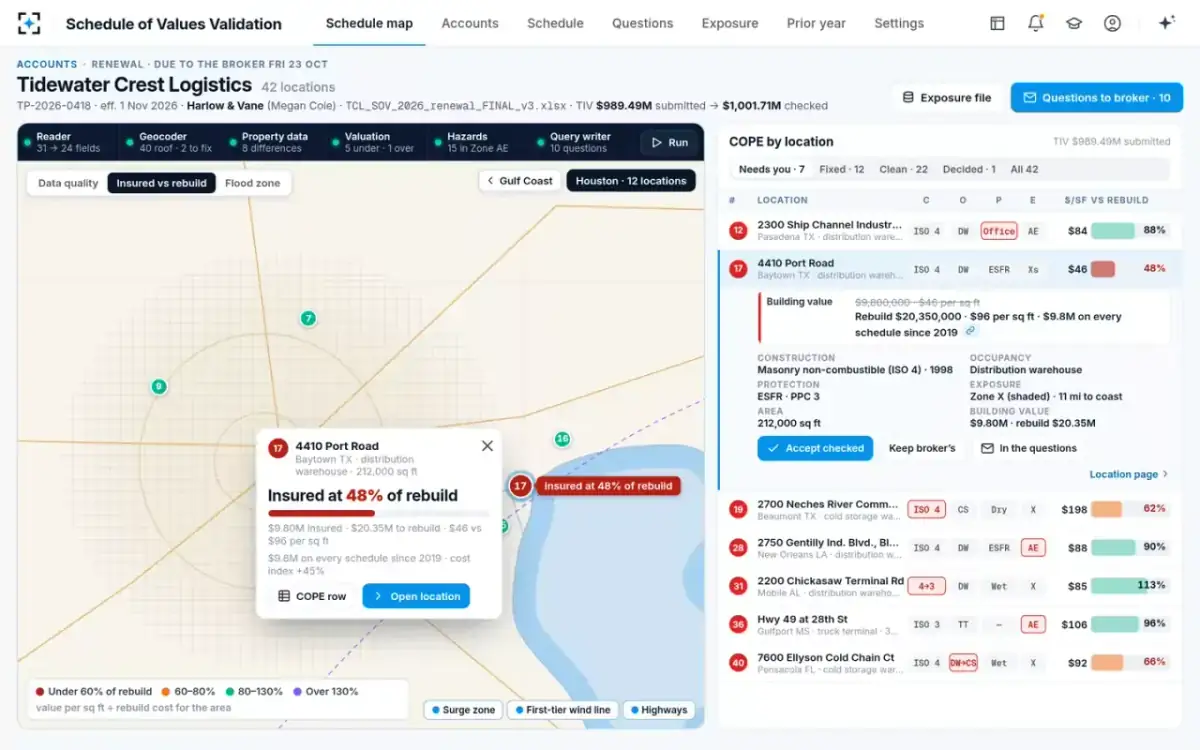
Baytown: $46 a square foot insured against $96 to rebuild
What each approach would have caught on the sample schedule
| Finding on the sample schedule | Index trending | Cost table on broker inputs | Appraisal of a few buildings | Per-location checks |
|---|---|---|---|---|
| Baytown warehouse, $9.8M since 2019: 48% of rebuild | Only if the original value was known to be sound, which it was not | Yes | Only if chosen | Yes, with the build-up and the value history |
| Beaumont cold store: 26,500 sq ft freezer missing from the area | No | No: it uses the wrong area | Only if chosen | Yes, from the 2021 permit |
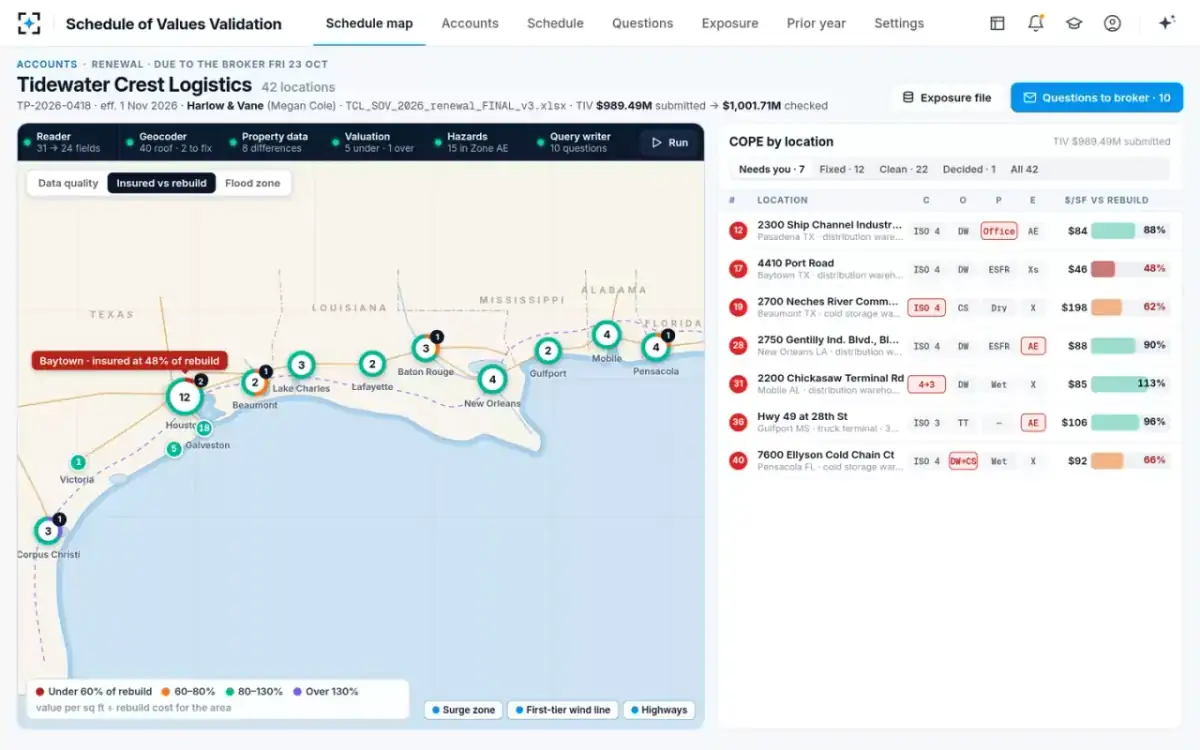
| Corpus Christi building up 60.9% to 158% of rebuild | No: it shows the value moved | Yes | Only if chosen | Yes, flagged as possibly over-insured |
| New Orleans building listed twice, $17.77M | No | No | No | Yes, two rows on one parcel |
| Three values unchanged for five to seven years | Yes, if the dates were kept | Partly | Only if chosen | Yes, matched across years by parcel |
How accurate are commercial building valuation tools?
No government or academic study we could find measures the accuracy of commercial valuation tools against actual rebuild costs, so treat any single accuracy figure with care. What can be said is where their errors come from, and those are the same for every tool: the floor area, the construction class, the occupancy, the location factor and the date of the cost data. A tool fed the broker's area for a building with an unrecorded addition will be wrong by the size of the addition, however good its cost model.
That is why the most useful accuracy question is about inputs, not models. A valuation that names its area, class, occupancy, location factor and cost-table date can be checked and corrected; one that returns a number cannot. The NFIP's rule that the method or documentation stay in the underwriting file is, in effect, a rule that valuations be checkable.
Before you buy: questions for any valuation tool or service
Run any tool on your own past schedules before choosing it, and ask what it does with the cases above. These questions separate tools that screen a schedule from tools that only price a building.
Seven questions for a commercial building valuation tool
- Does it value replacement cost, not market value?
An insurance value is the cost to rebuild with like kind and quality, not a sale price.
- Where do the floor area, class and occupancy come from?
If the answer is “the schedule”, the tool inherits every error on it.
- What date are its costs, and how are they brought forward?
A cost table should carry its date and the index used to trend it.
- Does it apply a location factor, and from what?
National averages need localising; ask how and at what level.
- Can it run on every location of a 300-row schedule at every renewal?
A tool used on a sample cannot find the building nobody chose.
- Does each result show its build-up and sources?
Area × cost × factor, with the source of each input, is what an underwriter, a broker and an examiner can follow.
- Who changes the value when it disagrees?
The tool should flag; the underwriter and the insured should decide.
Where Schedule of Values Validation fits, and where a valuation still does
It fits between the broker's schedule and the underwriter's decision: every location, every renewal, checked inputs, the carrier's own cost tables, and a log of every comparison and decision. It flags; it never changes a value or a limit. The thresholds, the cost tables and the approvers are settings, versioned and logged, and in the sample a new rule sending any location under 60% of rebuild to the VP for review took one sentence.
The map coloured by insured value against rebuild
It does not value a building the way an appraiser does, and its answer is only as good as the cost tables loaded into it. For a historic building, a specialised plant, or a building the check has flagged far out of line, an appraisal or a valuation service is still the right next step, and the solution's job is to say which buildings those are. What an under-valued building costs under an 80% coinsurance clause shows what is at stake for the insured; to see the checks on the sample renewal, start from Schedule of Values Validation.
Questions people ask
What is the difference between replacement cost and market value?
Replacement cost is what it would cost to rebuild the building with materials of like kind and quality at today's prices; market value is what a willing buyer would pay a willing seller. North Carolina's state property fund tells its agencies plainly that the two are not the same. Insurance values, and coinsurance tests, use replacement cost or actual cash value, never the sale price.
How often should commercial property be appraised for insurance?
There is no universal rule. FEMA's flood program requires insurers to review a non-residential building's replacement cost at least every three years, and North Carolina's fund indexes its buildings every year. A sensible pattern is an annual index or cost-table check on every building and an appraisal for buildings that are high-value, unusual, changed, or flagged.
What is the cost per square foot to rebuild a warehouse?
It depends on size, construction, location and date. FEMA's Hazus table gives $135.47 per square foot for a typical 30,000 square foot warehouse in 2022 dollars at the national average, before county factors; large tilt-up distribution centres and cold stores differ. Use a dated cost table with a location factor for the building's own type and area.
Can software flag undervalued buildings?
Yes, if it checks the inputs and compares every building with a cost table. Software that uses the broker's area and occupancy will miss buildings whose schedule is wrong; software that confirms them first, and shows the build-up, can flag a building for the underwriter, who decides.
Is a commercial building valuation calculator enough for insurance?
For a single, ordinary building with a known area and construction, a calculator built on a current cost table is a reasonable screen. For a multi-location schedule, the harder problems are the inputs and the scale: confirming area and use for every building, and finding the few that need a closer look.