For U.S. commercial buildings, the public construction cost index for 2026 is the Bureau of Labor Statistics' producer price index for new nonresidential building construction, published by building type. In September 2026 the warehouse index stood at 244.7, up 4.5% on a year earlier and 50.5% above January 2020; office construction was up 54.6% over the same period, industrial 49.1%, health care 41.6% and schools 40.0%. Those are the numbers an insured building value has to keep up with, and most did not: a value set in 2020 and rolled forward 3% a year now covers about 79% of what the warehouse index says the same building costs to build, and a value left flat covers about two-thirds. Botminds' Schedule of Values Validation exists to catch exactly that gap. It compares each building on a schedule with the cost to rebuild it, and flags values that have not moved for several renewals while the cost to rebuild kept rising.
Commercial cost indexes from publishers and cost estimators exist too; this page uses the public ones, which anyone can download and check. Percentages are our arithmetic on the BLS series as published through FRED, the Federal Reserve Bank of St. Louis's data service; the screens come from the solution's sample data, a fictional Gulf Coast logistics renewal.
New building construction prices, January 2020 to September 2026
What is the construction cost index for 2026?
There is no single index, but the public benchmark for U.S. commercial buildings is the BLS producer price index for new nonresidential building construction, one series per building type. The September 2026 readings, the latest at the time of writing, against September 2025: warehouses 244.738, up 4.5%; industrial buildings 205.902, up 5.7%; offices 224.574, up 6.0%; schools 242.683, up 5.2%; health care buildings 167.943, up 5.1%.
The levels mean little on their own, because each series starts from 100 in a different year: December 2004 for warehouses, June 2007 for industrial buildings. What an underwriter uses is the ratio between two dates, the date a value was last set and the date it is being tested. The 2025 equivalents, for anyone checking last year's renewal: September 2025 stood at 234.183 for warehouses, 194.754 for industrial, 211.939 for offices, 230.732 for schools and 159.737 for health care.
How much have construction costs risen since 2020?
By about half, for the building types most commercial property schedules are full of. The chart above runs from January 2020 to September 2026: offices up 54.6%, warehouses 50.5%, industrial buildings 49.1%. Schools and health care buildings rose less, about 40%. The goods that go into nonresidential construction rose more, 59.1%; goods are only part of what a finished building costs.
That rise is what separates a building value from the building. An insured value set in 2020 described a building at 2020 prices. If nothing has changed in the building since, the value should have risen with the index; if it did not, the schedule is describing a smaller building than the one standing on the site. What that gap costs at claim under an 80% coinsurance clause works through the money.
Where the rise happened: one year did most of the work
Most of the increase arrived in a single year. Between September 2021 and September 2022 the warehouse index rose 33.7%, the industrial index 27.3% and the office index 23.7%; in the three years after, warehouse prices barely moved. A schedule renewed in late 2021 and again in late 2022 with a routine 3% to 5% uplift missed most of the decade's change in one renewal.
The 2020–2026 rise, period by period: the year to September 2022 dominates
- Jan 2020–Sep 2021+6.4%
- Sep 2021–Sep 2022+33.7%
- Sep 2022–Sep 2025
- Sep 2025–Sep 2026+4.5%
- Jan 2020–Sep 2021+6.0%
- Sep 2021–Sep 2022+27.3%
- Sep 2022–Sep 2025+4.5%
- Sep 2025–Sep 2026+5.7%
- Jan 2020–Sep 2021+8.4%
- Sep 2021–Sep 2022+23.7%
- Sep 2022–Sep 2025+8.8%
- Sep 2025–Sep 2026+6.0%
The shape matters for checking a schedule. A value that was trended carefully until 2021 and then rolled forward by a fixed percentage carries the whole 2022 gap. A value re-estimated in 2023 is probably close. The useful question about any value on a schedule is therefore not "was it increased" but "when was it last set against a cost estimate, and what has the index done since".
Which index should insurers use for building values?
Use the building-type index that matches the occupancy, and know what it measures. BLS builds these indexes from model buildings rather than from finished projects. "Note that these indexes will include only work associated directly with building construction activities," the BLS fact sheet explains, and "Therefore, by definition, outputs such as preconstruction site preparation work, postconstruction landscaping or reclamation work, architectural fees, and building design fees are not in scope" (BLS, PPI nonresidential building construction fact sheet). The material and installation costs behind the models come from a cost-estimating firm; contractors' overhead and profit come from the PPI survey (BLS, Beyond the Numbers, July 2017).
BLS plans to update the building models every 5 years, according to the process outlined earlier in this article.
U.S. Bureau of Labor Statistics, PPI nonresidential building construction fact sheet
Three cautions follow. The index measures new construction, while rebuilding after a loss can involve work a new-build model does not price, such as demolition and clearing the damaged structure. The index is national, and BLS notes that "Multiple warehouse models were developed to accommodate regional variations in warehouse building design"; local costs move differently. And an index trends a value; it does not create one. If the starting value was wrong, trending it faithfully keeps it wrong.
The index's job on a schedule is therefore a test, not an estimate. Applied to every building, it shows which values have fallen furthest behind, which is where an underwriter's time and a valuation's cost should go. Four ways to check a commercial building value compares the index with cost tables, appraisals and per-location checks.
How do you trend a building value with an index?
Multiply the value by the index at the test date divided by the index at the date the value was set. A warehouse valued at $10.0M in January 2020 trends to $10.0M × 244.738 ÷ 162.6 = $15.05M in September 2026. The same arithmetic run backwards tells you how stale a value is: if a broker's 2026 figure equals the 2020 figure, its implied share of the current cost is 162.6 ÷ 244.738 = 66.4%.
Three details make the trend honest. Use the index for the building type, not a general inflation figure, which measures something else. Use the date the value was actually set from a cost estimate or appraisal, which is often years before the schedule's own date. And trend the building only: contents and business income follow the insured's own records, not a construction index.
The roll-forward gap: 3% a year against the index
A routine uplift of 3% a renewal has not kept up since 2020 for any of the main building types. Applied six times, from a 2020 value to a 2026 renewal, 3% compounds to 19.4%; the indexes rose 40% to 55% over the same span. A value left flat since 2020 has slipped further, to between about 65% and 71% of the index-implied cost.
What a 2020 building value covers in September 2026, by building type
| Building type | Index rise, Jan 2020–Sep 2026 | Value rolled forward 3% at six renewals | Value left unchanged since 2020 |
|---|---|---|---|
| Office building | +54.6% | 77.3% of index-implied cost | 64.7% |
| Warehouse | +50.5% | 79.3% | 66.4% |
| Industrial building | +49.1% | 80.1% | 67.1% |
| Health care building | +41.6% | 84.3% | 70.6% |
| School building | +40.0% | 85.3% | 71.4% |
The roll-forward column sits right at the edge of an 80% coinsurance clause, which is why the gap stays hidden: under 80% coinsurance a warehouse at 79.3% of cost is paid 99.2% of a partial loss, close enough that nobody notices. Under a 90% clause the same warehouse is paid 88.1%, and an office at 77.3% is paid 85.8%. The flat column fails every common clause.
2026: material prices are running ahead of building prices
In 2026 the input index moved much faster than the building indexes. The producer price index for net inputs to nonresidential construction, goods, rose from 166.856 in January 2026 to 184.909 in September, 10.8% in eight months and 11.2% on the year. The building-type indexes rose about 5% to 6% over the year to September.
The two measure different things: the input index prices the goods that go into construction, the building indexes price finished work including labour and contractors' margins, so materials can move faster for a time without the whole building doing the same. A year like this one is a reason to re-test values at the next renewal rather than wait for a scheduled appraisal. The last time inputs led like this, a 20.3% rise in the year to September 2021 came a year before the building indexes jumped; if this rise feeds through the same way, values set this year will need another uplift soon.
How often should insured values be updated?
At least once a year, with the index, and against a cost estimate whenever the building changes. North Carolina's state property fund does the indexing itself for the state's buildings: "the Fund will annually adjust the values of buildings and structures in its database for inflation. This is normally done in February of each year," and it asks agencies to review the values each year (NC Office of State Fire Marshal, State Property Fire Insurance Fund). Maine's insurance regulator tells small businesses the same from the buyer's side: "You may be able to add a rider or endorsement to the policy that automatically increases your policy amounts to keep up with inflation" (Maine Bureau of Insurance, Insuring Your Business).
Annual indexing keeps a value moving; it does not fix a wrong starting point. The index cannot see an addition, a change of use, or a value that was low the day it was set. That is why an annual index adjustment and a periodic check against a cost table or appraisal work together, and why a schedule should record the date each value was last set from an estimate.
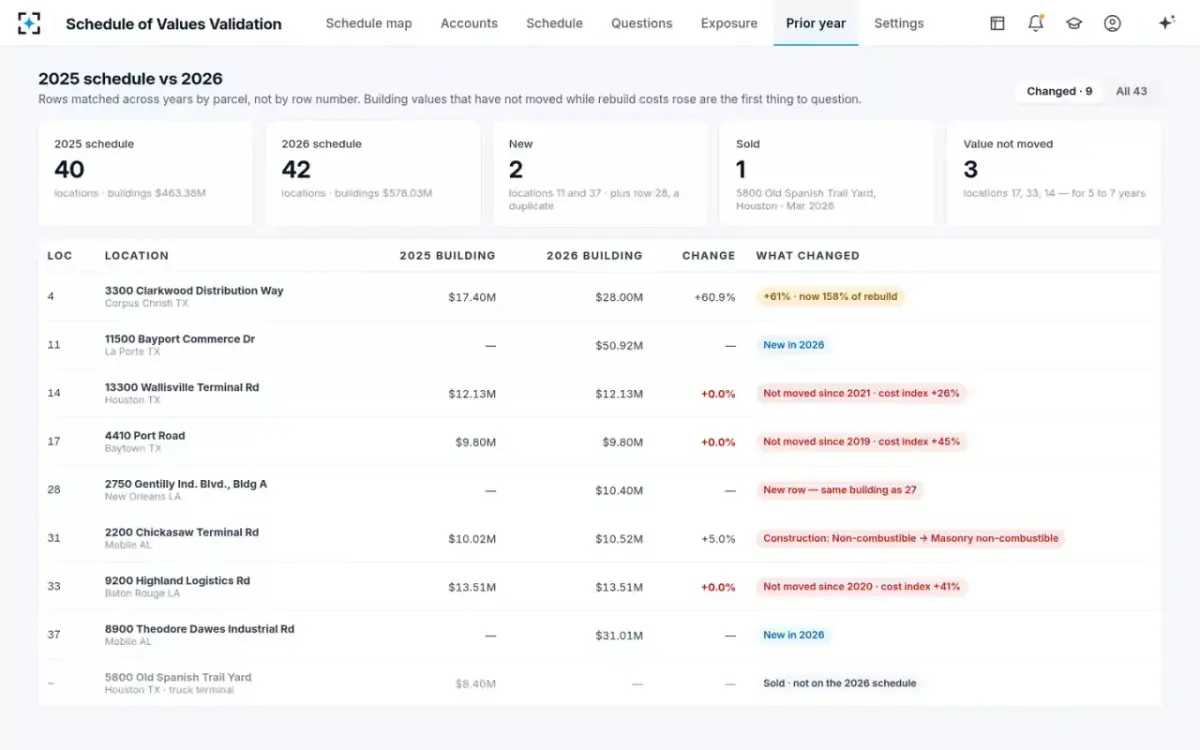
Last year's schedule against this year's: the values that did not move
How do you check if a building is underinsured?
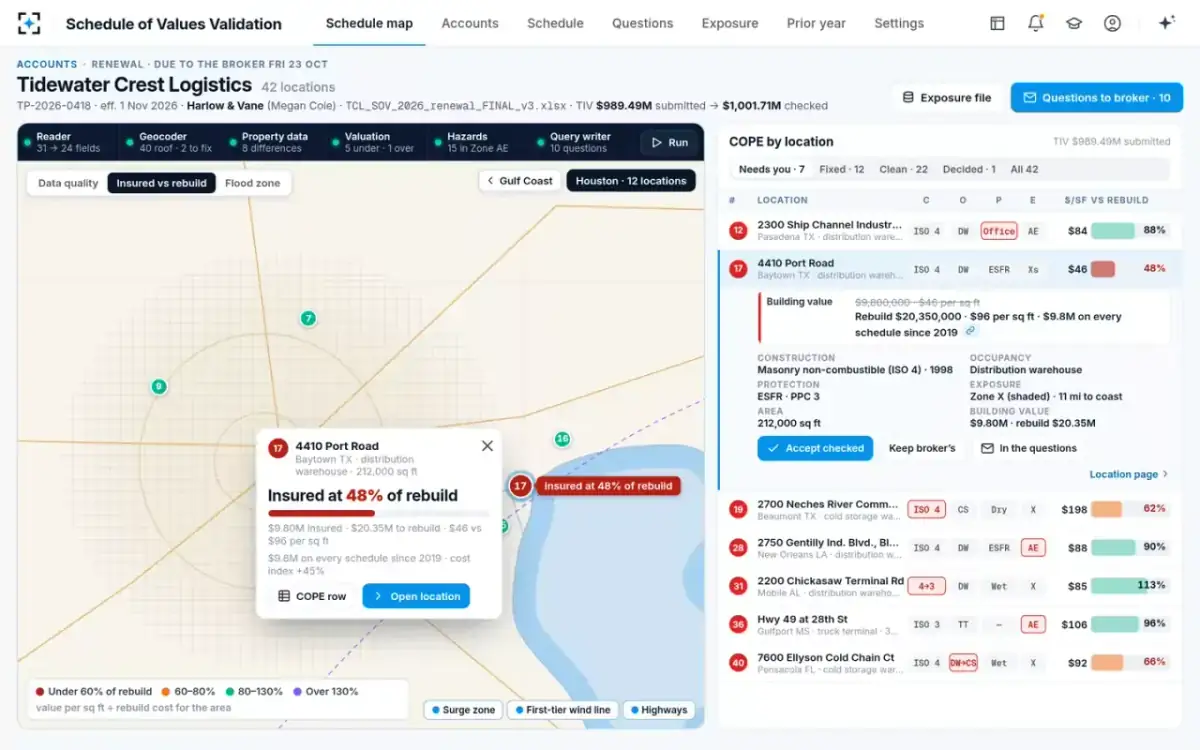
Compare its value per square foot with what it costs to rebuild that construction and occupancy in that area, using the right floor area. Two steps catch most cases. First, the stale-value test: has the value moved since the last cost estimate, and by how much against the index? Second, the cost test: does value per square foot fall well below the carrier's rebuild cost for the building's class, occupancy and location?
In the sample renewal, both tests point at the same building. A 212,000 square foot distribution warehouse in Baytown, Texas carries $9.8M, $46 a square foot, the same figure on every schedule since 2019, while the carrier's own area cost index rose 45%. The carrier's rebuild table puts the building at about $96 a square foot, $20.35M. The valuation checker in Schedule of Values Validation found it among five buildings under 80% of rebuild and three values unchanged for five to seven years, and put each in front of the underwriter with the build-up and the source. It never changes the value; the underwriter decides and the broker is asked.
Baytown: insured at 48% of rebuild, unchanged since 2019
To see how the sample renewal's values are tested, start from Schedule of Values Validation.
Questions people ask
What was the construction cost index for 2025?
On the BLS producer price indexes, September 2025 readings were 234.183 for new warehouse construction, 194.754 for industrial buildings, 211.939 for offices, 230.732 for schools and 159.737 for health care buildings. Between September 2025 and September 2026 those rose between 4.5% and 6.0%.
Does the construction price index include land and site work?
No. BLS says the nonresidential building construction indexes include only work associated directly with building construction; site preparation, landscaping, architectural fees and building design fees are out of scope. Land is not a construction cost and does not belong in an insured building value either.
Is there a regional construction cost index for commercial buildings?
BLS publishes regional indexes for new nonresidential building construction, built by re-aggregating its existing pricing data, and uses multiple warehouse models to reflect regional differences in design. For a single building, a carrier's own area cost factors or a valuation service will be closer than any national or regional index.
What is the difference between an input price index and a building price index?
An input index prices the materials and goods bought for construction; a building index prices the finished work, including labour and contractors' overhead and profit. In 2026 the input index for nonresidential construction rose about twice as fast as the building indexes over the year to September.
Should business income values be trended with a construction index?
No. Business income depends on the insured's earnings and how long a rebuild would stop the business, not on construction prices, though a longer and costlier rebuild can lengthen the period. Trend the building with the building index, contents with the insured's own records, and business income with its financials.