Catastrophe modeling software estimates the damage and insured losses that hurricanes, earthquakes, floods and other perils could cause to a portfolio of insured properties, and after an event it estimates what that event is likely to cost. Insurers use it for pricing, reinsurance and capital. Catastrophe claims management is different software for a different job: taking in the notices after a real event, sorting them by severity, deploying adjusters and keeping every regulatory clock. The confusion is understandable, because both start from the storm's path. But a model answers "how much?", and a claims team needs to know "who calls tomorrow, and who can reach them?" Botminds' Catastrophe Claims Management sits on the claims side: seven agents put the storm footprint, every claim, every adjuster and every policy that has not reported yet on one live map, with a per-policy forecast of tomorrow's claims that a loss model does not produce.
The examples come from a fictional event, Hurricane Delphine, and a fictional carrier, Corvane Mutual, as they run through the solution; their figures are sample data, not a customer result. The descriptions of catastrophe models come from the NAIC, FEMA and Florida law, linked where they appear.
Five layers between a storm and a booked visit: what catastrophe models and Catastrophe Claims Management each cover
1
Hazard and loss model
How much could this storm, or storms like it, cost?
OutputExpected damage and insured loss for a portfolio, by area
Covered byCatastrophe model
2
Event footprint
Where did this storm actually go, advisory by advisory?
OutputDated wind field and perimeters, and the policies inside them
Covered byBoth can hold it
3
Policy-level forecast
Which of these policies will report a claim tomorrow, and this week?
OutputA score per unreported policy; expected claims and visits by zone
Covered byNeither, unless built for it
4
Notices and routes
What has been reported, and where should each claim go?
OutputEvery notice tagged, every claim routed to fast-track, desk or field
Covered byCatastrophe claims management
5
Adjusters and requests
Who can reach which homes, and how many more do we need?
OutputZones by drive time, routes, the request to outside firms
Covered byCatastrophe claims management
What does catastrophe modeling software do?
It simulates events and prices their consequences. The NAIC's research centre puts it in one sentence: "A catastrophe model is a computerized process that simulates thousands of plausible catastrophic events scenarios." A model has four parts. The hazard part is a catalogue of simulated events with their probabilities; the vulnerability part holds damage functions that turn wind speed or flood depth into damage for a given type of building; the exposure part is the insurer's own portfolio, with locations, values, deductibles and limits; and the financial part applies policy terms and reinsurance to produce the insured loss.
The outputs are distributions, not lists. An exceedance probability curve says how likely losses are to exceed each amount in a year; an average annual loss says what the portfolio loses in an average year. Those numbers set rates, decide how much reinsurance to buy and how much capital to hold. None of them says which policyholder will call on Tuesday, because none of them is meant to.
Free catastrophe modeling software: FEMA's Hazus
The best-known free option is FEMA's Hazus. FEMA describes it as "distributed as free GIS-based desktop software with a collection of inventory databases for every state and territory in the country." It estimates physical, economic and social impacts of earthquakes, hurricanes, floods and tsunamis, and its hurricane model, in FEMA's words, "combines inventory information and wind speed data with damage functions to estimate disaster impacts." Emergency managers, planners and researchers use it to map the potential impacts of catastrophic events, according to FEMA's Hazus page.
Hazus can run on a real storm as well as a simulated one. Its hurricane workflow imports the National Hurricane Center's forecasts, which FEMA notes are "disseminated every six hours as storms approach", and for some storms uses observed wind speeds published by NIST after landfall. Its building inventory is aggregated to small geographic blocks unless a user supplies building-level data, and its outputs are building damage, economic loss, shelter needs and debris by area. That is the right shape for an emergency manager deciding where to send shelters. It is not a list of policies, and it knows nothing about which ones have reported a claim.
Who checks the models? Florida's commission
In Florida, a state commission reviews the hurricane models insurers may use to set residential rates. The Legislature set out why: "Reliable projections of hurricane losses are necessary in order to assure that rates for residential property insurance meet the statutory requirement that rates be neither excessive nor inadequate." The Florida Commission on Hurricane Loss Projection Methodology includes the insurance consumer advocate, university experts in actuarial science, statistics, computer system design and meteorology, and a structural engineer. In a rate filing, an insurer must use the methods and models the commission has found accurate or reliable and may not modify or adjust them.
The review is about rates. A model can pass it and still say nothing about the operational question after landfall. That is not a flaw in the model; it is a difference in the question. A buyer comparing catastrophe software should decide first which question it is trying to answer.
What does catastrophe modeling do after landfall?
It turns the actual track and wind field into an estimate of the event's loss, and refines it as observations arrive. An insurer can use that estimate to set early reserves, notify reinsurers and tell leadership the size of the event. The estimate is for the portfolio or by area, and it moves. Florida's regulator, publishing insurers' own estimates after Milton, warns that the figures "are fluid and will fluctuate over time as claims move through the insurers' claims-handling process"; as of 9 December 2025 they stood at $5,615,415,911 in estimated insured losses.
What a loss estimate does not tell a claims team
$5.6B
insurers’ estimated insured losses from Milton in Florida, December 2025
385,146
claims behind that estimate
134,177
of them closed without payment, each still a claim to take in and handle
The stats make the gap concrete. A loss model estimates dollars; a claims team handles claims, and a large share of them carry no dollars at all. Every claim closed below the deductible, 51,625 of Milton's closings by insurers' count, was reported, acknowledged, often inspected and explained in writing, and none of that work appears in a loss estimate. Sizing a catastrophe team from the loss estimate alone misses the claims that cost time and pay nothing.
Can a cat model predict claim counts?
Roughly, for the event as a whole; not for tomorrow, and not by policy. A model estimates which buildings are damaged and how badly. Whether a damaged building turns into a claim, and when, depends on things a damage function does not hold: whether the policyholder has power and a phone, whether they have evacuated, whether they think the damage is below the deductible, whether their neighbours have filed. Those are reporting behaviours, and they decide the day-by-day workload a catastrophe team is staffed for.
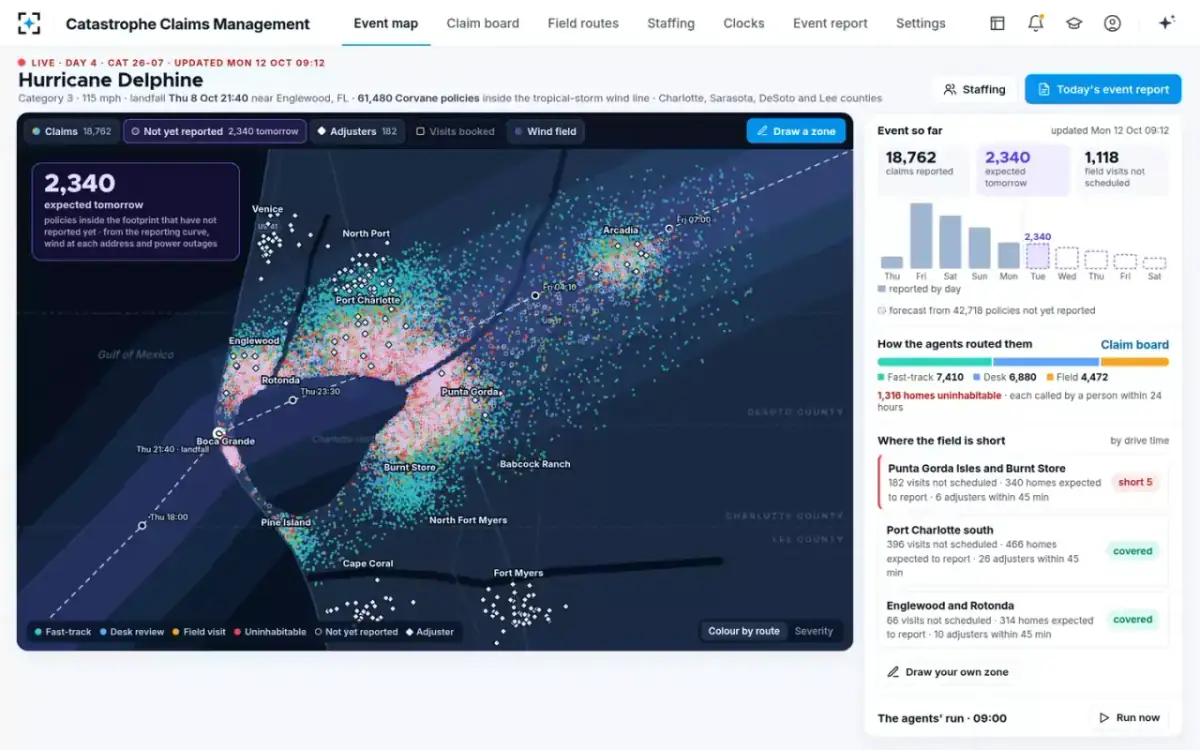
The sample event shows the shape. On day four Corvane had 18,762 claims from 61,480 policies inside the tropical-storm wind line. The contact team's list of people not reached after two tries was dominated by power and evacuation: 402 with no power and the phone off, 188 evacuated with no forwarding number. Damage that has happened but has not been reported is exactly the part of the event a staffing request built from reported claims leaves out.
How do insurers estimate how many claims a hurricane will bring?
From their own past events, reshaped to the new storm's footprint, and in the solution, policy by policy. The volume forecaster scores every policy inside the footprint that has not reported. Each score uses the wind at the policy's address, the reporting curve of the carrier's last two Gulf hurricanes, power outage reports by ZIP code, and whether a neighbour on the same street has reported. Policies at or above the threshold the carrier sets, 50% in the sample, count as expected claims, and the zones count them into the visits they will need.
The sample event’s claims on day four: reported, expected tomorrow, expected this week, later
About 31,900 claims expected in all
- Reported · 18,762 · 59%
- Tomorrow · 2,340 · 7%
- Rest of the week · 6,575 · 21%
- Later · about 4,200 · 13%
The forecast is shown, never acted on. In the solution no policyholder who has not reported is contacted without an approved outreach, and the director of claims operations approves it. What the forecast changes is the staffing request: on day four it added 4,861 desk files and about 82 field visits in one zone alone to what the reported claims would have asked for. How that changes the cost of surge staffing is set out in insurance claims temporary staffing.
Tomorrow’s claims on the Catastrophe Claims Management map, as hollow rings
What is demand surge?
Demand surge is the rise in repair and rebuilding costs after a large disaster, when many owners need the same labour and materials at once. The NAIC's research centre describes it as a residual loss that models estimate: "Residual loss includes demand surge due to temporary increase in cost of labor and inflation in construction material". It also notes that the 2004 and 2005 Atlantic hurricane seasons had a substantial impact on modeling assumptions, demand surge among them. For a claims team it shows up in the estimates: a roof priced in the first week and a roof priced in the third may differ for reasons that have nothing to do with the damage.
The same squeeze applies to adjusters. When one storm hits many carriers, they draw on the same independent adjusting firms in the same week. A carrier that sends its request two days late is competing for what is left. That is a staffing effect, not a model input, and it is one more reason the claims side needs its own forecast rather than the loss model's total.
Which one to buy, and when you need both
Most carriers need both, because they answer different questions on different clocks. The loss model is used all year and at landfall to estimate what an event costs; claims management is used from the first notice to the last payment to decide who handles which claim and how many adjusters to bring in. Buying one in place of the other leaves either the reserve or the queue unmanaged.
Catastrophe modeling software against catastrophe claims management
Catastrophe modeling software: How much could, or will, this event cost?
Catastrophe claims management: Which claims need whom, today, and how many more adjusters?
Catastrophe modeling software: Loss by portfolio, area or event; EP curves and average annual loss
Catastrophe claims management: Claims, routes, visits, zones, requests, deadlines
Catastrophe modeling software: Pricing and reinsurance all year; loss estimates at landfall
Catastrophe claims management: From the first notice to the last payment
Catastrophe modeling software: Not modelled
Catastrophe claims management: Forecast per policy: wind, past reporting curves, outages, neighbours
Catastrophe modeling software: Not its job
Catastrophe claims management: Every acknowledgement and pay-or-deny date counted per claim
Catastrophe modeling software: Actuaries, reinsurance, capital and leadership
Catastrophe claims management: Catastrophe manager, adjusters, contact team, director of claims operations
Where the two meet, they should share the footprint. The solution's footprint reader builds the event footprint from each advisory's wind field, surge zones and hail or fire perimeters, uses the latest official advisory, dates and keeps every footprint, and never drops a policy from it without a reason. The National Hurricane Center's forecast advisories carry the wind radii that make that possible: "Tropical storm and 50-kt wind radii are forecast out to 120 h and hurricane-force wind radii are forecast out 72 h." A carrier that already runs a model on the same advisories can compare its estimate with the claims as they arrive, which is the best test either tool will get.
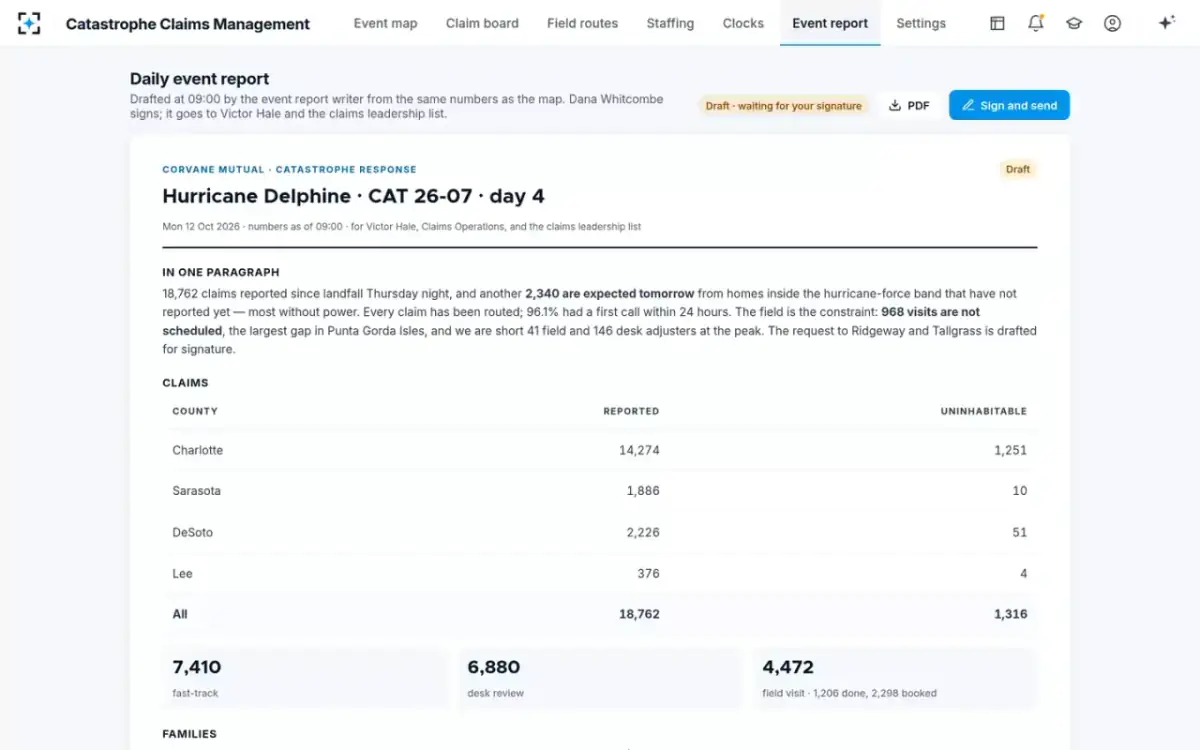
The daily report: the claims side of the event, in one page
Questions that tell the two kinds of software apart
- Does it produce a number per policy, or per area?
A claims team needs the policy; a model gives the area.
- Does it know which policies have reported?
Without the notices, it cannot forecast the rest.
- Does it model reporting behaviour?
Power, evacuation and neighbours decide when claims arrive, not only damage.
- Does it count the regulatory clocks?
Seven-day acknowledgements and 60-day pay-or-deny dates in Florida, per claim.
- Does it size and draft the staffing request?
From open and expected claims, by lane, against the visit target.
- Is its output used by actuaries or adjusters?
If both, it is probably two products.
For a carrier that already licenses a model, the test of a claims tool is simple: on one past storm, did it say which policies would report, when, and where adjusters would be short, before it happened? The answer can be checked against what actually came in. How a notice is tied to its event in the first place is covered in what a catastrophe code is, and the full map is on Catastrophe Claims Management.
Questions people ask
Is there free catastrophe modeling software?
Yes. FEMA's Hazus is distributed as free desktop software with national building inventory data, and estimates damage, economic loss, shelter needs and debris for hurricanes, floods, earthquakes and tsunamis. It is built for emergency management and planning, not for an insurer's portfolio or claims.
What is a catastrophe model in insurance?
A computer model that simulates thousands of possible catastrophic events, estimates the damage each would do to an insurer's properties, and applies policy terms and reinsurance to estimate insured losses. Its main outputs are exceedance probability curves and average annual loss.
Do Florida insurers have to use approved hurricane models?
For residential rate filings, yes. Florida law requires insurers to use the methods and models its Commission on Hurricane Loss Projection Methodology has found accurate or reliable, and bars them from modifying or adjusting those models in the filing.
Can a catastrophe model replace claims triage?
No. A model estimates damage by area; triage decides, claim by claim, whether a home needs a field adjuster, a desk review or fast-track settlement, from the notice, the photos and the imagery.
Why do loss estimates change after a hurricane?
Because they are built from claims still being handled. Florida's regulator says insurers' catastrophe figures are fluid and will fluctuate as claims move through handling, and its Milton estimate of $5.6 billion is dated 9 December 2025, fourteen months after the storm.