There is no reliable average RFP win rate for asset managers: no regulator or independent study publishes one, and the figures that circulate come from surveys whose denominators differ, so they cannot be compared with a firm's own. The firm's own rate is worth knowing, but it is the wrong first KPI for a search pipeline, because it starts counting at the RFP, after most of what decides the mandate has happened. Measure first whether the team sees the searches its shelf could enter, how far ahead, whether its probabilities can be trusted and which searches the shelf could not enter at all. Botminds' RFP Tracking reports those four from approved pursuits only, so each figure traces to a board document and a named decision; the win rate comes last, with its denominator stated.
Where this page uses the solution's figures, they come from its fictional sample firm, Quillfield Capital, and are results on sample data. The formulas are general and can be run on any team's files.
The KPI tree a search pipeline owes, from reach to outcome
- 1
Reach
Coverage
searches seen first ÷ relevant searches
52 of 61 in the sample, 85%
- 2
Time
Lead time
median days, first signal → RFP
96 days in the sample
- 3
Fit
Enterable share
searches the shelf can enter ÷ searches seen
the rest feed the product-gap list
- 4
Honesty
Calibration
share opened in each score band
60–80% band opened 71%
- 5
Outcome
Win rate, three ways
wins ÷ responses, ÷ finals, ÷ relevant searches
reported last, with its denominator
What is the average RFP win rate?
For institutional asset management, the honest answer is that nobody knows. No regulator collects RFP outcomes from managers, and no regulator or independent study publishes asset managers' win rates on manager searches. Surveys by firms that sell to asset managers do circulate figures, but a survey rate depends on who answered, which RFPs they counted and what they called a win, and none of that matches any particular firm's books.
The more useful question is what a firm's own win rate means. Two managers with the same rate can be in very different positions: one entering every search it sees and winning a few, the other entering only the searches where it already knows the consultant's view. The rate says nothing about the searches neither saw. That is why the tree above puts the win rate last and puts reach and time first.
RFP win rate meaning: three denominators, three answers
RFP win rate means mandates won divided by some count of searches, and the count chosen changes the answer by a factor of five or more. The three common denominators answer three different questions.
Three ways to calculate RFP win rate, on one illustrative year
| Win rate | Calculation | Result | What it measures | Owner |
|---|---|---|---|---|
| On responses | 4 wins ÷ 40 RFPs answered | 10% | How often a submitted response becomes a mandate. Falls when the team answers more marginal RFPs. | RFP team |
| At finals | 4 wins ÷ 12 finals | 33% | How often the firm converts once shortlisted: the finals presentation, fees and the consultant's view. | Sales and portfolio managers |
| On the market | 4 wins ÷ 61 relevant searches | 6.6% | The share of all searches the shelf could have entered that the firm won, seen or not. The only one a pipeline can grow. | Head of distribution |
How to calculate RFP win rate from your own files
To calculate RFP win rate, fix three things before counting: which searches are relevant, what counts as a response and what counts as a win. Relevant searches are those the shelf could have entered: an asset class you run, a vehicle you offer, a size inside your minimum and capacity. A response is a submitted RFP answer, not a download of the document. A win is a funded mandate, not a finals invitation, and a search the plan cancelled is neither a win nor a loss and should leave both counts. The weeks between award and funding are a process of their own, mapped in the asset management client onboarding process guide.
Then date everything. Each search gets the date of its first signal, the RFP release date, the response date, the finals date if any and the award date. Without dates the team cannot compute lead time, cannot separate searches it saw early from ones it found on the day, and cannot tell whether a change in win rate came from the team or from the mix of searches that year.
Finally, keep the reason for every pass. A search the firm chose not to enter belongs in the market count with a reason code: no product, no capacity, below the fee floor, poor fit with the consultant's view. Those reasons are what turn a win rate into a product decision.
Why win rate alone misleads: it starts counting at the RFP
A win rate measured on responses rewards a team for answering less. Drop the marginal RFPs and the rate rises while the number of mandates stays the same or falls. It also hides where wins are decided. Research on how institutions hire managers points to factors that are mostly settled before an RFP is written: in a study of 3,400 plan sponsors over 1994–2003, managers were hired after strong past excess returns that did not persist afterwards (Goyal and Wahal, Journal of Finance, 2008), and consultants' fund recommendations were driven mostly by qualitative judgments rather than past returns, yet shifted flows significantly with no evidence of adding value (Jenkinson, Jones and Martinez, Journal of Finance, 2016).
Read together, the studies say a manager's chance in a given search is shaped by its recent record and by what the consultant already thinks, long before the response is drafted. A team's skill shows mostly in two places a win rate does not measure: seeing the search while the consultant is still forming a view, and knowing which searches to leave alone. The research is set out in full, with its quotations, in how to evaluate a fund manager, and its meaning for sellers in what research shows about the investment manager selection process.
Lead time: days between first signal and RFP
Lead time is the median number of days between the first dated signal of a search and the RFP's release, across the searches seen first. It is the KPI that buys everything else: time to meet the consultant before the RFP is drafted, to clear contact with compliance, to decide which strategy to put forward. The sample firm's median this year was 96 days across 52 searches; the solution's design target is about 90 days on searches in watched plans.
Report lead time with its spread and by plan. A median can hide a cluster of searches seen with under a month to go, which in the sample was 6 of 52, and a plan-by-plan view shows which boards post early enough to be worth reading closely. How to compute it without flattering the tool is in a back-test of RFP tracking tools.
Coverage and enterable share: the searches the shelf could not enter
Coverage is the share of relevant searches seen before the RFP; the sample firm's was 52 of 61, or 85%. Enterable share asks the next question: of the searches seen, how many could the firm actually enter? The rest are not failures of the sales team. They are a list, sized, of what plans asked for that the shelf does not have, and it belongs to the product committee.
Product gaps: $5.3 billion of searches the sample shelf could not enter
The largest bar is not a missing product but a price: five passive searches below the firm's fee floor. That is a decision the firm has already made, and the report shows what it costs in searches each year. The other three are candidates for a product conversation, with the plans and dates attached. Neither appears in a win rate.
Calibration: sales pipeline probability percentages that mean something
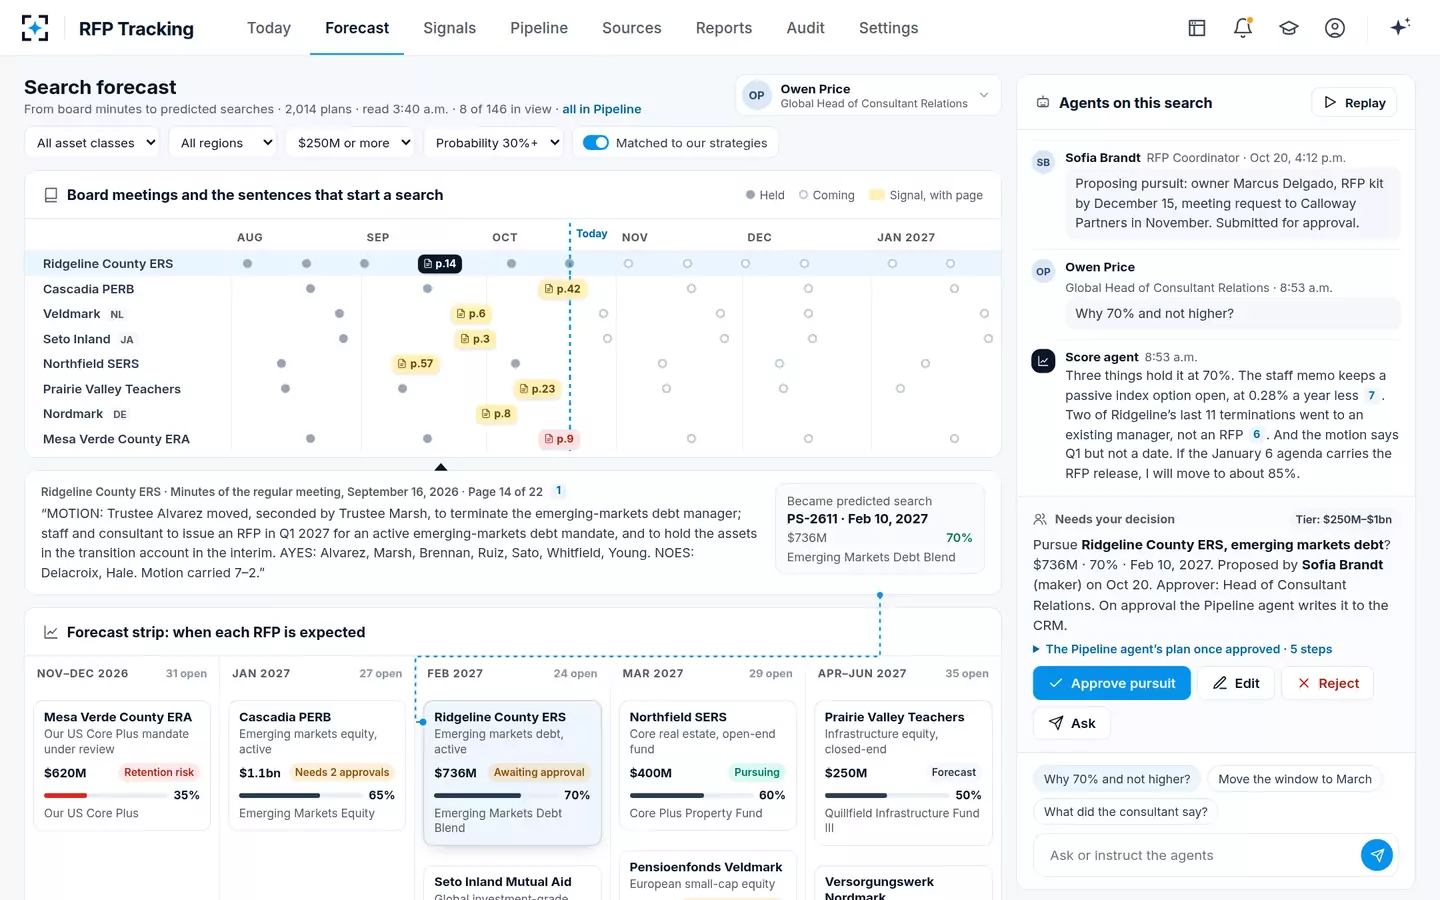
A pipeline's probability percentages are only useful if a 70% search opens about 70% of the time. Many CRM set-ups attach a fixed percentage to each stage, so every search at the same stage carries the same number whatever the evidence. Calibration replaces that with a test: group searches by the probability given, and compare each group with the share that opened. On the sample firm's 135 forecasts over 12 months, searches scored at 60–80% opened 71% of the time, and those at 80% or more opened 86%, slightly below their scores, so the firm lowered its top band by two points.
A calibrated pipeline can be added up. Weight each search by its probability and the sum is the expected volume of RFPs the firm will be able to enter, which is the number a head of distribution needs for capacity planning. The table shows the arithmetic on three sample searches; a summary score for the whole set is the Brier score, from Glenn Brier's 1950 paper on verifying probability forecasts.
A probability-weighted view of three emerging-markets searches expected in Q1
| Search | Forecast size | Probability | Probability × size |
|---|---|---|---|
| Ridgeline County ERS, EM debt, expected February | $736M | 70% | $515M |
| Cascadia PERB, EM equity, expected January | $1.1bn | 65% | $715M |
| Lakeshore Municipal Teachers, EM debt, expected January | $200M | 76% | $152M |
| Three searches | $2.04bn | — | $1.38bn expected |
A probability with its reasons: why one search sits at 70%
Reason codes: making passes and losses countable
A pipeline only teaches something if every decision carries a reason from a fixed list. Free-text notes such as "not a fit" cannot be counted, so they cannot show whether the firm is losing searches to price, to capacity or to the consultant's view. The sample firm requires a reason code on every decision, three for pursuing and eight for passing, with a note demanded whenever someone picks "other". The list below is one way to build such a set; only the codes the sample shows on screen, a fit code for pursuing and the no-product and fee-floor codes for passing, come from the solution.
A reason-code set for pursue, pass and loss decisions
| Decision | Code | What it records | Who reads the count |
|---|---|---|---|
| Pursue | Fit | The strategy fits the mandate on benchmark, vehicle, minimum and capacity | Head of distribution |
| Pursue | Relationship | Existing client or a strong consultant rating outweighs a weaker fit | Head of consultant relations |
| Pass | No product | The shelf has nothing in the asset class or vehicle asked for | Product committee |
| Pass | Fee floor | The plan's fee expectation is below the firm's floor | Product and pricing |
| Pass | Capacity | The strategy is closed or near its capacity limit | Portfolio management |
| Pass | Contact | A quiet period or contribution issue makes pursuit unwise | Sales compliance |
| Loss | Finals, fee | Shortlisted, lost on price | Pricing |
| Loss | Finals, other | Shortlisted, lost on team, process or presentation | Sales and portfolio managers |
Typical win rate for RFP responses: why a benchmark would not transfer
Even if a reliable industry figure existed, it would not tell a firm how it is doing. Win rates move with the mix of searches a firm enters: passive and fixed income searches differ from private markets, large public plans from small local ones, consultant-led searches from direct ones. They move with the shelf's recent record, which the research above ties to hiring. And they move with what the firm calls a response. A firm comparing itself with a survey figure is mostly comparing denominators.
The comparison that does work is the firm against itself, quarter on quarter, on fixed definitions: the same relevant-search filter, the same response and win rules, the same reason codes for passes. Hold those fixed and the four reach-and-time measures explain most changes in the win rate before it moves.
A quarterly pipeline report for the CIO and the head of distribution
A pipeline report that can be defended in front of a CIO, an auditor or a board fits on one page and answers seven questions, each from approved pursuits only.
Seven lines for a quarterly search pipeline report
- Relevant searches in the market, and how many we saw first
Coverage, with the misses by cause: watch-list gap, no public trail, access.
- Median lead time, with its spread
And the plans that post too late to be useful.
- Enterable share and the product-gap list
Searches the shelf could not enter, sized, with reason codes.
- Calibration by score band, with counts
And any band the firm re-set, with the reason.
- Probability-weighted pipeline by quarter and asset class
Only meaningful once calibration holds.
- Win rate on responses, at finals and on the market
All three, with definitions unchanged from last quarter.
- Every pursue-or-pass decision with its reason code
So any number above can be traced to the decisions behind it.
Reason codes, thresholds and approval tiers, set once and kept on the audit trail
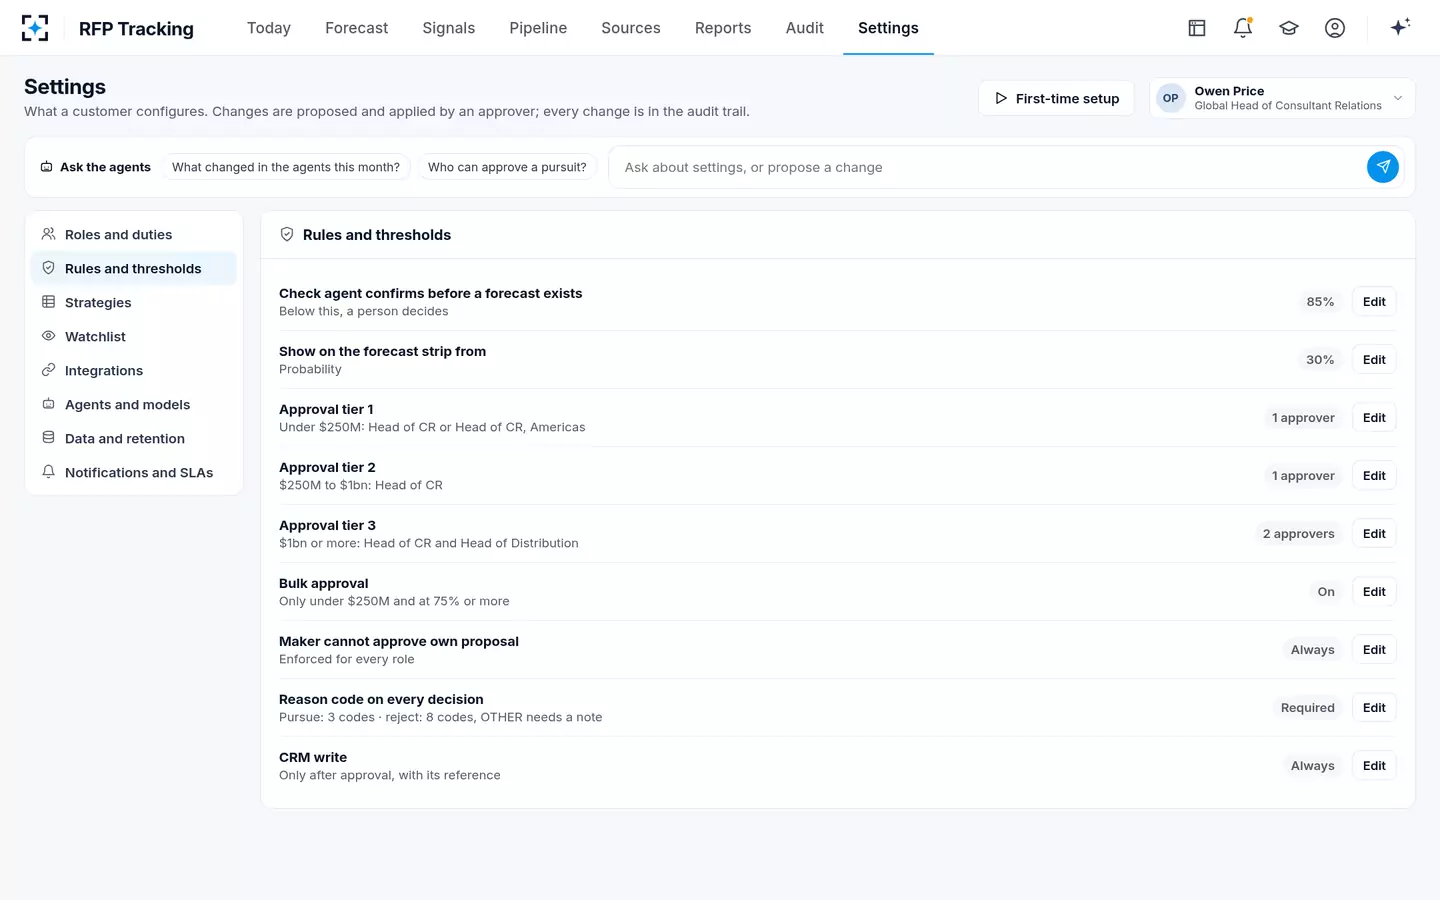
The settings above are what make the last line of the report possible: a reason code on every decision, yes or no, and a pipeline written only after approval. To see the reports built from them, start from RFP Tracking.
Questions people ask
What is a good RFP win rate for an asset manager?
There is no published benchmark that a firm can rely on; no regulator or independent study publishes one. A good rate is one that holds or rises on fixed definitions while coverage and lead time rise, which shows the team is entering more of the right searches rather than fewer of the easy ones.
What is the difference between win rate and hit rate?
Teams use the words loosely. Some use hit rate for reaching finals and win rate for funded mandates. Whatever the labels, state the numerator and denominator on every report, because a finals-based rate can be several times a response-based one on the same year.
Should cancelled searches count as losses?
No. A search the plan cancelled, or that went to an existing manager without an RFP, leaves both the numerator and the denominator. Keep it in the forecast calibration, though: a search scored at 70% that never opened is exactly what calibration should count.
How do you calculate a probability-weighted pipeline?
Multiply each search's forecast size by its probability of opening and add them up. Three sample searches totalling $2.04 billion at 65–76% give about $1.38 billion expected. The figure is only as good as the probabilities, so check calibration by band first.
What is RFP success rate?
Usually another name for win rate on responses: mandates won divided by RFPs answered. Because it ignores searches the firm never saw or chose not to enter, report it beside coverage and the product-gap list, not instead of them.