Reinsurance data management, on the ceded side, is the work of getting the same book of business described consistently across the systems that each hold part of it, so that what the cedant tells its reinsurers can be traced and defended. For a renewal submission that means at least seven sources: the policy administration system, bordereaux from managing agents, a geocoding service, the claims system, the catastrophe model platform, rate filings and underwriting notes, and the finance plan. Each has its own as-at date, its own definitions and its own owner. The submission is the first place they all meet, and most of the errors a reinsurer finds sit at the joins between them.
This guide maps those systems on a fictional sample: Harborline Mutual's 2027 property catastrophe renewal as built in Reinsurance Submission Preparation, Botminds' solution in which six agents read each system's extract, build the submission and tie every figure across them, while people keep the decisions. The company, its systems' contents and its staff are invented; the figures are sample data.
The systems one property catastrophe submission draws on, and where each breaks
| System | What the submission takes from it | As-at date on the sample | Where it tends to break |
|---|---|---|---|
| Policy administration | In-force locations, values by coverage, characteristics, non-renewals | In force at 30 Sep; extracted 13 Oct | Cut-off differs from the model input’s |
| Managing-agent bordereaux | Risks written under delegated authority | September risk bordereau, received 8 Oct | Loaded into one system and not another |
| Geocoding service | Coordinates and match resolution per location | Run of 3 Oct | ZIP-level matches treated as precise |
| Claims system | Catastrophe events and large losses, development, reopenings | Listings at 30 Sep | Large-loss list copied forward instead of pulled |
| Actuarial | Approved trend factors | Approved 2 Oct | Factors changed outside their owner |
| Catastrophe model platform | EP curves, AAL, own-view note, the input file | Input built 22 Sep | Input older than the exposure it claims to model |
| Rate filings and notes | Rate, appetite, deductible and program changes | 14 approved filings | Changes stated without a filing behind them |
| Finance | Subject premium in the plan and the projection | Plan of 14 Jul; projection of 9 Oct | Cover letter and plan quote different premiums |
| Last year’s submission and broker log | Figures the market already holds; its questions | Released 28 Oct 2025; log of 2 Dec 2025 | Old figures carried into new cells |
What is reinsurance data management?
For a cedant, it is making sure that every number it gives the reinsurance market comes from a known source, at a known date, owned by a known person, and agrees with every other place the same thing is described. That is narrower than enterprise data management and harder than it sounds. The professional texts set the standard plainly: Patrik's chapter on reinsurance pricing for the Casualty Actuarial Society opens its proportional pricing example with the instruction to "Gather and reconcile primary exposure, expense and rate information segregated by major rating class groups", reconciled as far as possible to the cedant's published financial statements.
The reinsurer's side has its own data management problem: it receives submissions from many cedants in many shapes. This guide is about the cedant's side, where the problem is not volume but consistency across systems that were never designed to describe one book together.
What systems do ceded reinsurance teams use?
Mostly systems that belong to other teams. The ceded team usually owns a reinsurance administration system for treaties, cessions and recoveries, and a great many spreadsheets. Everything a submission needs, though, lives elsewhere: insured values in the policy system run by underwriting operations, losses in the claims system, the model in the catastrophe team's platform, trend factors with the pricing actuary, premium in finance. The table above is the sample's version of that map. Its most useful column is the third: on one renewal, the as-at dates of the inputs span three months.
Three months of as-at dates behind one submission
- Finance plan14 Jul
- Model input22 Sep
- Cut-off
- Factors
- Geocode
- Bordereau
- Projection
Why is reinsurance data so hard to reconcile?
Because the systems were built for different jobs and describe the book at different moments. The policy system describes the book as at its cut-off; the model input describes whatever was loaded when it was built; the finance plan describes what was expected in July. None is wrong. Each is right for its date, and the submission has to say which date it is using for which figure and reconcile the rest.
Values add a second layer of difficulty. The NAIC's catastrophe modelling primer, written for state regulators, calls consistent, accurate insured values hard to obtain and says they must be adjusted for inflation from time to time; the cat modeling analyst's guide works through the values side. Its general warning applies to every field a submission draws on:
"It is important to note that the catastrophe model is sensitive to the data input into it." "The better the data, the less there is a need to rely on assumptions, which reduces uncertainty."
NAIC Catastrophe Modeling Primer (March 2025)
Indexation is a good example of a definitional break. If the policy system holds indexed values and the model input holds last year's, insured value can grow 9.5% in one place and not in the other. On the sample, the exposure chapter attributes 4.1 points of that growth to indexation and 5.4 points to more policies, so a reinsurer can see which part of the change is price inflation and which is new risk.
Three insured values for one book
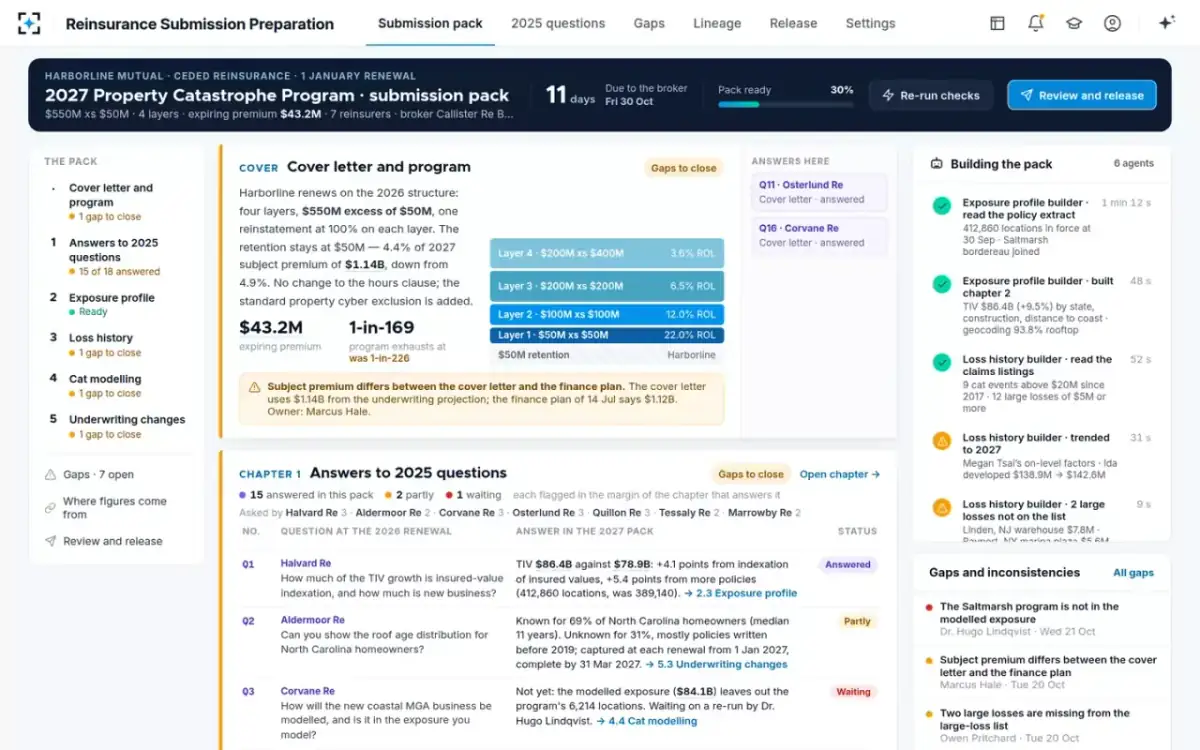
The failure every ceded analyst recognises is the same book showing three insured values: one in the policy system, one in the model input and one in the cover letter. On the sample, the policy extract gives $86.4B across 412,860 locations, while the model input built three weeks earlier holds $84.1B. The difference is one program: 6,214 locations written through a coastal managing agent since 1 April, present in the bordereau and the policy system but loaded after the model input was built.
Where the sample's $86.4B of insured value sat on assembly day
Exposure profile, $86.4B
- In the model input ($84.1B) · 97.3%
- Missing from the model input ($2.3B) · 2.7%
A 2.7% gap looks small until it is located. Because it sat on the coast, modelling it raised the 1-in-100 from $512M to $531M and moved the return period at which the program exhausts from 1-in-169 to 1-in-148. One reinsurer had asked about exactly this business at the previous renewal.
How do you reconcile exposure data to the cat model?
Compare the model input with the exposure chapter on the same dimensions, at a stated tolerance, before anyone quotes a model result. In practice that means total insured value and location count, then the same by state, line and construction, and a list of programs present in one and not the other. On the sample, the cat model reconciler runs that comparison with the chapters assembled and the tolerance set at 0.5%; a modelled-exposure gap above tolerance blocks release. It reports the difference and asks the catastrophe modelling lead to re-run. It never edits the model input or adjusts the curve itself.
The submission on assembly day: chapters, cover letter, gaps and the run log in one view
The same discipline applies to any second use of the exposure. A Florida residential writer reports insured values by ZIP code to the state hurricane fund each year, and the fund's own instructions warn that its automated validation checks format, not truth: a value coded wrongly against the policy passes (FHCF data call instructions). The reconciliation between that filing and the private submission is set out in the FHCF data call.
What is data lineage in reinsurance?
It is the trail from a figure in the submission back to the system, extract and transformation that produced it, and to the person or agent responsible. Lineage answers the reinsurer's most common follow-up question, "where does this come from?", without a week of email. On the sample, total insured value of $86.4B in section 2.1 traces to the policy administration system, extract inforce_20260930.csv with 412,860 rows, extracted on 13 October at 06:10, summed by the exposure profile builder. Ida's trended loss of $186.8M traces to the claims listing at 30 September and a 1.31 factor approved by the pricing actuary on 2 October.
Supervisors set a similar bar for data behind automated systems. EIOPA's opinion on AI governance says the data used to train and test an AI system should be "complete (e.g. sufficient historical information), accurate (e.g. no material errors) and appropriate" for its purpose, with any limitations documented. Lineage is how a ceded team shows all three for the figures it sends out.
Is there a standard for reinsurance data?
Not across the market. The Casualty Actuarial Society's reinsurance working group asked in 2026 for research on data guidelines precisely because reinsurance pricing data lacks a standard, as set out in reinsurance submission data requirements. Where a format is prescribed, it is prescribed by a single body for a single purpose: the Florida Hurricane Catastrophe Fund's annual data call, for example, fixes a 20-field file layout for insured values by ZIP code, construction and deductible group. That is a standard for one filing, not for the market.
The practical answer is an internal standard: for each input, the source system, the as-at date, the minimum fields, the check it must pass and the owner. That is a short document, and it is what makes the rest of reinsurance data management possible.
Who owns which number: governance for one submission
Every figure in a submission should have exactly one owner, and the tool or process that assembles it should not be that owner. On the sample, the pricing actuary owns the trend factors, the catastrophe modelling lead owns the model run and own view, finance owns the plan, claims owns case reserves and the development notes, underwriting operations owns missing building characteristics, and the head of ceded reinsurance owns release. The agents own nothing they read.
Data controls a ceded team can put on one submission
- One cut-off date, written down
Used by the exposure chapter, the model input and any regulator filing describing the same book.
- A tolerance for agreement
On the sample, 0.5% between chapters, systems and the cover letter; anything larger is a gap.
- An owner and a due date for every gap
Seven on the sample, one of them blocking release.
- No figure without a trail
1,284 of 1,284 on the sample before release.
- Changes explained, not just shown
Every movement over 2% against last year has a reason in the text.
- Versioned settings and frozen releases
Thresholds and owners change only with a logged version; released files never change.
A warehouse, or agents across the systems?
Many teams answer the reconciliation problem by building a central store for reinsurance data. That can work, but it adds a system that must itself be fed from the others at the right dates, and it moves the reconciliation problem into the feed rather than removing it. The alternative is to leave each system as the source of its own data and do the reading, tying and drafting between them, keeping the trail. That is the design of Reinsurance Submission Preparation: its agents read extracts from the systems a cedant already runs, and none of them is replaced or duplicated.
What leaves for the broker: defined files, two signatures, a frozen version
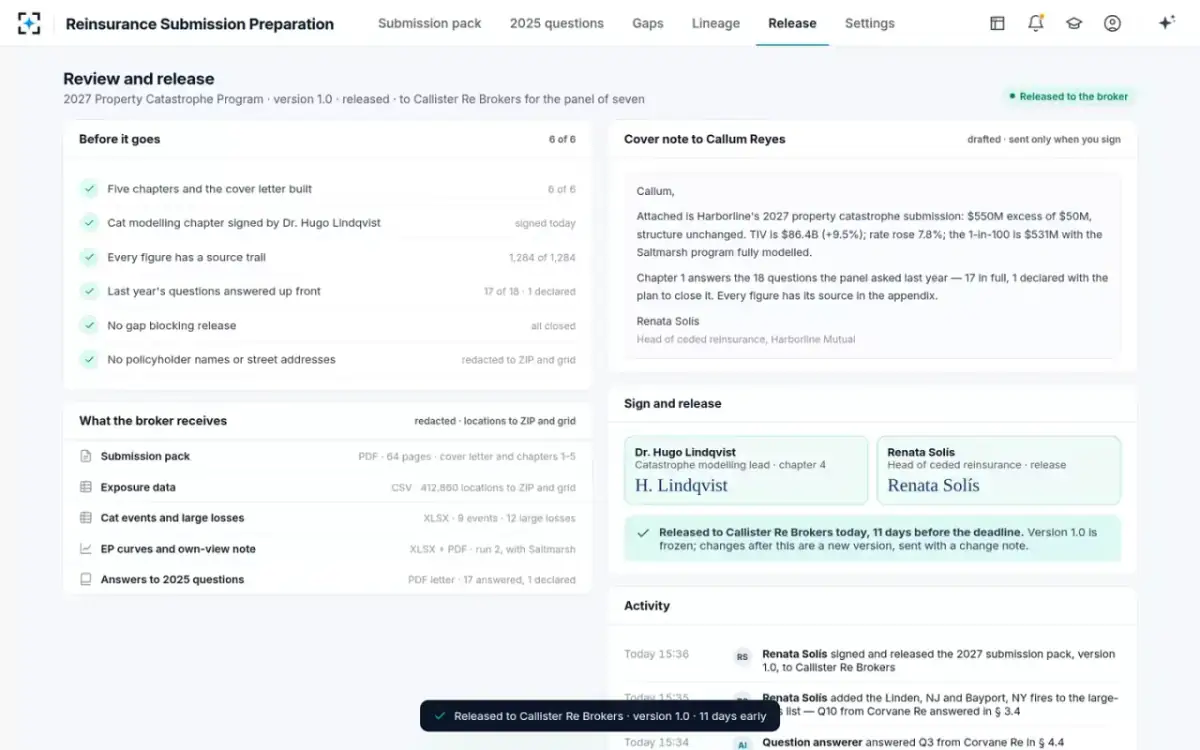
The solution is not an exposure management system, a master-data platform or a catastrophe model. Monitoring accumulations through the year and responding to an event are different jobs, served by Botminds' Catastrophe Event Response; what a reinsurer's exposure system needs before June sets out the first. What it manages is the narrow, high-stakes moment when all the systems have to agree in front of the market. The full sequence of that moment is traced in a reinsurance submission, built step by step.
Questions people ask
What is a bordereau in reinsurance data?
It is a periodic schedule of risks or premiums sent by a managing agent or other party writing business on the insurer's behalf. On the sample, a September risk bordereau received on 8 October carried the coastal program whose 6,214 locations were missing from the model input.
What is an in-force extract?
It is a file of every policy and location in force at a cut-off date, taken from the policy administration system. On the sample, inforce_20260930.csv held 412,860 locations at 30 September and was extracted on 13 October; it is the source of the submission's insured value.
What is an event loss table?
It is the catastrophe model's output listing each simulated event with its loss. The NAIC primer describes models producing an event loss table or a year loss table, from which exceedance probability curves and the average annual loss are calculated.
How often should exposure data be refreshed for reinsurance?
At least at each renewal, from a cut-off date shared by every document that describes the book. The sample's model input was built three weeks before the extract and missed $2.3B of insured value; refreshing the model input after the cut-off would have avoided the gap.
Who should own reinsurance data?
Each figure's owner is whoever owns its source system or judgement: underwriting for policy data, claims for losses, the pricing actuary for trend factors, the catastrophe modelling lead for the model. The ceded team owns the submission and its release, and the reconciliation between the owners.