Aggregate vs occurrence exceedance probability is the difference between asking how big a year's worst single catastrophe will be and how big all of a year's catastrophes will be together. The occurrence curve (OEP) gives the chance that at least one event in a year exceeds a given loss; the aggregate curve (AEP) gives the chance that the year's combined catastrophe losses exceed it. At any return period the aggregate loss is at least as large as the occurrence loss. A per-occurrence excess of loss layer is placed against the occurrence curve; an aggregate cover, a stop loss or the exhaustion of a layer's reinstatements is a question for the aggregate curve. A reinsurance submission that shows one where the other is needed misdescribes the program.
This guide sets out both definitions in regulators' words, then works them through a fictional sample program: Harborline Mutual's 2027 property catastrophe treaty of $550M excess of $50M in four layers with one reinstatement each, as prepared in Reinsurance Submission Preparation, Botminds' software in which six agents build a cedant's renewal submission and the catastrophe modelling lead signs the model chapter. The company and its figures are invented sample data.
Occurrence or aggregate: what each curve measures and which cover it answers
Occurrence exceedance probability (OEP): The chance that the largest single event in a year exceeds a loss
Aggregate exceedance probability (AEP): The chance that the total of all events in a year exceeds a loss
Occurrence exceedance probability (OEP): Each simulated year’s largest event loss
Aggregate exceedance probability (AEP): Each simulated year’s sum of event losses
Occurrence exceedance probability (OEP): The smaller of the two losses
Aggregate exceedance probability (AEP): Equal or larger: it adds every other event in the year
Occurrence exceedance probability (OEP): Per-occurrence catastrophe excess of loss layers: attachment and exhaustion
Aggregate exceedance probability (AEP): Aggregate covers, stop loss, reinstatement use, annual earnings and capital
Occurrence exceedance probability (OEP): Where one large event dominates a year
Aggregate exceedance probability (AEP): Where frequent mid-sized events add up: convective storm, winter storm
What is occurrence exceedance probability?
It is the probability that any single event in a year causes a loss above a given amount. The NAIC's catastrophe modelling primer for state regulators defines it as "the likelihood that the financial loss from a single catastrophic event will exceed a specified amount in any given year", and gives an example: an OEP of 1% for losses above $100 million means a 1% chance that at least one event in a year causes losses above $100 million. The curve is built by taking each simulated year's largest event and ranking those maxima.
The Casualty Actuarial Society's study note on reinsurance pricing explains why it is the usual curve on a catastrophe submission: "The model output is also used for management of accumulations, so typically an Occurrence Exceedance Probability (OEP) curve is calculated." A per-occurrence layer pays for each event separately, so what matters is how big individual events get.
What is aggregate exceedance probability?
It is the probability that the sum of all catastrophe losses in a year exceeds a given amount. The NAIC primer: the AEP "measures the likelihood that the total financial loss from all catastrophic events occurring in a single year will exceed a specified amount." Its example is a 5% AEP for losses above $50 million, a 5% chance that the year's combined catastrophe losses exceed $50 million. The CAS study note calls the same curve the "Annual Exceedance Probability", which is why the abbreviation is read both ways; the definition is the same.
Because every year's total is at least as large as its largest event, the aggregate curve sits on or above the occurrence curve at every return period. How far above depends on the peril. A book exposed mainly to rare, large hurricanes has curves close together in the tail; one exposed to frequent hail, tornado or winter storm can have a 1-in-10 aggregate loss well above its 1-in-10 occurrence loss.
What is the difference between OEP and AEP for a reinsurance program?
The occurrence curve tells a reinsurer how often a per-occurrence layer is reached by a single event; the aggregate curve tells it how much a whole year can take out of the program. The sample treaty shows both at work. Its four layers are per occurrence, so where they attach and exhaust is read off the occurrence curve. Each layer also carries one reinstatement at 100%, so each can pay its limit twice in a year, and whether a second storm finds limit left is an aggregate question.
The sample program as configured: four per-occurrence layers, one reinstatement each
Which EP curve is used for excess of loss pricing?
For a per-occurrence catastrophe excess of loss layer, the occurrence curve places the layer and the expected loss in the layer prices it. The NAIC primer explains that the return period "helps companies set the attachment/retention and exhaustion levels", and that is done on the occurrence basis for per-event layers. The CAS study note describes the layer's share of the average annual loss, with its standard deviation, as the starting point for the loss cost. Reinstatement premium, aggregate deductibles and annual aggregate limits then bring the aggregate view into the price.
For an aggregate stop loss or an aggregate excess cover, the aggregate curve is the right one throughout: the cover responds to the year's total, so its attachment and exhaustion are aggregate return periods. Quoting occurrence return periods for an aggregate cover makes it look far more remote than it is.
A worked example: four layers on the occurrence curve
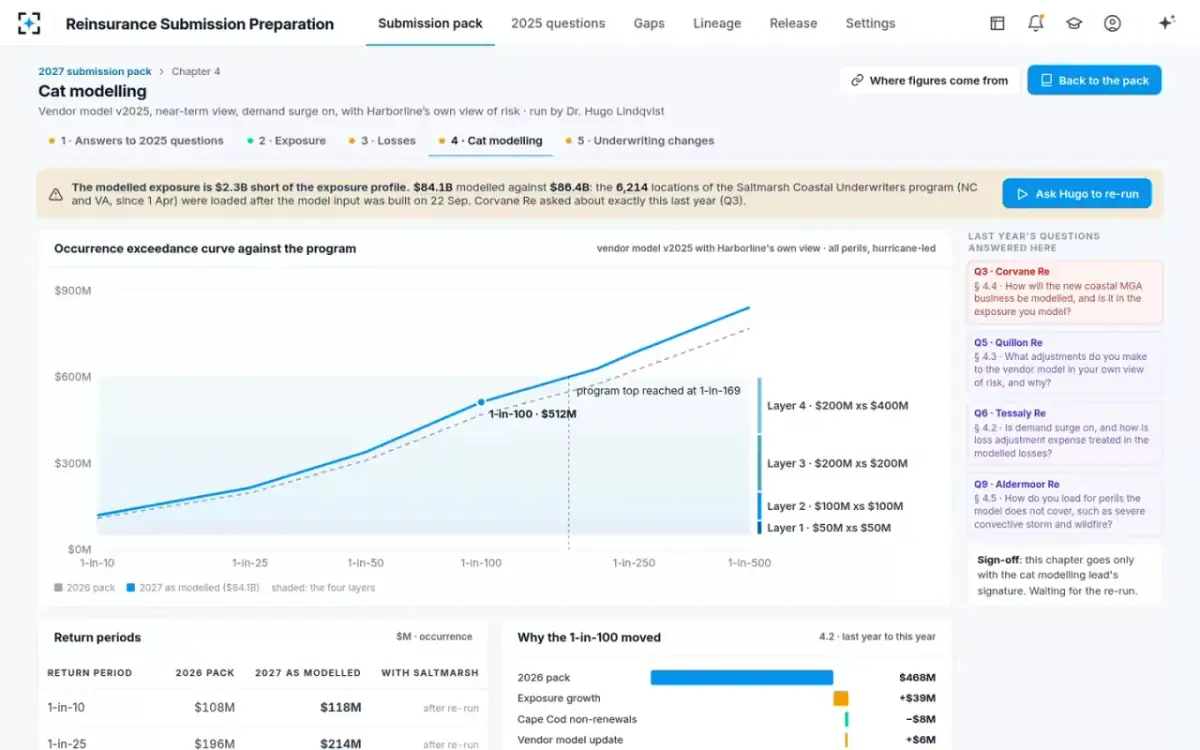
The sample's signed cat modelling chapter shows occurrence losses of $122M at 1-in-10, $222M at 1-in-25, $351M at 1-in-50, $531M at 1-in-100, $652M at 1-in-200, $711M at 1-in-250 and $874M at 1-in-500, with the program's $600M top reached at 1-in-148. Reading the layers against those points gives each one's place on the curve:
Where each sample layer attaches and exhausts on the occurrence curve
| Layer | Attaches at | Exhausts at | Read off the occurrence curve |
|---|---|---|---|
| 1: $50M xs $50M | $50M | $100M | Both points below the 1-in-10 loss of $122M: exceeded more often than one year in ten |
| 2: $100M xs $100M | $100M | $200M | Attaches below 1-in-10; exhausts between 1-in-10 ($122M) and 1-in-25 ($222M) |
| 3: $200M xs $200M | $200M | $400M | Attaches between 1-in-10 and 1-in-25; exhausts between 1-in-50 ($351M) and 1-in-100 ($531M) |
| 4: $200M xs $400M | $400M | $600M | Attaches between 1-in-50 and 1-in-100; exhausts at 1-in-148 |
The same table shows why a change in the curve matters more for some layers than others. Last year the program's top was reached at 1-in-226; this year at 1-in-148. The top layer now sits noticeably closer to the frequency at which it is hit, while the first layer, already exhausted by a 1-in-10 event, changes little. On the sample, the bridge behind that shift (exposure growth, a vendor model update, the own view and a coastal program missing from the first run) is traced in probable maximum loss in a reinsurance submission.
The occurrence curve with the four layers drawn on it
Where the aggregate curve takes over: reinstatements and the second storm
A layer with one reinstatement can pay its limit twice in a year, so its annual capacity is twice its occurrence limit. The CAS study note puts the general rule as an aggregate limit of one plus the number of reinstatements, times the occurrence limit. On the sample, the first layer can pay $50M for each of two events, $100M in all, and the reinstatement premium for the second limit is due when the first is used.
Whether that is enough is an aggregate question. If the first layer is exceeded by a single event more often than one year in ten, two such events in a year are not remote, and a third would find no limit left. The occurrence curve cannot answer that; it only knows each year's largest event. A submission that wants to show how a program performs across a bad year, as opposed to a bad day, needs the aggregate curve or a year-by-year view from the model.
Regulators run the same kind of test. Florida's annual catastrophe stress test requires insurers to model "a series of historical storm scenarios" and apply their purchased reinsurance to the losses, which tests reinstatements and aggregate limits rather than a single event. The scenarios and results are covered in the Florida annual reinsurance data call.
Which basis do regulators ask for?
For capital, the aggregate basis is preferred, and the occurrence basis permitted. The NAIC's risk-based capital instructions for the catastrophe risk charge, as reproduced in the 2025 proposal to add wildfire, say that "While projected losses modeled on an Aggregate Exceedance Probability basis is preferred, companies are permitted to report on an Occurrence Exceedance Probability basis if that is consistent with the company’s internal risk management process." The same instructions require modelled losses for the worst year in 50, 100, 250 and 500, of which only the worst year in 100 enters the charge.
That gives a ceded team a consistency check of its own. If the risk-based capital filing reports an aggregate 1-in-100 and the reinsurance submission quotes an occurrence 1-in-100, the two numbers will differ and both are right; they need labels. A submission that says only "1-in-100 PML" leaves the reader to guess which.
What does a 1 in 250 return period mean?
It means a loss with a 0.4% chance of being exceeded in any one year. The NAIC primer defines the return period as the reciprocal of the exceedance probability, so 1-in-250 is 1 divided by 250. On the sample's occurrence curve the 1-in-250 loss is $711M, above the program's $600M top, so a 1-in-250 event would leave Harborline retaining the loss above $600M. On an aggregate curve the 1-in-250 would be larger, because it includes every other event in that year.
Is a 100-year event once every 100 years?
No, and the regulators' primer says so directly:
"A frequent misconception is that an event with a 100-year return period will happen precisely once every 100 years. Such an event could happen in consecutive years or not at all for many centuries. The return period only indicates an average likelihood, not a schedule."
NAIC Catastrophe Modeling Primer (March 2025)
The arithmetic makes the point for a renewal horizon. If each year is independent, the chance of at least one exceedance over a span of years is one minus the chance of none. Over ten years, a 1-in-100 loss is exceeded at least once with a probability of about 9.6%; over thirty years, about 26%. For a layer exhausted by a 1-in-10 event, the chance of at least one hit in ten years is about 65%.
Chance of at least one exceedance over several years, by return period
| Return period | Annual probability | Over 10 years | Over 30 years | Over 100 years |
|---|---|---|---|---|
| 1-in-10 | 10% | 65.1% | 95.8% | ≈100% |
| 1-in-25 | 4% | 33.5% | 70.6% | 98.3% |
| 1-in-100 | 1% | 9.6% | 26.0% | 63.4% |
| 1-in-250 | 0.4% | 3.9% | 11.3% | 33.0% |
What a submission should say about its curves
Most confusion between the curves comes from labels, not mathematics. The sample's cat modelling chapter states its basis on every figure: return periods "$M · occurrence", the curve titled as an occurrence curve against the program, and the average annual loss shown separately. The reconciler reads both the occurrence and aggregate curves for the vendor model and the own view; the catastrophe modelling lead decides which are shown and signs the chapter.
Five things a catastrophe submission should state about its exceedance curves
- The basis of every return-period figure
Occurrence or aggregate, on every table and chart, not only in a footnote.
- Which curve places which cover
Occurrence for per-event layers; aggregate for stop loss, aggregate covers and reinstatement use.
- Vendor result and own view, side by side
With each adjustment and its size; on the sample, four adjustments adding $15M at 1-in-100.
- The change from last year, on the same basis
A bridge in dollars, so a reinsurer can reconcile its own run.
- Perils included and excluded
Frequent perils widen the gap between the curves; say how unmodelled perils such as convective storm are loaded.
Questions people ask
Is AEP always higher than OEP?
At the same return period the aggregate loss is never lower than the occurrence loss, because a year's total includes its largest event. The two can be close for books dominated by rare large events and far apart for books exposed to frequent mid-sized ones.
What is an EP curve?
It is the catastrophe model's ranking of simulated annual losses against the probability of exceeding them. The NAIC primer describes models generating exceedance probability on either an annual aggregate or an annual occurrence basis from the event catalogue run against the exposure.
What is AAL on an EP curve?
The average annual loss is the mean of all simulated years, the area under the curve rather than a point on it. On the sample it is $64.0M after the re-run; the NAIC primer calls it synonymous with pure premium or expected loss.
Which curve should an aggregate stop loss use?
The aggregate curve. A stop loss responds to the year's total losses, so its attachment and exhaustion are aggregate return periods; occurrence return periods would make it look more remote than it is.
Why does one source say annual and another aggregate exceedance probability?
Usage differs, not meaning. The NAIC primer uses "aggregate exceedance probability"; the CAS reinsurance pricing study note uses "Annual Exceedance Probability" for the probability that all modelled events in a year together exceed a loss.