Probable maximum loss in reinsurance is the loss a catastrophe model says a portfolio could suffer at a chosen probability, usually stated as a return period such as 1-in-100 or 1-in-250. In a property catastrophe submission it is the number reinsurers read first, because it tells them where the program's layers sit against the modelled risk. It is also the number most likely to have moved for reasons nobody wrote down. The same book can produce a different PML because the exposure extract was older, some locations were geocoded only to a ZIP code, the vendor released a new model version, or the cedant's own view of risk changed.
This guide follows one PML from the policy system to the page the broker sends. It uses a fictional sample, Harborline Mutual's 2027 property catastrophe program of $550M excess of $50M, as it runs through Reinsurance Submission Preparation, Botminds' software in which six agents build a cedant's renewal submission from its own systems while people keep the model, the factors and the release. The company, its people and every figure about it are invented sample data.
One 1-in-100, traced: seven stops between a policy row and page one
| Stop | What happens to the number | Where it can change without anyone deciding | On the sample |
|---|---|---|---|
| 1. Policy rows | In-force locations and insured values are extracted at a cut-off date | An older extract, or a book written through an agent that was never joined | 412,860 locations, $86.4B at 30 Sep |
| 2. Geocoding | Each address becomes a latitude and longitude, at some resolution | Low-resolution matches push the model to assumptions | 93.8% rooftop; 1,206 locations at ZIP only |
| 3. Model input file | Values, construction, occupancy and policy terms loaded for the model | Built before the extract, so it misses new business | Built 22 Sep, $84.1B: $2.3B short |
| 4. Vendor model run | Event catalogue run against the input, losses by event and year | A new model version moves results by county or in total | Vendor update adds $6M at 1-in-100 |
| 5. Own view of risk | The cedant adjusts the vendor result to its view | Adjustments carried over from last year without review | Four adjustments add $15M |
| 6. EP curve | Losses ranked into an occurrence or aggregate curve | The wrong curve chosen for the layer being described | Occurrence basis: $512M, then $531M |
| 7. Page one | The figure is quoted in the cover letter and chapter 4 | Last year’s number retyped, or a pre-re-run number kept | Cover note: 1-in-100 of $531M |
What is probable maximum loss in reinsurance?
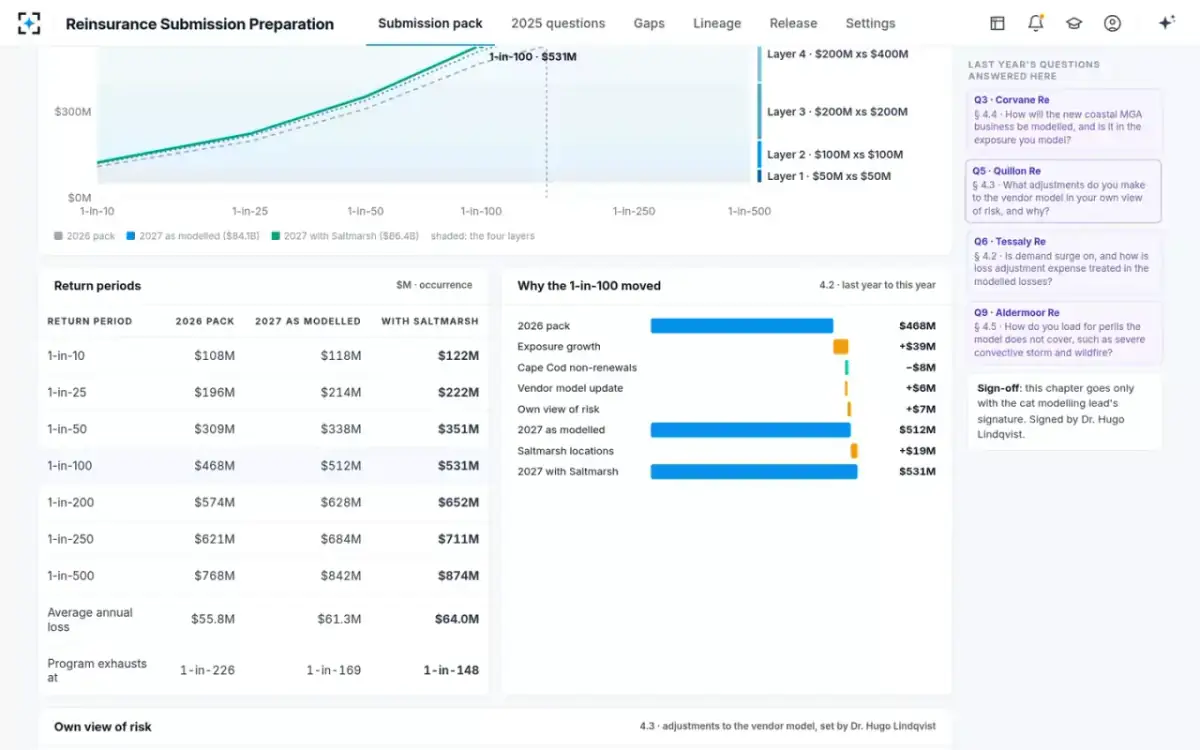
It is a point on a loss distribution, chosen by its probability. The NAIC's catastrophe modelling primer for state regulators defines it this way: "The PML represents the estimated maximum amount of loss a company could face from a single catastrophic event based on a specific probability or return period." The word "maximum" misleads. A 1-in-100 PML is not the worst case; it is the loss that a one-in-a-hundred annual probability is attached to, and bigger losses sit further out on the same curve. On the sample, the 1-in-250 is $711M and the 1-in-500 is $874M, both above the 1-in-100 of $531M.
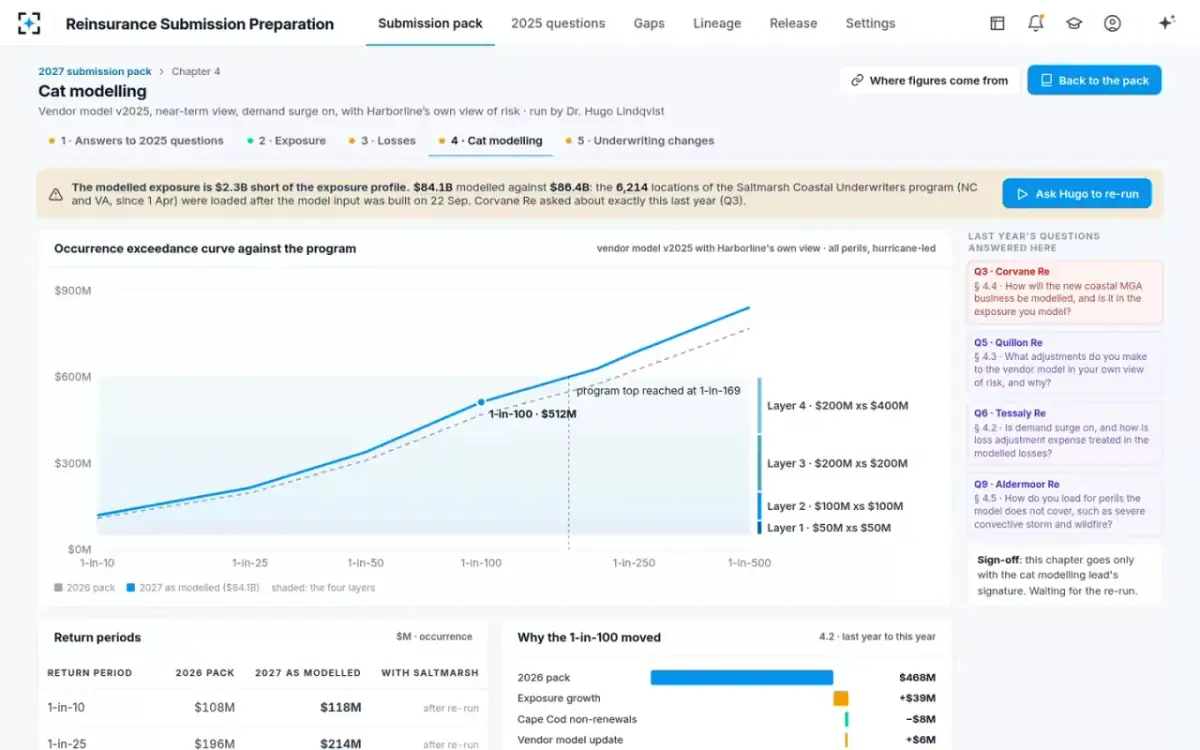
In a reinsurance submission the PML does a specific job. It shows reinsurers where each layer of the program attaches and where the program runs out, measured in return periods. On the sample the program's top at $600M is reached at a 1-in-148 occurrence loss. Last year's submission put it at 1-in-226. The layers did not change; the modelled risk under them did.
What is a 1 in 100 year PML?
It is the loss with a 1% chance of being exceeded in any one year. The return period is the reciprocal of the annual exceedance probability, so 1-in-100 means 1%, 1-in-250 means 0.4%. A submission has to say which curve the probability comes from. On an occurrence basis, the 1-in-100 is the size of the largest single event in a 1% year; on an aggregate basis it is the total of all events in such a year, which is always at least as large. Harborline's figures are occurrence figures, because its layers are per-occurrence excess of loss. The difference, and where each curve is the right one, is worked through in aggregate vs occurrence exceedance probability.
How is probable maximum loss calculated?
A catastrophe model simulates many years of possible events against the cedant's exposure, records the loss each event would cause, and ranks the results. The NAIC primer describes four modules: hazard, which generates the event catalogue and each event's footprint; vulnerability, which turns local intensity into damage; exposure, which holds the locations, values, characteristics and policy terms; and financial, which applies deductibles and limits to produce insured loss. The ranked losses form an exceedance probability curve, and the PML is read off it at the chosen return period.
The professional texts list what the model needs from the cedant before any of that can run. The Casualty Actuarial Society's study note on reinsurance pricing names exposure values with construction and occupancy, geographic information converted to coordinates by a geocoding engine, the terms of the underlying policies, and the details of inuring reinsurance, adding that where values are aggregated "by zip code or state" the results are less precise. Each of those inputs is a stop in the table above, and each can change between last year's submission and this year's without the PML's owner being told.
Why do cat model results differ?
Because the model is only as fixed as its inputs, settings and version, and all three move. The NAIC primer is direct about it: "Catastrophe model results can vary significantly, even with the same exposure data input, due to differences in data specifications and underlying assumptions." It adds a second regulatory concern, that "the same model's results can change dramatically with an update to a new version, either on an aggregate basis or by segment (e.g., county)." Companies respond, the primer notes, by choosing settings that suit their books, adjusting output or blending models.
For a submission, that means a PML without its context is not comparable to last year's. The sample's chapter 4 states the vendor model version, the near-term view, that demand surge is on, and the four own-view adjustments the catastrophe modelling lead made: +$12M for near-term hurricane frequency in North Carolina and Virginia, −$5M for barrier-island surge using elevation data, +$6M for winter freeze from experience and +$2M for roof-age uncertainty. A reinsurer that sees those can reconcile its own run to the cedant's. A reinsurer that sees only "$531M" has to guess.
Chapter 4 as first built: the occurrence curve against the layers, and a gap called out
How does data quality affect cat model output?
It sets the uncertainty around the number more than the number itself. The NAIC primer's point on location data is the one every cat modeller knows: the coarser the geocoding, the wider the uncertainty in the modelled loss (NAIC primer; geocoding accuracy on a property schedule shows how it is measured). A location matched only to a postal code is placed by assumption, and for perils whose hazard changes over short distances, such as flood or wildfire, the assumption can be badly wrong. Missing building characteristics are filled by defaults in the same way.
"…better data quality does not guarantee a lower modeled loss, but it does ensure a more accurate representation of the risk."
NAIC Catastrophe Modeling Primer (March 2025)
That cuts both ways in a renewal. On the sample, 387,262 of 412,860 locations are geocoded to rooftop, 24,392 to street and 1,206 only to ZIP code; the ZIP-only group is 0.3% of locations and $214M of insured value, down from 2,940 locations a year earlier. Reporting that improvement in the submission tells reinsurers that part of any movement in the PML comes from better placement, not a riskier book. Leaving it out invites them to load for an uncertainty that has already shrunk.
The bridge: why the 1-in-100 moved, in dollars
A reinsurer comparing two submissions wants the PML's movement split into causes, and the cedant is the only party that can do it. The cat model reconciler builds that bridge from last year's 1-in-100 to this year's and the catastrophe modelling lead signs it. On the sample, the gap in the model input was the largest single item the bridge exposed.
Why the 1-in-100 occurrence loss moved from $468M to $531M
The re-run moved every return period, not only the 1-in-100. On the sample, the 1-in-50 went from $338M to $351M, the 1-in-250 from $684M to $711M and the average annual loss from $61.3M to $64.0M. The table of return periods in the signed chapter shows three columns side by side: last year's submission, this year as first modelled, and this year with the missing locations. That table is the answer to the question a reinsurer most often asks of a PML: compared with what?
After the re-run: three columns of return periods and the bridge, signed
What is the difference between AAL and PML?
The average annual loss is the mean of the whole distribution; the PML is one point in its tail. The NAIC primer treats the AAL as the same thing as pure premium, the expected loss, and the most common metric in catastrophe ratemaking. A reinsurer uses the layer's share of the AAL as a starting point for the layer's expected loss and the PMLs to see where the layer sits and how often it is likely to be reached. Both belong in a submission, and they answer different questions.
AAL and PML answer different questions about the same curve
Average annual loss (AAL): The average of all simulated years’ losses
Probable maximum loss (PML): The loss at a stated annual exceedance probability
Average annual loss (AAL): What does this book, or this layer, cost on average each year?
Probable maximum loss (PML): How bad is a year of a given rarity, and does the program reach it?
Average annual loss (AAL): Pricing: the expected loss in a layer is the start of its premium
Probable maximum loss (PML): Structure: where layers attach and exhaust, and capital
Average annual loss (AAL): Moves with the whole book, including frequent small events
Probable maximum loss (PML): Moves with tail drivers: coastal values, geocoding, model version
Average annual loss (AAL): $64.0M a year after the re-run, against $55.8M in last year’s submission
Probable maximum loss (PML): 1-in-100 of $531M; program top reached at 1-in-148
Where regulators use the 100-year PML
The same figure feeds the cedant's capital requirement, which is one more reason it must match across documents. The NAIC primer explains that 100-year PML model outputs for earthquake and hurricane "are currently calculated in the catastrophe risk charge (Rcat)" of the risk-based capital formula. A proposal from the NAIC's Catastrophe Risk Subgroup, exposed for comment by the subgroup and its working group on 12 November 2025, "formally recommends adding wildfire peril to the Rcat component", with severe convective storm still reported for information only. A 1-in-100 that differs between the reinsurance submission and the capital filing is a question the domestic regulator can ask as well as the reinsurer.
What a reinsurer does with your PML
It places the layers on its own curve and compares. Reinsurers run the cedant's exposure through their own models and settings, so the cedant's PML is not taken as given; it is a reference point. What makes the cedant's figure useful is everything around it: the extract it came from, the geocoding mix, the version and settings, the own-view adjustments and the bridge from last year. A submission that carries those lets the reinsurer explain the difference between its run and the cedant's. One that does not leaves an unexplained gap, and an unexplained gap is priced.
On the sample, the reconciler's check that blocked release was simple: the model input held $84.1B against an exposure profile of $86.4B, above the tolerance. The same check, run on the day the chapters were assembled, gave the catastrophe modelling lead time to re-run before the broker's deadline. The data a submission needs for the model to be trusted is listed in reinsurance submission data requirements, and the systems it comes from are mapped in reinsurance data management.
Questions people ask
What is a return period?
It is the reciprocal of the annual exceedance probability: a 1-in-100 loss has a 1% chance of being exceeded in any year. The NAIC primer warns that it indicates an average likelihood, not a schedule, so a 100-year loss can happen in consecutive years.
Is the 1-in-100 PML the worst case?
No. It is one point on the curve, and losses at rarer return periods are larger. On the sample, the 1-in-500 occurrence loss is $874M against a 1-in-100 of $531M.
Should a submission show the PML gross or net of other reinsurance?
It should say which. A catastrophe cover usually applies after other reinsurance such as surplus share and per-risk treaties, so the Casualty Actuarial Society's pricing note lists inuring reinsurance among the inputs a model needs; a gross figure shown against net layers overstates how often they are reached.
Does the PML include demand surge and loss adjustment expense?
Only if the run says so. On the sample, demand surge is on for hurricane and winter storm, and loss adjustment expense is loaded at 6.5% of loss outside the model and shown separately, which is exactly what one reinsurer asked last year.
How close to the renewal should the PML be re-run?
Close enough that the model input matches the exposure in the submission. On the sample, an input built three weeks before the extract left out $2.3B of insured value; the re-run moved the 1-in-100 by $19M.
Who signs the PML in a submission?
The catastrophe modelling lead, who owns the model run and the view of risk. In the solution the agents read the curves and check the input against the exposure, but the chapter cannot be released without the lead's signature.