A reinsurance recovery ratio is used for three different measures: recoveries as a share of gross paid losses, which describes the program; cash collected as a share of what was billed, which describes collections; and recoveries billed as a share of what the contracts say is owed, which describes whether the ceded team is finding its money. Only the third tells a head of ceded reinsurance or a CFO whether the program is paying what it was bought to pay, and it is the one almost nobody reports, because it needs a second, independent view of what is owed. Five more numbers complete the picture: days from a paid movement to a bill, recoveries found late, each reinsurer’s slow-payer ratio, overdue and disputed shares, and the movement in the provision for reinsurance. Botminds’ Reinsurance Recoverables Management produces all six from the same nightly check of every paid loss against every cover.
The sample figures come from the solution’s fictional insurer, Ashgrove Mutual, and its third quarter of 2026: 4,812 paid claims, $96.40 million paid. Public figures come from FEMA, the Bureau of Economic Analysis, the NAIC and the Casualty Actuarial Society.
Six numbers for a ceded reinsurance team, defined, with the line each one answers to
1Recovery ratio
How it is computedRecoveries billed ÷ recoveries the contracts say are owed on the period’s paid losses
What it answers toNo regulatory definition; the team’s own completeness measure
Sample quarter47.6% as booked; every found recovery billed after the check
2Days from paid movement to bill
How it is computedMedian days from the payment that creates a recovery to a bill sent with proof
What it answers toEvery day sits on the insurer’s net result
Sample quarterQuarter end by hand; a design target of 1 day
3Recoveries found that nobody billed
How it is computedValue of recoveries found after the period’s bills went out, per quarter
What it answers toThe leakage the first two measures hide
Sample quarter$11,160,250 in one quarter, five losses
4Slow-payer ratio, per reinsurer
How it is computedPaid recoverables over 90 days overdue ÷ (paid recoverables + amounts received in the last 90 days)
What it answers toThe annual statement’s 20% test
Sample quarterTwo reinsurers at 20.2% and 20.3%
5Overdue and disputed shares
How it is computedUndisputed balances over 90 days, and disputed balances, each ÷ billed and outstanding
What it answers toThe NAIC model regulation’s prompt-payment tests
Sample quarter10.6% overdue, 4.9% disputed
6Provision movement
How it is computedChange in the provision for reinsurance, estimated each quarter
What it answers toA direct charge to surplus at year end
Sample quarterEstimate from numbers 4 and 5
What is a reinsurance recovery ratio? Three ratios share the name
There is no regulatory definition, so the name is used for three ratios that answer different questions. Recoveries ÷ gross paid losses tells you how much of the loss the program took, which is a matter of how it was bought: a program with high retentions will show a low ratio however well it is run. Collected ÷ billed tells you how well collections works. Billed ÷ owed tells you how much of the program’s value the team actually claimed.
FEMA’s published reinsurance results show why the first two can mislead. For Hurricane Harvey, FEMA reports that it "has paid NFIP policyholders over $9.03 billion for claims", and that its 2017 traditional reinsurance paid out in full: all $1.042 billion of it (FEMA, NFIP Reinsurance). Recoveries were 11.5% of paid claims, which describes the size of the cover FEMA bought; the whole placement was collected, which describes a clean collection. Neither says whether anything else was owed and not claimed, and on a commercial insurer’s program of per-risk, catastrophe, clash and facultative covers that is the main question.
One public program, two recovery ratios that answer different questions
$9.03B
paid to NFIP policyholders for Hurricane Harvey claims, as of 31 July 2021
$1.042B
reinsurance recovered: the whole 2017 traditional placement
11.5%
recoveries ÷ claims paid: a measure of how much cover was bought
100%
of the placement’s $1.042B recovered: a measure of collection
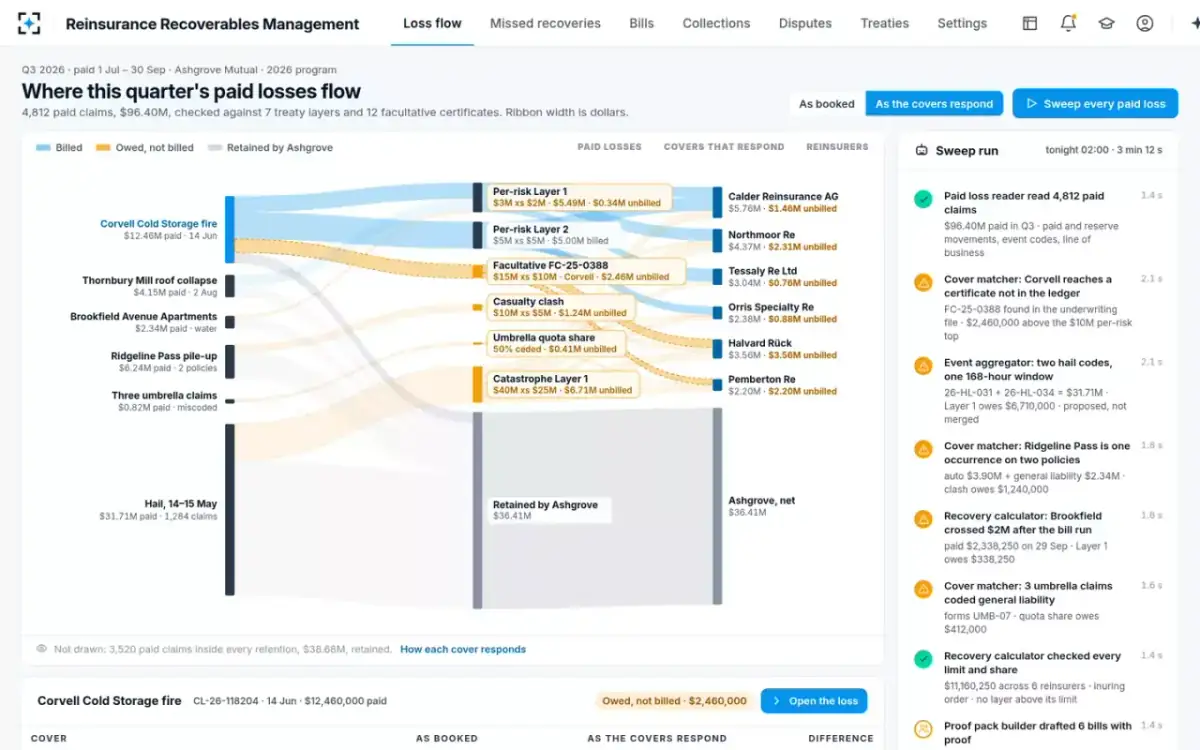
On the sample quarter the third ratio is the striking one. As booked, Ashgrove had billed $10.15 million of recoveries against paid losses on which the contracts supported $21.31 million: a billing ratio of 47.6%. After the nightly check found five missed recoveries and the analyst accepted them, the bills covered all of it.
Where the sample quarter’s $96.40 million of paid losses sits, before and after the check
As booked
- Inside every retention · 40%
- Retained above a retention · 49%
- Billed to reinsurers · 11%
As the covers respond
- Inside every retention · 40%
- Retained above a retention · 38%
- Billed to reinsurers · 11%
- Owed, not billed · 11%
How do you measure reinsurance recoveries? Against an independent view of what is owed
Measure recoveries against what the contracts support on the period’s paid losses, worked out independently of the bills. A team that measures only what it billed will always score well, because it cannot see what it did not bill. The independent view can come from a periodic re-test of every paid loss against every cover, from a planted-miss audit, or from a nightly check like the solution’s. Planting ten missed recoveries in a closed quarter gives a team the answer key to compute the ratio honestly once a year.
At national level, the Bureau of Economic Analysis publishes a cousin of the first ratio for cross-border insurance. In 2024, U.S. residents paid $229,166 million of premiums to foreign insurers and recovered $118,189 million of losses; in 2023 the figures were $191,148 million and $112,306 million (BEA, U.S. International Transactions). Losses recovered were 51.6% of premiums paid in 2024 and 58.8% in 2023. The ratio moves with catastrophe years and pricing, which is the point: it describes the market, not anyone’s operations.
Losses recovered from foreign insurers per dollar of premium paid, U.S., 2023 and 2024
Number two: days from paid movement to bill
Days to bill measures how long a recovery sits on the insurer’s net line after the payment that created it. With a quarterly bill run, payments spread evenly through a 13-week quarter wait about six and a half weeks on average before their bill is even drafted, and the reinsurer’s payment terms start after that. The sample certificate’s settlement clause makes amounts "payable within 30 days of receipt of proof of payment", so a bill delayed is cash delayed one for one.
The solution’s design target is one day from a paid movement to a bill with its proof, with the cadence as a setting: on each paid movement, next business day, weekly or quarter end. Measure the median and the slowest decile; the slow tail is usually the losses that needed a document from claims, which tells the head of ceded reinsurance where to look.
Number three: recoveries found that nobody billed
This is the measure of leakage: the value of recoveries found after a period’s bills had gone out. On the sample quarter the nightly check found five, worth $11,160,250 across six reinsurers: a certificate never loaded, a storm split into two event codes, a clash occurrence across two policies, a retention crossed the day after the bill run, and three claims coded to the wrong line. Report it per quarter, with the cause of each find, because the causes repeat until the process changes.
The quarter’s paid losses as the covers respond: what is billed, what is retained, what is owed
What is the slow pay test? Number four, per reinsurer
The slow pay test asks whether too much of a reinsurer’s paid-loss balance is more than 90 days overdue. A CAS study note describes the annual statement’s version: slow payers "are reinsurers where the ratio of reinsurance recoverable on paid losses and LAE more than 90 days overdue represents greater than 20% of total reinsurance recoverable on paid losses and LAE plus amounts received in the 90 days prior to December 31, current year" (Odomirok et al., CAS, 2014). The test is applied per reinsurer at year end, so tracking it weekly is the only way to act before 31 December.
The solution runs the annual statement’s slow-payer test weekly. On the sample quarter two reinsurers sat just over the line: Tessaly Re at 20.2% ($1.84 million over 90 days against $6.12 million of paid recoverables plus $2.98 million received in the last 90 days) and Pemberton Re at 20.3%. Because a payment moves money from the first term of the denominator to the second, the denominator does not change when a reinsurer pays; only the numerator falls. That makes the distance to the line easy to compute: for Tessaly, about $20,000 of overdue cash.
What is overdue reinsurance? Number five, and the disputed share beside it
Overdue reinsurance, in the annual statement’s sense, is a paid-loss recoverable more than 90 days past due for reasons other than a dispute. The CAS study note describes "overdue" reinsurance as that "for which the amount of paid loss and LAE recoverable is over 90 days past due for reasons other than dispute between the insurance company and the reinsurer" (Odomirok et al., CAS). Disputes are counted separately, and both matter: the NAIC’s model regulation treats a reciprocal-jurisdiction reinsurer as lacking prompt payment where, among other tests, more than 15% of its recoverables are overdue and in dispute, or where its undisputed paid recoverables 90 days or more overdue exceed $50 million in total (NAIC Model Regulation 786).
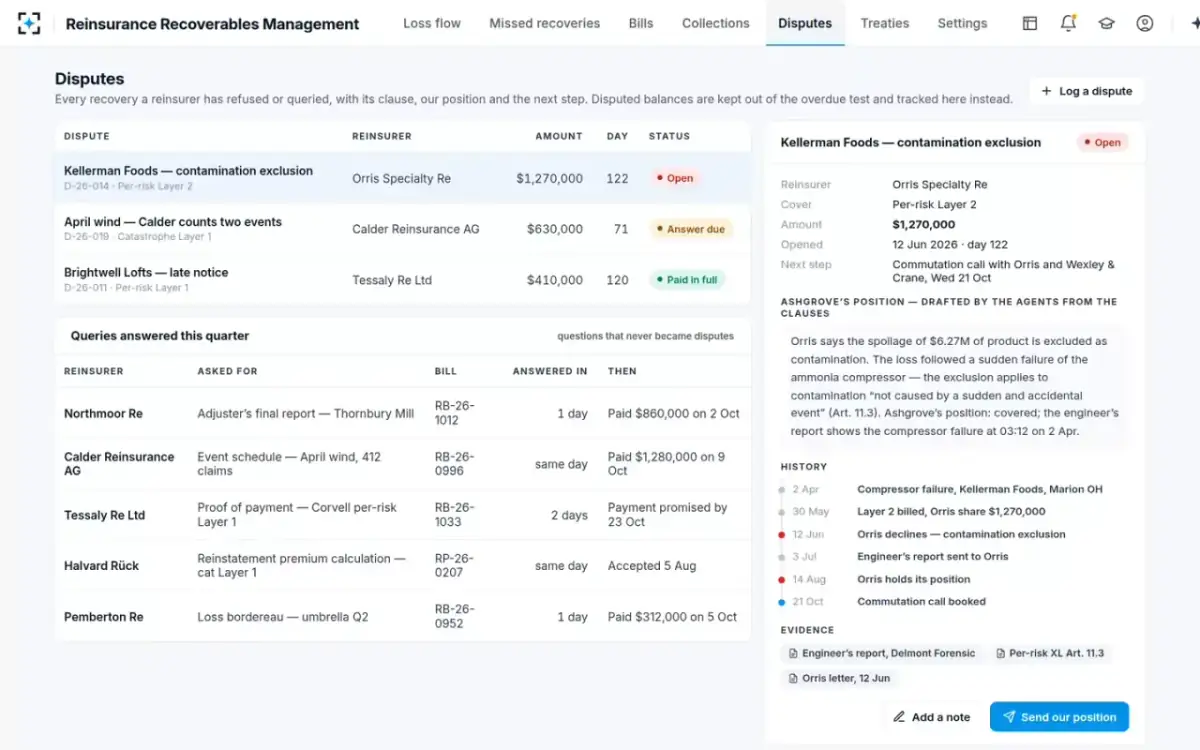
On the sample quarter $38.60 million was billed and outstanding, of which $4.11 million (10.6%) was over 90 days and undisputed, and $1.90 million (4.9%) was in dispute. Track both shares per reinsurer as well as in total, and watch the disputed share for movement: a sudden rise is either a reinsurer contesting coverage or a team filing queries as disputes, and the two need different answers.
The disputed share, line by line
Why the provision for reinsurance movement is number six
The provision for reinsurance is a statutory liability for recoverables that may not be collected, and its change goes straight to surplus. The CAS study note puts it plainly: "The change in this provision is recorded directly to surplus" (Odomirok et al., CAS). NAIC Issue Paper No. 75 explains that regulators kept it when statutory accounting was codified as an extra layer of conservatism (NAIC Issue Paper No. 75; the Schedule F penalty works the formula).
Because the provision is computed at year end from numbers four and five, a CFO who sees those two weekly can estimate the provision every quarter and act on the reinsurers that drive it. One related notice belongs on the same dashboard: the NAIC credit-for-reinsurance model law requires a domestic insurer to notify its commissioner within 30 days once recoverables from any single reinsurer or affiliated group exceed 50% of its last reported surplus (NAIC Model Law 785, Section 2K).
Who owns each number, and what they get from a nightly check
Today
Sees billed recoveries at quarter end, with no view of what was missed.
With agents
Gets the recovery ratio and the value found late each quarter, with the cause of each find.
Still theirs: Numbers 1 and 3, and what changes when a cause repeats
Today
Bills from a quarterly extract.
With agents
Works from nightly findings; days to bill becomes a number she can move.
Still theirs: Number 2
Today
Ages balances in a spreadsheet near year end.
With agents
Sees each reinsurer’s slow-payer ratio and overdue share every week, with reminders drafted.
Still theirs: Numbers 4 and 5
Today
Learns the provision when the annual statement is prepared.
With agents
Sees an estimate each quarter, built from the weekly ratios.
Still theirs: Number 6 and the concentration notice
Six numbers is enough for a monthly page to the CFO and a weekly page to the team. The value of producing them from one nightly check is that they agree with each other: the recovery ratio, the found value and the overdue shares all come from the same view of every paid loss. To see the six on your own program, start from Reinsurance Recoverables Management, or test the software first with a pilot on last quarter’s paid losses.
Questions people ask
What is a reinsurance recovery rate?
Usually the same as one of the recovery ratios: cash collected as a share of what was billed over a period. It is a collections measure and can be 100% while a team misses half of what it is owed. Pair it with billed ÷ owed, which needs an independent check of every paid loss against every cover.
What KPIs matter for reinsurance recoverables?
Six cover most needs: the billing ratio (billed ÷ owed), days from paid movement to bill, recoveries found late, each reinsurer’s slow-payer ratio, overdue and disputed shares, and the estimated provision movement. The last three answer directly to tests the annual statement and the NAIC model regulation use.
What is a reinsurance aging report?
A table of paid-loss recoverables by reinsurer and age band. The 2011 annual statement form described in the CAS study note used bands of current, 1 to 29 days, 30 to 90 days, 91 to 120 days and over 120 days. The solution’s board uses 0–30, 31–60, 61–90, 91–180 and over 180 days, with disputes in a column of their own.
When does a reinsurance recoverable start to age?
The 2011 instructions described in the CAS study note age a paid recoverable from the date the contract says the claim is to be paid or reported, or, where the contract is silent, from the date an amount over $50,000 for a reinsurer is entered in the accounts as a paid recoverable. A late bill therefore uses up days of the 90 before the reinsurer has seen it.
Is a high ceded loss ratio good or bad?
Neither on its own. A high ratio of recoveries to ceded premium in a catastrophe year means the program did its job; in a quiet year it may point to pricing that favours the insurer. For operations, the ratio that matters is billed ÷ owed, which should be close to 100% in every year.