A pricing actuary job description in personal lines insurance comes down to four duties: estimate the premium the book needs (the indication), help the business decide what to file (the selection), turn that decision into rates, factors and rules and test what it does to each policyholder (the implementation), and sign the actuarial support the state insurance department reviews. The first duty is the one taught most; the third is the one that decides who pays more. Botminds' Rate Dislocation Analysis exists for it: it re-rates every policy in force under a proposed rate plan, shows the policyholders in the tail of large increases and the rating factor behind each, and counts the renewal notices the change will trigger, so the actuary signs a filing whose every count comes from one run.
The examples on this page come from a fictional sample carrier, Harrow Point Mutual, as its Texas homeowners program runs through the solution: 186,420 policies in force, $585.5 million of written premium and a rate change due to be filed on 3 November for renewals from 1 March. The labour-market figures come from the U.S. Bureau of Labor Statistics and the method from the Casualty Actuarial Society's ratemaking text, linked where they appear.
A small profession that is growing
$130,000
median annual pay for actuaries in 2025
31,200
actuary jobs in the United States in 2025
9%
projected growth in actuary jobs, 2025–35: much faster than average
What does a pricing actuary do? Indication, selection, implementation, signature
A pricing actuary sets the price of insurance before anyone knows what the claims will cost, and has to show the regulator the reasoning. In personal lines that means homeowners, renters and private passenger auto, rated policy by policy from a manual of base rates, relativities and rules.
The indication is the estimate of what rates need to be. The NAIC's handbook for rate reviewers sets out the loss ratio method in one line: the indicated rate is the old rate times one plus the indicated change, where the change compares the projected loss and expense ratio with the target (NAIC Product Filing Review Handbook, 2024). The projection is where the craft is. Werner and Modlin's ratemaking text gives the classic trap: if rates were $200 during the experience period, a 5% increase has since taken them to $210 and the true need is $220, an actuary who forgets the 5% concludes rates must rise 10% and sets them at $231, when the right increase is 4.8% (CAS, Basic Ratemaking). Restating old premium at today's rates, "on-leveling", is the first place a pricing actuary re-rates the book.
The selection is what the company decides to file. The same NAIC handbook describes the indicated change as the company's best estimate of its needs, and accepts that a company may depart from it for competition, marketing, legal concerns or the effect on retention, provided it justifies the departure within the law. In practice the product manager and the head of the line own that decision, and the actuary owns the evidence for it.
The implementation turns a selected overall change into a manual: which territories, roof ages, deductibles and protection classes move by how much, the base-rate adjustment that keeps the overall change where it was selected, any cap on individual increases, and the eligibility rules. The signature is the actuarial memorandum and exhibits that go to the state, usually through SERFF.
Who pays more is decided in the handoffs, after the indication
A person decides
Pricing actuary: the indicationProjects losses and expenses to the period the rates will be in force and compares them with premium at current rates. Output: an overall indicated change and indicated relativities.
Agent
Re-rate the bookEvery policy in force rated under the proposed plan, scenario by scenario. In the sample run: 186,420 policies, +11.9% overall with every factor at its full indication.
Never: changes a filed rate or a policy
Agent
Explain each increaseSplits each policy's change into its rating factors, in rating order, and ranks what drove the tail.
A person decides
Product manager and head of the line: the selectionChoose the scenario to file. In the sample, territory goes in at 60% of its indication: +8.6% overall, and 9,165 policyholders above +25% instead of 23,802.
Agent
Propose the cap and count the noticesPrices a renewal cap, counts the policies capped and the notices each state requires, by renewal month.
Never: puts a cap in a scenario without the actuary
A person decides
Pricing actuary: the signatureSigns the memorandum once the exhibits, the cap rule and the notice count all tie to one run.
The pricing actuary job description, duty by duty
A useful job description lists outputs, not adjectives. The table below is the work of a personal lines pricing actuary written that way, with the reader of each output; a posting that lists only the first two rows, and folds the other five into "supports rate filings", describes half the job.
Seven outputs a personal lines pricing actuary is responsible for
| Duty | What it produces | Who relies on it |
|---|---|---|
| Indication | Overall indicated change by state and coverage; experience on-leveled, developed and trended | Chief actuary, head of the line |
| Classification review | Indicated relativities for territory, roof age, deductible, protection class and other variables, often from a GLM | Product manager, model risk, the regulator |
| Scenario testing | Overall change, premium, tail and notices for each candidate selection | Product manager, head of the line |
| Dislocation analysis | The distribution of premium changes across the in-force book, by segment, with the largest increases explained | Agents and call centres, the regulator |
| Capping and transition rules | A rule limiting each renewal increase, its cost, and how many renewals it takes to reach the filed premium | Regulator, compliance |
| Filing exhibits and memorandum | Rate data, distribution exhibit, rule text and the policyholder-impact paragraph | Rate filing analyst, the state |
| Notice and nonrenewal counts | How many renewals cross each state's notice threshold, and when each notice must be mailed | Compliance, policy administration |
The rows matter because each has a different reader. The indication is read by the chief actuary. The dislocation analysis is read by the agents who will take the calls; Werner and Modlin suggest sharing the expected dislocation with the sales channel and the call centres before the change goes live. The notice count is read by compliance and, if it is wrong, by a market conduct examiner.
Four seats on one rate filing, and what each one needs from the actuary
The pricing actuary rarely decides alone who pays more. On a personal lines filing four people share the decision, and each asks the actuary a different question. The figure below follows the four seats on the sample Texas review, before and after the book is re-rated in one run.
The same Texas homeowners review, seen from four seats
Today
Can state the average change on Monday; can name the 23,000 policyholders above +25% only after a day rebuilding the workbook.
With agents
Moves one factor and sees the whole book re-rated, the tail and the factor behind each increase.
Still theirs: The indication, the method and the signature on the memorandum.
Today
Learns which renewals jumped when the agents call.
With agents
Opens the tail by territory and roof age before the notices are mailed and flags the renewals for an agent call.
Still theirs: The selection and the eligibility rules.
Today
Receives exhibits and a notice count from different extracts and has to decide which is right.
With agents
Gets the exhibits, the cap rule and the notice file from one run, checked to tie.
Still theirs: The filing and the regulator's questions.
Today
Asks what the company gives up in rate to keep the tail under control, and waits for the answer.
With agents
Compares saved scenarios side by side: year-one change, tail, capped policies, premium foregone, notices.
Still theirs: Approval of the scenario that is filed.
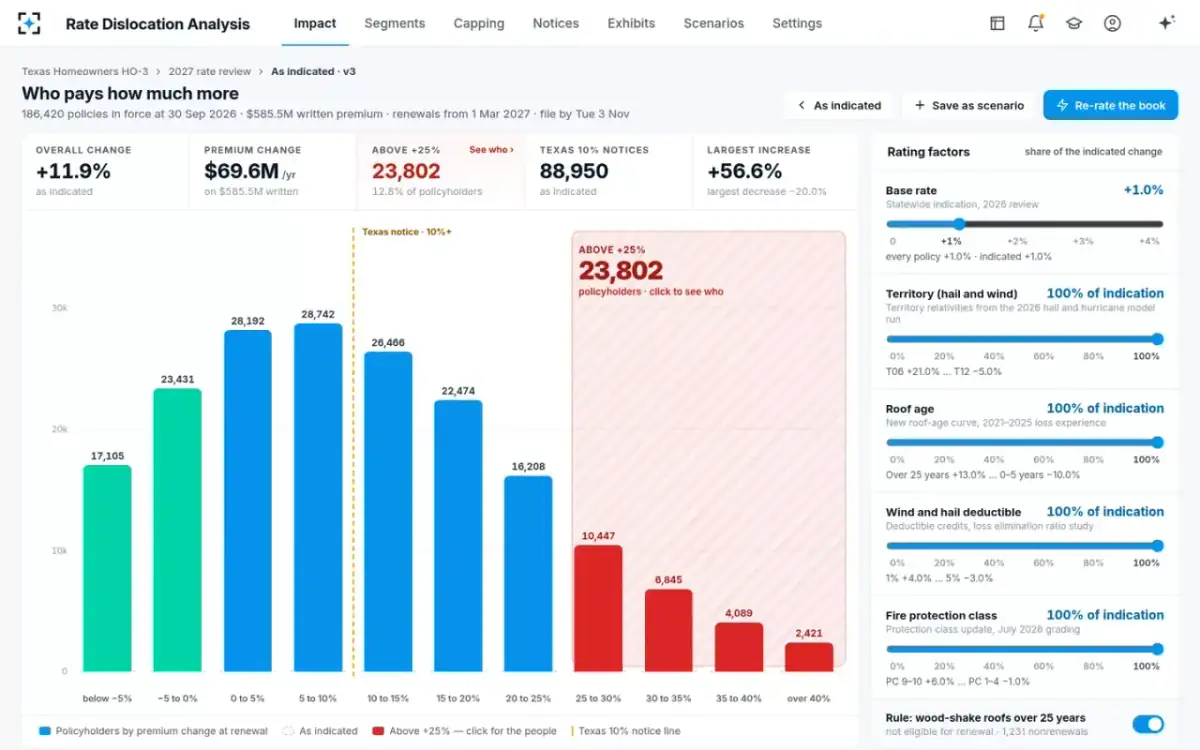
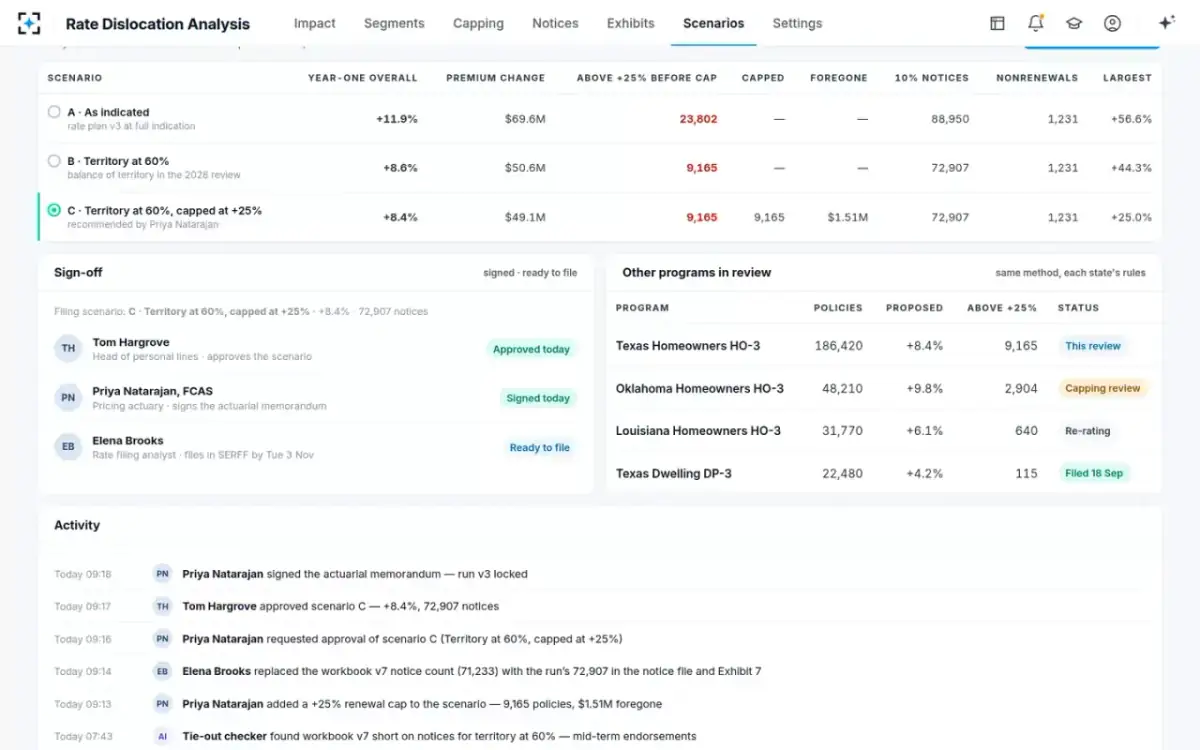
The product manager's question is the one that changes the price most often. On the sample book, the overall change with every factor at its full indication is +11.9%, but 23,802 policyholders, 12.8% of the book, face more than +25%, the largest at +56.6%. Most of that tail comes from one variable: territory leads for 61% of them, roof age for 12%, both for 27%. Taking territory at 60% of its indication, with the balance deferred to the next review, cuts the tail to 9,165 and the overall change to +8.6%. That is a selection decision with a cost in rate adequacy, and the actuary's job is to price it, not to make it.
What a dislocation analysis asks of a pricing actuary
A dislocation analysis counts how many existing customers get each size of rate change; the CAS text defines it that way, as a count of customers by amount of change. It is the step that turns a percentage in a memorandum into people, and the step where most pricing teams still rebuild a workbook for each scenario.
The reason it is hard is structural. A change to the base rate moves every policy by nearly the same amount. A change to relativities does not, because each policy carries its own combination of territory, construction, roof, deductible and protection class, and the changes multiply. Only re-rating each policy shows the combinations that stack: in the sample, a Frisco home in territory T06 with a 27-year roof, a 1% wind and hail deductible and protection class 9–10 goes from $3,960 to $6,203, +56.6%, though no single factor moved by more than 24.5%.
Regulators now ask for it by name. Among the information elements the NAIC's Casualty Actuarial and Statistical Task Force gives rate reviewers for models used in personal auto and home rating is C.7.d: a rate disruption or dislocation analysis showing the distribution of percentage and dollar impacts on renewal business, produced by re-rating the current book, with enough information to explain each consumer's change (NAIC, Regulatory Review of Predictive Models; the element's full text is in the GLM pricing model guide). A pricing actuary who cannot produce that distribution quickly, for any scenario, cannot answer the regulator's follow-up questions quickly either. How the distribution is read, and what a histogram shows that an average hides, is the subject of dislocation analysis in insurance.
The question a pricing actuary is asked most: who pays how much more
P&C pricing actuary or actuarial pricing analyst: who signs
The analyst and the actuary do much of the same arithmetic; what differs is responsibility for it. An actuarial pricing analyst typically builds the data, runs the on-level and trend calculations, prepares exhibits and checks the rating manual against the model. A credentialed pricing actuary takes responsibility for the methods and the conclusions, and puts a name on the memorandum.
The path between them runs through the Casualty Actuarial Society's exams. Ratemaking sits in Exam 5, Basic Ratemaking and Estimating Claim Liabilities, and the CAS's own Basic Ratemaking text, by Werner and Modlin and cited throughout this page, sets out the methods. Its chapters on implementation, including the off-balance factor, capping a single variable and premium transition rules, are the part of the job that dislocation analysis puts into practice; a rate change calculator for insurance works the textbook's capping example line by line.
For job seekers, the useful signal in a posting is which of the seven outputs the role owns. A posting that mentions GLMs and indications but not dislocation, capping or notices describes the first half of the job. Pricing analysts who also want to follow competitors' filings will find that work described in the insurance pricing analyst guide, from Botminds' Competitor Rate Filing Analysis.
Pricing actuary salary and job outlook: what the official figures say
The Bureau of Labor Statistics reports a 2025 median pay of $130,000 a year for actuaries, 31,200 jobs and projected growth of 9% from 2025 to 2035, which it classes as much faster than average. Those are figures for all actuaries, life, health, pension and property-casualty together; BLS does not publish a pricing-only or property-casualty-only median, so any single "pricing actuary salary" figure online comes from a survey with its own sample.
What the official data does say is that the profession is small and expanding, while the number of rate changes it supports is not shrinking. Homeowners premiums have risen sharply: the Federal Insurance Office found average premiums per policy rose 8.7% faster than inflation from 2018 to 2022. Every one of those increases had to be spread across a book, policy by policy, by someone.
Where a pricing actuary's working days go on one state's review
Most of the calendar on a rate review goes to rebuilding the same calculation, not to deciding. Botminds' estimate for one state program's dislocation work, by hand and with the solution, is below. It is an estimate, not a measured result, and the split will differ by carrier and by state.
By hand, re-rating alone takes four of fourteen working days
By hand: 14 working days
- Re-rating each scenario, 4 days · 28.6%
- Tail, cap and notice counts, 6 days · 42.9%
- Exhibits, reconciling and sign-off, 4 days · 28.6%
With the solution: 4 working days
- Re-rating, half a day · 12.5%
- Tail, cap and notice counts, 1.5 days · 37.5%
- Exhibits, tie-out and sign-off, 2 days · 50%
The estimate's point is the shape, not the totals. By hand, a "what if territory goes in at 60%?" question costs a day, so a team compares two or three scenarios rather than the right one. When re-rating takes seconds (the sample run re-rated 186,420 policies in 3.1 seconds), the scenarios are limited by the questions people think to ask.
Skills a pricing actuary job description should list in 2026
The technical core has not changed: credibility, trend, development, classification. What has changed is how much of the implementation regulators and executives expect to see, and how fast. A current job description should ask for these.
Eight things a personal lines pricing actuary is now expected to do
- Re-rate every policy, not an average
Extension of exposures for on-leveling and for impact; the parallelogram method only as an approximation.
- Review a GLM the way a regulator will
Variables, fit, and whether the manual reflects the model output.
- Produce a dislocation analysis for any scenario
The distribution of percentage and dollar changes on renewal business, with the largest explained.
- Design a cap and price it
Policies capped, premium foregone, renewals to reach the filed premium, and the base-rate offset if the overall change must hold.
- Know each state's notice threshold
Texas requires notice of a residential rate increase of 10% or more at least 30 days before it takes effect.
- Keep premiums reproducible
Washington requires a rate stability rule to sit in the filed manual; Missouri's safe harbor asks for enough information to reproduce every premium charged.
- Explain an increase in a policyholder's terms
The factors that drove it, in dollars, in the order they were applied.
- Tie every count before signing
The memorandum, the exhibits and the notice file from one run.
Two items deserve a link of their own. Re-rating every policy is the extension of exposures method, compared with the parallelogram method in extension of exposures vs parallelogram. And knowing each state's notice threshold is a counting problem as much as a legal one, worked through in rate increase notices in California and other states.
How Rate Dislocation Analysis fits the pricing actuary's job
The solution takes the mechanical part of implementation and leaves the judgment where it is. Six agents work on one saved run, identified by rate plan version, in-force extract date and model versions: one re-rates the book, one attributes each policy's change to its rating factors, one proposes a cap and checks it against the carrier's standards, one counts notices and nonrenewals by renewal month, one drafts the exhibits, and one ties every count in the exhibits, the memorandum and the notice file back to the run.
What the agents do not do is the point of the design. They never change a filed rate or a policy record, never send a notice and never file. The head of personal lines approves the scenario; the pricing actuary signs the memorandum, which locks the run. On the sample review the actuary recommended territory at 60% with a +25% renewal cap: 9,165 policies capped, $1.51 million of premium foregone in the first year (0.26% of written premium), +8.4% year-one overall, and 72,907 Texas notices.
Three scenarios side by side, and who signed which
For a pricing actuary, the change is in what can be asked before Friday. To see the re-rate, the tail and the cap on your own book, start from Rate Dislocation Analysis.
Questions people ask
What does a pricing actuarial analyst do?
An actuarial pricing analyst prepares the data and calculations behind a rate change: premium on-leveled to current rates, losses developed and trended, relativities from the classification review, and the exhibits for the filing. On a dislocation analysis the analyst usually builds the re-rate and the distribution of changes. The credentialed actuary reviews the work and signs the memorandum.
Which CAS exam covers ratemaking?
The Casualty Actuarial Society's Exam 5, Basic Ratemaking and Estimating Claim Liabilities. The CAS's Basic Ratemaking text by Werner and Modlin covers on-leveling, the off-balance factor, capping a single rating variable and premium transition rules. Those implementation chapters are the ones dislocation analysis applies.
How much does a pricing actuary earn?
The Bureau of Labor Statistics reports a 2025 median of $130,000 a year for all actuaries, with 31,200 jobs and 9% projected growth from 2025 to 2035. It does not publish a figure for pricing actuaries alone. Salary surveys that do so use their own samples and should be read with that in mind.
Does a P&C pricing actuary decide rate caps?
The actuary designs and prices a cap; the business decides whether to use it, within state rules. Werner and Modlin note the actuary may cap the premium impact on any one territory by adjusting relativities, which then requires an offsetting increase in the base rate. Washington's rule on rate stability rules, WAC 284-24-130, limits a cap to three years and to policyholders who would otherwise see more than a 10% annual change.
What does a pricing actuary give the regulator besides rates?
The actuarial memorandum and its exhibits: the indication, the selection and its justification, the rules, and increasingly the impact on renewal business. The NAIC's predictive-model white paper lists a rate disruption or dislocation analysis, created by re-rating the current book, among the items a reviewer may request, with the largest dollar and percentage impacts.