A rate change impact analysis template for a personal lines filing needs two parts. The first is a distribution: how many renewal policies fall in each band of premium change, from the largest decreases to the largest increases, before and after any cap. The second is an explanation of the extremes: for the policy with the largest percentage increase, and again for the largest dollar increase, each rating attribute's percentage and dollar impact, with the effect of capping shown last, all reconciling to the total. That is the structure of the sample rate-disruption template state regulators published in the NAIC's white paper on predictive models. The fastest way to judge a template, or software that fills it, is to re-run last year's filed rate change through it and see whether it reproduces the exhibit you filed. Botminds' Rate Dislocation Analysis fills both parts from one re-rate of the in-force book, and a pilot on last year's filing is how it is meant to be tested.
The worked template below is the NAIC's own example, an auto policy in Las Vegas. The homeowners example and the pilot use a fictional sample carrier's Texas program as it runs through the solution.
The regulators' sample: one policy's largest increase, attribute by attribute
| Attribute | % impact | Dollar impact | Premium after this step |
|---|---|---|---|
| Current premium | $550.00 | ||
| Insured age (male, 25) | +12.00% | +$66.00 | $616.00 |
| Collision deductible ($1,000) | +10.00% | +$61.60 | $677.60 |
| Territory (ZIP Code 89105) | +4.00% | +$27.10 | $704.70 |
| Vehicle symbol (2003 Honda Accord) | +1.46% | +$10.29 | $714.99 |
| Uncapped change | +30.00% | +$165.00 | $715.00 |
| Effect of capping | −11.54% | −$82.50 | $632.50 |
| Total, capped | +15.00% | +$82.50 | $632.50 |
What a rate change impact analysis template must show
A rate change impact analysis template must show who gets which change and why the largest changes happen, in a form a reviewer can check. The NAIC template does this in three pieces: two histograms of the number of insureds in each band of change, "EXAMPLE Uncapped Rate Disruption" and "EXAMPLE Capped Rate Disruption", in five-point bands from −15% to +20%; an exhibit for the largest percentage increase; and a second for the largest dollar increase.
Two instructions on the largest-increase exhibit do most of the work. "If capping is proposed to apply for this policy, include the impact of capping at the end, after displaying uncapped impacts by attribute." And: "Total percent and dollar impacts should reconcile to the values presented above in this exhibit." The first stops a cap from hiding which attributes drove the increase. The second means the steps must add up, which is only possible if each step is applied to the running premium in the manual's order of calculation.
The exhibit also asks for the policy's characteristics. For home insurance, "at minimum", the age and gender of each named insured, amount of insurance, territory, construction type, protection class, prior loss history and any other attribute whose treatment the filing changes. A reviewer can then rate the policy by hand from the manual and check the answer. The regulator's corresponding information element, C.7.d, asks for the distribution produced by re-rating the current book, with enough information to explain each consumer's change (NAIC, Regulatory Review of Predictive Models).
Pilot it on last year's filing: the pass or fail tests
The cleanest pilot of a template or a tool is a replay. Take the last rate change you filed and implemented, with its in-force extract, rate plan and filed exhibits, and run it through the candidate. You already know the right answers, because you filed them, and you know where the workbook was wrong, because renewals have since happened. A tool that cannot reproduce a filed exhibit is not ready for a live one.
Eight pass or fail tests for a rate change impact analysis pilot
- Policy count and written premium tie to the filed exhibit
To the policy and to the dollar, from the same extract.
- The distribution reproduces the filed one
Band by band; any difference explained down to the policies that cause it.
- Twenty hand-rated policies match
Chosen from every territory and both extremes, rated from the manual by an actuary.
- The largest increases are attributed and reconcile
Factor steps in rating order that sum to the proposed premium, capping last.
- Policies endorsed after the extract are handled
Rated on the endorsed premium and characteristics, or flagged.
- The notice count matches what was mailed
For each state rule, by renewal month, against the mail file you actually sent.
- A new scenario runs in minutes
Move one factor and re-rate the book while the team is in the room.
- Every number can be reproduced
Re-run next week with the same versions and get the same answer.
The order matters. The first four tests check the re-rate itself: if counts, distribution, hand-rated policies and attribution do not tie, nothing downstream can be trusted. The next two check what the workbook usually gets wrong: data that changed after the extract and notices. The last two check whether the tool changes how the team works.
A four-week replay pilot on last year's filed change
- LoadWeek 1
- Reproduce
- Test
- Decide
- Load
- ReproduceWeek 2
- Test
- Decide
- Load
- Reproduce
- TestWeek 3
- Decide
- Load
- Reproduce
- Test
- DecideWeek 4
Four weeks is enough because the data already exists and the answers are known. The time goes into the extract and the rate plan in week 1; if the rate plan cannot be loaded in machine-readable form, that is the first finding, and it applies to every tool, not just one.
A rate change impact analysis example on a homeowners policy
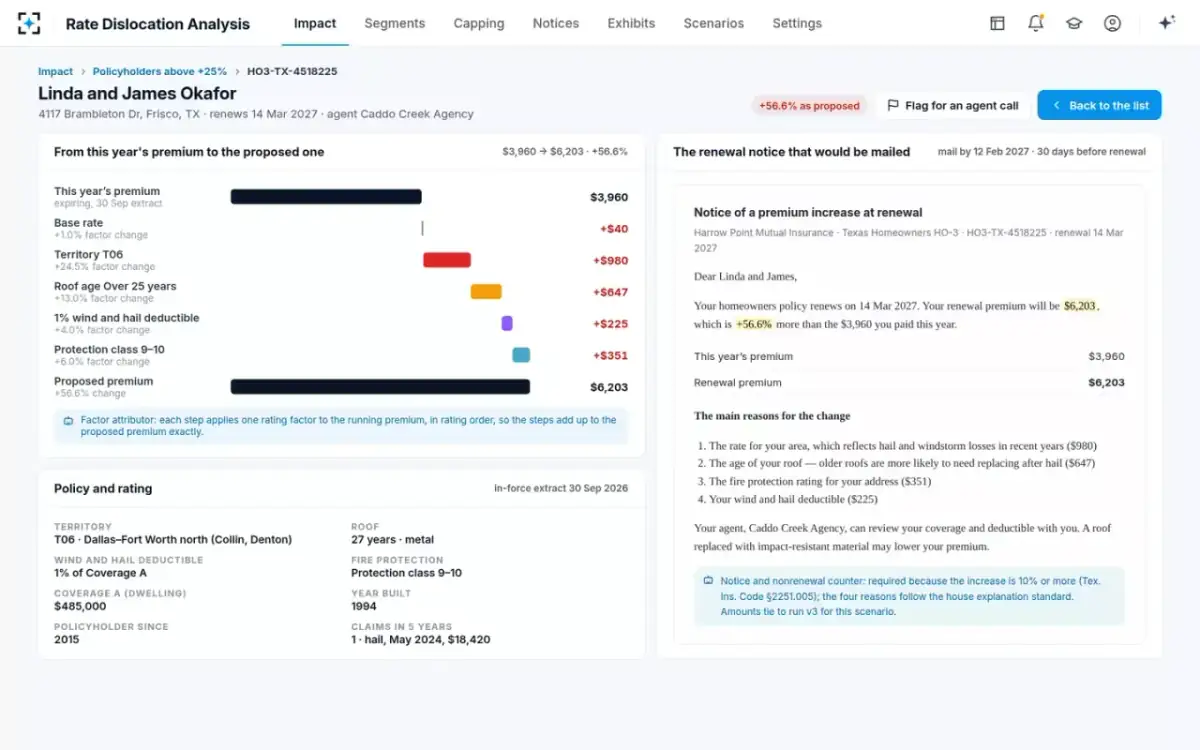
The same template, applied to a homeowners renewal, looks like this. On the sample Texas program, one Frisco policy renewing on 14 March 2027 moves from $3,960 to $6,203, +56.6%, the largest increase in the book with every factor at its full indication.
The sample's largest increase, step by step in rating order
Read as the NAIC asks, the exhibit tells a reviewer that territory drives most of the increase, that the roof is 27 years old, and that no single factor moved by more than 24.5%; the size of the total comes from stacking. It also tells a product manager what to do before the notice is mailed: a cap would limit it, and a replacement roof would remove the second-largest step.
The template filled for one policy, with the notice it would trigger
Why the largest dollar increase is a different policy from the largest percentage
The NAIC template asks for two exhibits, not one, because the policy with the largest percentage increase is rarely the one with the largest dollar increase. A small premium can double without much money changing hands; a large one can rise a modest percentage and cost the policyholder more than anyone else in the book. Each kind of increase produces a different phone call, and a reviewer wants to see both.
The sample tail shows the effect even among near-identical percentages. The Frisco policy above rises +56.6%, $2,243. A Prosper policy one line below it in the tail rises +56.5%, from $6,733 to $10,539: $3,806, seventy per cent more money for a smaller percentage. Both carry the same three drivers, territory T06, a roof over 25 years and protection class 9–10, so the attribution looks alike; the dollars do not. A template that ranks only by percentage would put the Prosper household second and its agent's call first.
The fix is mechanical once the book is re-rated: rank the tail twice, by percentage and by dollars, and explain the top of each list attribute by attribute. The same two rankings serve the product manager deciding which renewals to flag for an agent call before the notices are mailed.
Why a cost impact analysis template in Excel breaks on a real book
A spreadsheet template breaks less on arithmetic than on inputs. Four failures recur, and each shows up in a replay.
The extract is old. On the sample review, a workbook for one scenario counted 71,233 Texas renewal notices; the full re-rate counted 72,907. The 1,674 difference was policies endorsed after the workbook's 31 August extract, rated on their old premium. The order of calculation is approximated. A template that multiplies factor changes without the manual's fees, minimums and rules gets the total roughly right and the attribution wrong. The cap is applied before the attribution. The NAIC asks for capping last for a reason: applied first, it hides which attribute caused the increase. Risk changes are mixed with rate changes. Missouri's guidance on rate stability rules says they are not to moderate premium changes from changes in the policyholder's risk profile, "changes in coverage, exposure, or classification" (Missouri Bulletin 20-01), and Florida requires the renewal notice for residential property to show the dollars due to an approved rate increase apart from the dollars due to coverage changes (Fla. Stat. §627.4133(7)). A template that cannot separate the two cannot meet either.
The same filed change run through a workbook template and a full re-rate
Workbook template: Whatever extract the builder used; often a month old.
Rate Dislocation Analysis: A dated extract with endorsed premiums, recorded with the run.
Workbook template: From cells or a sample; band edges set by hand.
Rate Dislocation Analysis: From every policy; bands and tail line are settings.
Workbook template: Found by sorting; explained by hand, one at a time.
Rate Dislocation Analysis: Listed largest first, each split by rating factor.
Workbook template: Two tabs that must be kept in step.
Rate Dislocation Analysis: Both from the same run, capping applied last.
Workbook template: A separate count, often from another query.
Rate Dislocation Analysis: Counted by state rule from the same run; tied to the exhibit.
Workbook template: Copy the file and start again.
Rate Dislocation Analysis: Move a factor; the book is re-rated.
A rate change impact analysis checklist for the filing itself
Once a tool or template has passed the replay, the same discipline applies to every live filing. The table below is the checklist the sample pricing team works through before the actuary signs; each line is something a reviewer or examiner can ask for.
Before the impact exhibit goes into a filing
| Check | Why it matters | Where the requirement comes from |
|---|---|---|
| Distribution of changes, uncapped and capped | Shows the regulator who is affected and what the cap does | NAIC white paper C.7.d and Appendix D |
| Largest % and largest $ increase explained | The two policies a reviewer will ask about first | NAIC Appendix D |
| Attribution reconciles, capping last | An exhibit that does not add up invites an objection | NAIC Appendix D |
| Rate change separated from coverage change | Notices and caps apply to rate changes | Fla. Stat. §627.4133(7); Missouri Bulletin 20-01 |
| Notice count by state rule and renewal month | An undercount means policyholders owed a notice did not get one | Tex. Ins. Code §2251.005 |
| Exhibit, memo and notice file tie to one run | Three documents, one set of numbers | Good practice; the solution blocks sending otherwise |
| Run saved with its versions | Any premium can be reproduced on request | NAIC C.7.g; Missouri Bulletin 20-01 |
Who signs off a rate change impact analysis, and what each person checks
An impact analysis is signed off in layers, and each layer checks something different. On the sample program the pricing actuary checks that the run reproduces hand-rated policies and that the exhibits tie; the head of personal lines approves the scenario, judging the tail against the rate given up; a chief actuary gives a second approval when the overall change exceeds +15%, a threshold the carrier sets for itself; and the rate filing analyst files only an exhibit the tie-out has passed. Compliance owns the notice count and the mail dates.
One question belongs to no single layer and is easy to drop: what the capped policyholder is told. The NAIC handbook's list of capping questions includes "Should the insured be told what the final premium will be once no more capping is applied?" (NAIC Product Filing Review Handbook). A template that carries the capped and uncapped premium for every capped policy lets the notice answer it, and lets the next filing account for the premium still to come, which Washington requires of any rate stability rule in force.
Every approval on the sample is recorded with who made it and when, and signing the actuarial memorandum locks the run, so the exhibit a regulator questions next year is the one that was approved, not a later copy of the workbook.
Price change impact analysis: what insurance adds
Outside insurance, a price change impact analysis estimates what a new price does to volume and revenue. In personal lines it does that and three more things, because the price is filed and the customer is protected by statute. The change must be shown to the regulator as a distribution, as above. Some changes trigger mandatory notices with deadlines, such as Texas's 10% rule. And any cap or transition rule is itself a rating rule, filed and reviewed; the NAIC handbook for rate reviewers lists the questions, starting with "Which rates should get capped?" (NAIC Product Filing Review Handbook).
The retention side is still there. The CAS ratemaking text describes companies using dislocation to estimate how a rate change will affect retention, against a threshold for the size and spread of changes they consider acceptable. How that threshold is set, and why the average conceals it, is the subject of dislocation analysis in insurance; the cost side of buying a tool is worked in insurance pricing software or the workbook.
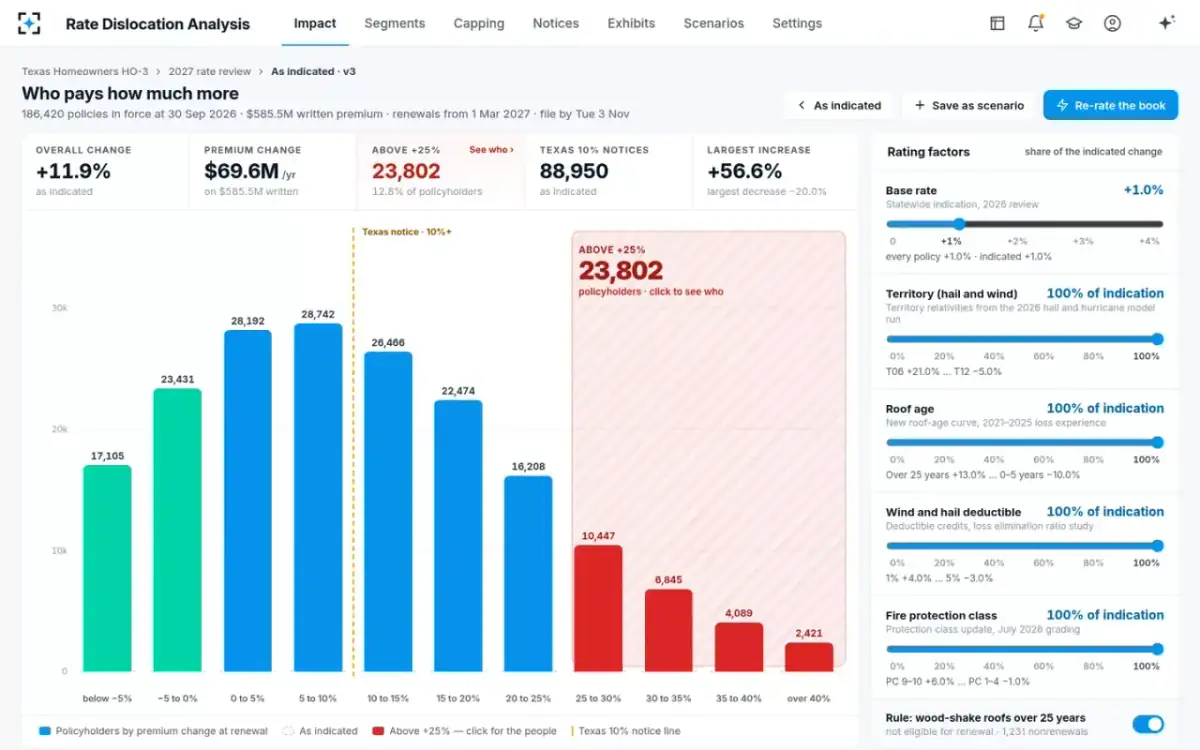
The distribution half of the template, from the whole book
To run the replay on your own last filing, start from Rate Dislocation Analysis; Botminds will run it on your in-force book and a rate plan before any purchase decision.
Questions people ask
What is a rate impact analysis example in insurance?
The NAIC's sample shows an auto policy at $550 whose uncapped change is +30%, $165: +12% for the insured's age, +10% for the collision deductible, +4% for territory and +1.46% for the vehicle symbol. A cap then removes 11.54%, leaving +15% and a $632.50 premium. The same layout works for homeowners, with roof age, territory and deductible as the usual drivers.
Is there a cost impact analysis template in Excel for rate changes?
The NAIC's sample rate-disruption template is the closest thing to a standard, and it is laid out as a spreadsheet exhibit with fields for the insurer to fill. Any Excel version should be fed by a full re-rate of the in-force book, not cell averages. The risk in a spreadsheet is the input data and the version, not the layout.
What goes on a rate change impact analysis checklist?
A distribution of changes uncapped and capped; the largest percentage and dollar increases explained with capping last; rate changes separated from coverage changes; notice counts by state rule; one run behind the exhibit, memorandum and notice file; and a saved run that can be reproduced. Each item traces to a regulator's request or a statute, listed in the table above.
How many bands should a premium change distribution use?
The NAIC sample uses five-point bands from −15% to +20%, with a separate band for exactly 0%. Many carriers add open-ended bands for the extremes and a band boundary at each state's notice threshold, such as 10% in Texas. Narrower bands near a threshold show how many policies a small change would push across it.
How long should a rate change impact analysis pilot take?
About four weeks on a filing already implemented: a week for the data, a week to reproduce the filed exhibit and hand-rate sample policies, a week for scenarios, caps and notices, and a week for review. The replay uses known answers, so the result is a clear pass or fail rather than an impression from a demonstration.