A GLM insurance pricing model is a generalized linear model fitted to claims experience, usually claim frequency, severity or pure premium, against rating variables such as territory, construction, roof age, deductible and driver characteristics. Fitted with the log link that ratemaking models often use, its output is a set of multipliers, which the pricing team tempers and selects into the relativities of a rating manual. Model risk and state regulators then ask five kinds of question: about the data, the variables, the fit, the translation into the manual, and the impact on consumers. The last two cannot be answered from the model at all; they need the proposed manual applied to every policy in force. Botminds' Rate Dislocation Analysis does that re-rate, explains each policy's change by rating factor, and keeps every run reproducible, so the impact evidence a reviewer asks for comes from the same run as the filing.
The regulator's questions on this page are from the NAIC white paper on reviewing predictive models, adopted by state regulators in 2020; the impact examples come from a fictional sample carrier's Texas homeowners program as it runs through the solution.
The model is three parts; the review is about what it does to premiums
3
parts of a GLM: a target variable from the exponential family, a linear predictor and a link function
5
rating variables a reviewer asks for that drive the largest swings in renewal premium, up and down
C.7.d
the NAIC item that asks for a rate disruption or dislocation analysis made by re-rating the book
How a GLM insurance pricing model becomes a rating plan
A GLM becomes a rating plan through selection, and the selection is where impacts are created. The CAS ratemaking text explains the attraction: "the output of a multiplicative GLM is a series of multipliers—much like the insurance industry is accustomed to using in rating algorithms and rating manuals", and models fitted for ratemaking "often specify a log link function, which assumes the rating variables relate multiplicatively to one another" (CAS, Basic Ratemaking).
The multipliers are not filed as they come out. They are credibility-weighted, capped, binned, smoothed and sometimes held back for competitive or customer reasons. The NAIC white paper is precise about where the consequences arise: "Models are often used to produce factor-based indications, which are then used as the basis for the selected changes to the rating plan. It is the changes to the rating plan that create impacts." Its reviewers are told to compare indicated relativities with both current and selected ones, and to obtain support "for all calculations, judgments, or adjustments that connect the model's indicated values to the selected relativities filed in the rating plan" (NAIC, Regulatory Review of Predictive Models).
Today, the white paper notes, "the majority of predictive models used in personal automobile and home insurance rating plans are GLMs." That is why its information elements are written around GLMs; the NAIC's filing review handbook adds that many of them "may be transferable to other types of models, other lines of business, and other applications beyond rating" (NAIC Product Filing Review Handbook).
What regulators ask about a GLM: the information elements, and the evidence for each
Regulators ask about the model, then the rating plan, then the people the plan affects. Appendix B of the NAIC white paper groups its information elements in that order; the table below takes the rating-plan elements a pricing team must answer at filing and names the evidence that answers each one.
The rating-plan questions in the NAIC white paper, and the evidence that answers them
| Element | What the reviewer asks | Evidence a pricing team should hold |
|---|---|---|
| C.1.b | How the model was used to adjust the filed rating algorithm | A narrative from model output to manual, factor by factor |
| C.3.a–b | Model-indicated relativities compared with current and selected ones, with support for every adjustment between them | A table of indicated, current and selected relativities, and the reason for each departure |
| C.7.a | The top five rating variables behind the largest swings in renewal premium, up and down | Each renewal's change attributed to its rating factors, ranked across the book |
| C.7.c | The impacts on renewal business and how management mitigated them | Scenarios compared side by side: tail, cap, premium foregone |
| C.7.d | A rate disruption or dislocation analysis made by re-rating the current book, with enough to explain individual disruptions | The distribution of percentage and dollar changes, with the largest increases explained |
| C.7.g | A means to calculate the rate charged a consumer | A reproducible re-rate: plan version, extract date, order of calculation |
| C.8.a | Whether the manual reflects the model output and any adjustments | The manual applied to sample policies and compared with the model's prediction |
Read down the right-hand column and a pattern appears. The first two rows are about the model and are answered by the modelling team. Every row after them is answered by applying the proposed manual to real policies: attribution, scenarios, a distribution, a reproducible premium. A model risk review that stops at fit statistics has reviewed the half of the filing that regulators ask about least specifically.
A GLM insurance pricing example: tempering a relativity and seeing who it affects
The white paper gives its own example of what a reviewer accepts. If a variable's univariate indicated relativity is 1.5 and the multivariate one is 1.25, "this is potentially a plausible application of the multivariate techniques"; if the univariate is 0.7 and the multivariate 1.25, a regulator "may question whether the attribute in question is negatively correlated with other determinants of risk." The movement of a selected relativity "should be in the direction of the indicated relativity; if not, an explanation is necessary".
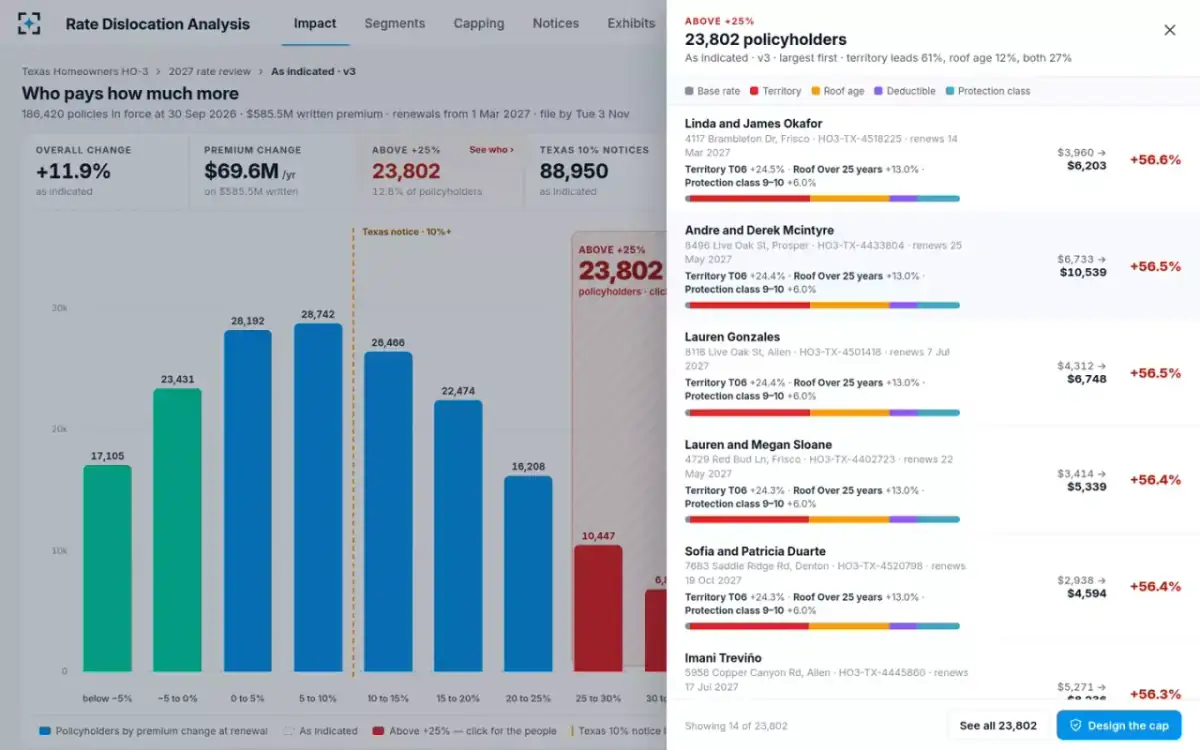
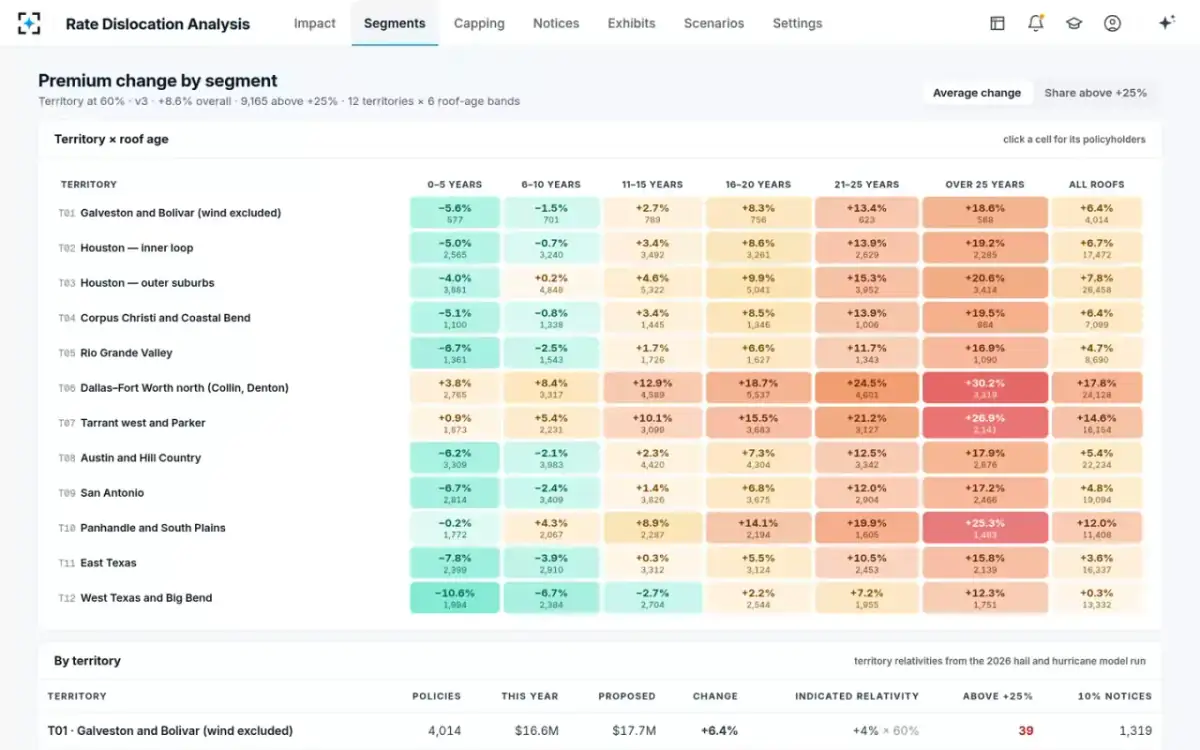
Tempering a relativity in that direction is common and defensible; what it does to policyholders is not visible until the book is re-rated. On the sample Texas homeowners book, the plan with every factor at its full indication moves the book +11.9%, with 23,802 policyholders above +25%. Re-rated with the territory factor at 60% of its indication, the overall change is +8.6% and the tail 9,165. The selected territory relativities still move in the indicated direction, so the C.3 question has an answer; the C.7 questions now have one too.
What drives the largest renewal increases on the sample book
Consumer impacts: the part of a GLM review only a re-rate can answer
The consumer-impact elements ask what the model does to people, and the white paper is explicit that the answer is produced by re-rating. Element C.7.d reads: "Obtain a rate disruption/dislocation analysis, demonstrating the distribution of percentage and/or dollar impacts on renewal business (created by rerating the current book of business) and sufficient information to explain the disruptions to individual consumers." Its comment adds that the analysis "should include the largest dollar and percentage impacts arising from the filing", and that a regulator may go to variable-level detail where a variable has "extreme or disproportionate impacts".
Element C.7.b asks whether the company tested sensitivity, "to identify significant changes in premium due to small or incremental change in a single risk characteristic." A GLM with a steep curve in roof age or credit can produce a large premium change for one more year of roof age; a re-rate that moves one characteristic at a time across the book shows where the cliffs are.
There is also a warning that a model reviewer should take to the capping discussion. Commenting on mitigation of impacts, the white paper notes that "some mitigation efforts may substantially weaken the connection between premium and expected loss and expense and, hence, may be viewed as unfairly discriminatory by some states." A cap is a departure from the model, and it needs its own support. How caps are designed and what they cost is worked through in a rate change calculator for insurance.
The tail, policy by policy, with the factor behind each increase
Does the manual say what the model said? Checking the translation
A model can fit well and still be filed wrong. Element C.8.a asks the reviewer to "verify that the rating plan's manual, in fact, reflects the model output and any adjustments made to the model output." A binning that merged two roof-age bands, a territory boundary redrawn after modelling, or an order of calculation that applies a factor to a fee-inclusive premium will each produce premiums the model never predicted.
The test is to rate policies from the manual and compare. A re-rating run does this at scale, and it is the same run that produces the dislocation exhibit, so a translation error shows up as an unexplained spike in the distribution before it shows up in a regulator's objection. Missouri's guidance on rate stability rules makes the same demand of capped premiums: insurers keep enough information for the department to reproduce the premiums charged (Missouri Bulletin 20-01).
Model risk questions for the re-rate itself
The re-rate is a model too, and model risk should ask it the questions it asks the GLM. What data did it read, as of when? Which version of the rate plan? Which model versions fed the territory indications? Were mid-term endorsements applied? Could someone else reproduce the same numbers next month?
From model to signed filing, with the evidence kept at each step
A person decides
Modelling team fits the GLMTarget, distribution, link and variables chosen; fit and validation documented.
A person decides
Pricing actuary selects relativitiesCredibility, tempering and caps applied, each departure from the indication with a reason.
Agent
Re-rate the in-force bookThe proposed manual applied to every policy, the run saved with plan version, extract date and model versions.
Never: changes a filed rate or a policy
Agent
Attribute and rankEach policy's change split by rating factor; the top variables behind large swings ranked across the book.
Agent
Tie the exhibits to the runDistribution exhibit, memorandum paragraph and notice counts compared with the run before sending.
Never: sends an exhibit that does not tie
A person decides
Model risk and the actuary sign offReview the run like any model: inputs, versions, reproducibility. The actuary signs, which locks the run.
The sample review shows why the extract date belongs on that list. A workbook built for the same scenario from a 31 August extract counted 71,233 Texas renewal notices; the run, on a 30 September extract with endorsements applied, counted 72,907. Both used the same rate plan. The 1,674 difference was data, not modelling, and it would have reached the notice file if the two had not been tied out.
External data, AI and unfair discrimination: the other rules a GLM meets
A GLM that uses external consumer data meets rules beyond actuarial review. New York's Circular Letter No. 7 of 2024 says an insurer should not use external data or AI systems in underwriting or pricing unless a comprehensive assessment establishes that the guidelines are not unfairly or unlawfully discriminatory (NY DFS, Circular Letter 7). Colorado's amended governance regulation for external consumer data and algorithms took effect on 15 October 2025 and now reaches private passenger auto insurers (Colorado Division of Insurance). And the NAIC's model bulletin on insurers' use of AI systems, which the NAIC tracks state by state on an adoption map, expects governance over any AI system used in pricing.
Those rules govern the model's inputs and its testing for bias, a subject covered in depth in what unfair discrimination in insurance means, with the bulletin's governance expectations in NAIC AI bulletin requirements. Dislocation analysis answers a narrower and older question that sits alongside them: whatever the model, how does the proposed change move each existing policyholder's premium, and can the insurer explain it to that policyholder?
Generalized linear model insurance pricing and the models after it
GLMs dominate personal lines rating because they are transparent enough to file. The CAS text calls the GLM "less transparent than the cruder and less accurate univariate results" but favourable "in comparison to other multivariate methods such as neural networks". The NAIC white paper names the methods coming next, "random forests, decision trees, neural networks", and says they "will make a state insurance regulator's understanding and oversight of filed rating plans that incorporate predictive models even more challenging."
Whatever the model, the filing is a manual, and the impact on consumers is measured by applying that manual to the book. That is why dislocation evidence becomes more important, not less, as models grow harder to read: when a reviewer cannot follow the model, the distribution of changes and the explanation of the largest ones are what remain checkable.
Before a GLM-based rating plan is filed: seven checks
- Indicated, current and selected relativities side by side
Every departure from the indication with its reason (C.3).
- Selections move in the indicated direction
Or carry an explanation of why they do not.
- The manual reproduces the model
Sample policies rated from the manual and compared with the model's prediction (C.8.a).
- A dislocation analysis from a full re-rate
Distribution of percentage and dollar changes, with the largest explained (C.7.d).
- The top five variables behind large swings
Up and down, ranked from every policy (C.7.a).
- Sensitivity of premium to single characteristics
Steps in roof age, credit or age that produce cliffs (C.7.b).
- A reproducible run
Plan version, extract date and model versions saved with every number (C.7.g).
Which policies end up where in the distribution is shown by territory and roof age on the sample book below. For a buyer weighing tools for this work, insurance pricing software or the workbook compares the options and their cost; to see the re-rate on your own model and manual, start from Rate Dislocation Analysis.
Where the tail lives: average change by territory and roof age
Questions people ask
What is a GLM insurance pricing example?
A homeowners frequency model might use a Poisson distribution and a log link, with territory, roof age, construction and deductible as variables; its fitted coefficients, exponentiated, are multipliers, say 1.13 for a roof over 25 years against a base band (an illustration, not a real model). The pricing team then selects relativities from those multipliers, tempering some, and the manual multiplies them with a base rate. The NAIC white paper's own example compares a univariate relativity of 1.5 with a multivariate 1.25 and calls that plausible.
Why do insurance GLMs use a log link?
Because a log link makes the rating variables act multiplicatively, which is how most personal lines rating algorithms already work. The CAS ratemaking text notes that GLMs fitted for ratemaking often specify a log link for this reason. The output is a series of multipliers that drop into a rating manual.
What is the NAIC predictive model white paper?
It is Regulatory Review of Predictive Models, a guide for state rate reviewers adopted by NAIC committees in 2020. Its Appendix B lists information elements for reviewing GLMs in personal auto and homeowners filings, from the data and the model to the filed rating plan and consumer impacts. Element C.7.d asks for a dislocation analysis made by re-rating the current book.
Is GLM actuarial pricing being replaced by machine learning?
Not in the filed rating plan, so far: the NAIC white paper (2020) says most models used in personal auto and home rating plans are GLMs. It names random forests, decision trees, neural networks and ensembles as the methods coming next, and expects them to make review harder. The filed manual is reviewed for its impact on renewals either way.
Does capping a rate change conflict with the GLM?
It departs from it, and needs support. The NAIC white paper warns that some mitigation efforts may weaken the link between premium and expected cost and be viewed as unfairly discriminatory by some states. Washington's rule on rate stability rules, WAC 284-24-130, treats a capping rule that breaks its standards as unfairly discriminatory.